
Exhibit 99.2
Supplemental Financial Disclosure June 1, 2026
2 FORWARD - LOOKING STATEMENTS This long - range plan contains forward - looking statements. Forward - looking statements relate to future events and anticipated res ults of operations, business strategies, and other aspects of our operations or operating results. In many cases you can identify forward - looking statements by terminology such as “anticipate,” “intend,” “project,” “estimate,” “continue,” “potential,” “should,” “could,” “may,” “will,” “objective,” “guidance,” “outlook,” “effort,” “expect,” “believe,” “predict,” “budget,” “projection,” “goal,” “pl an,” “forecast,” “target” or similar words or figures for years followed by the letter “E” . All references to financial, operating, and other business information in future periods that do not otherwise include such termi nol ogy but otherwise clearly indicate a future period after the year 2025 are considered forward looking statements. Statements may be forward looking even in the absence of these particular words. Where , i n any forward - looking statement, Optimum Communications expresses an expectation or belief as to future results, such expectation or belief is expressed in good faith and believed t o h ave a reasonable basis. However, there can be no assurance that such expectation or belief will result or be achieved. The actual results of operations can and will be affected by a variety of r isk s and other matters. Other factors that could cause actual results to differ materially from those described in the forward - looking statements include other economic, business, competitive and/or regulator y factors affecting our business generally as set forth in our filings with the Securities and Exchange Commission. Unless legally required, Optimum Communications undertakes no obligation to update pu bli cly any forward - looking statements, whether as a result of new information, future events or otherwise. NON - GAAP FINANCIAL MEASURES We define Adjusted EBITDA, which is a non - GAAP financial measure, as net income (loss) excluding income taxes, non - operating inc ome or expenses, gain (loss) on extinguishment of debt and write - off of deferred financing costs, gain (loss) on interest rate swap contracts, gain (loss) on derivative contracts, gain (loss) on in vestments and sale of affiliate interests, interest expense, net, depreciation and amortization, share - based compensation, restructuring, impairments and other operating items (such as significant legal settleme nts and contractual payments for terminated employees). We define Adjusted EBITDA margin as Adjusted EBITDA divided by total revenue. Adjusted EBITDA eliminates the significant non - cash deprecia tion and amortization expense that results from the capital - intensive nature of our business and from intangible assets recognized from acquisitions, as well as certain non - cash and other operating items that affect the period - to - period comparability of our operating performance. In addition, Adjusted EBITDA is unaffected by our capital and tax structures and by our investment activities. W e b elieve Adjusted EBITDA is an appropriate measure for evaluating our operating performance. Adjusted EBITDA and similar measures with similar titles are common performance measures used by inves tor s, analysts and peers to compare performance in our industry. Internally, we use revenue and Adjusted EBITDA measures as important indicators of our business performance and evaluate mana gem ent’s effectiveness with specific reference to these indicators. We believe Adjusted EBITDA provides management and investors a useful measure for period - to - period comparisons of our core business and operating results by excluding items that are not comparable across reporting periods or that do not otherwise relate to our ongoing operating results. Adjusted EBITDA should be viewed a s a supplement to and not a substitute for operating income (loss), net income (loss), and other measures of performance presented in accordance with U.S. generally accepted accounting principles ( "GA AP"). Since Adjusted EBITDA is not a measure of performance calculated in accordance with GAAP, this measure may not be comparable to similar measures with similar titles used by other com panies. For a reconciliation of Adjusted EBITDA to net income (loss), see Optimum Communications earnings releases posted to the Optimum Communications website for the respective periods. In cert ain periods Adjusted EBITDA is provided on a forward - looking basis. The Company has not included a reconciliation of projected Adjusted EBITDA to net income (loss), which is the most directly c omp arable GAAP measure, in reliance on the unreasonable efforts exception provided under Item 10(e)(1)( i )(B) of Regulation S - K. The Company’s projected Adjusted EBITDA excludes certain items that are inherently uncertain and difficu lt to predict and may significantly impact the projection of net income (loss). Optimum cannot provide a reconciliation to net income (loss) on a forward - looking basis. NOTES + All figures shown are exclusive of CSC Lightpath Holdings LLC (“ Lightpath ”) unless noted. + Figures are rounded independently and may not sum to totals shown. Differences are attributable to rounding only. + East comprises New York, New Jersey, Connecticut, and Pennsylvania . + West comprises Arizona, Arkansas, California, Idaho, Kansas, Kentucky, Louisiana, Mississippi, Missouri, Nevada, New Mexico, Nor th Carolina, Ohio, Oklahoma, Texas, Virginia, and West Virginia.
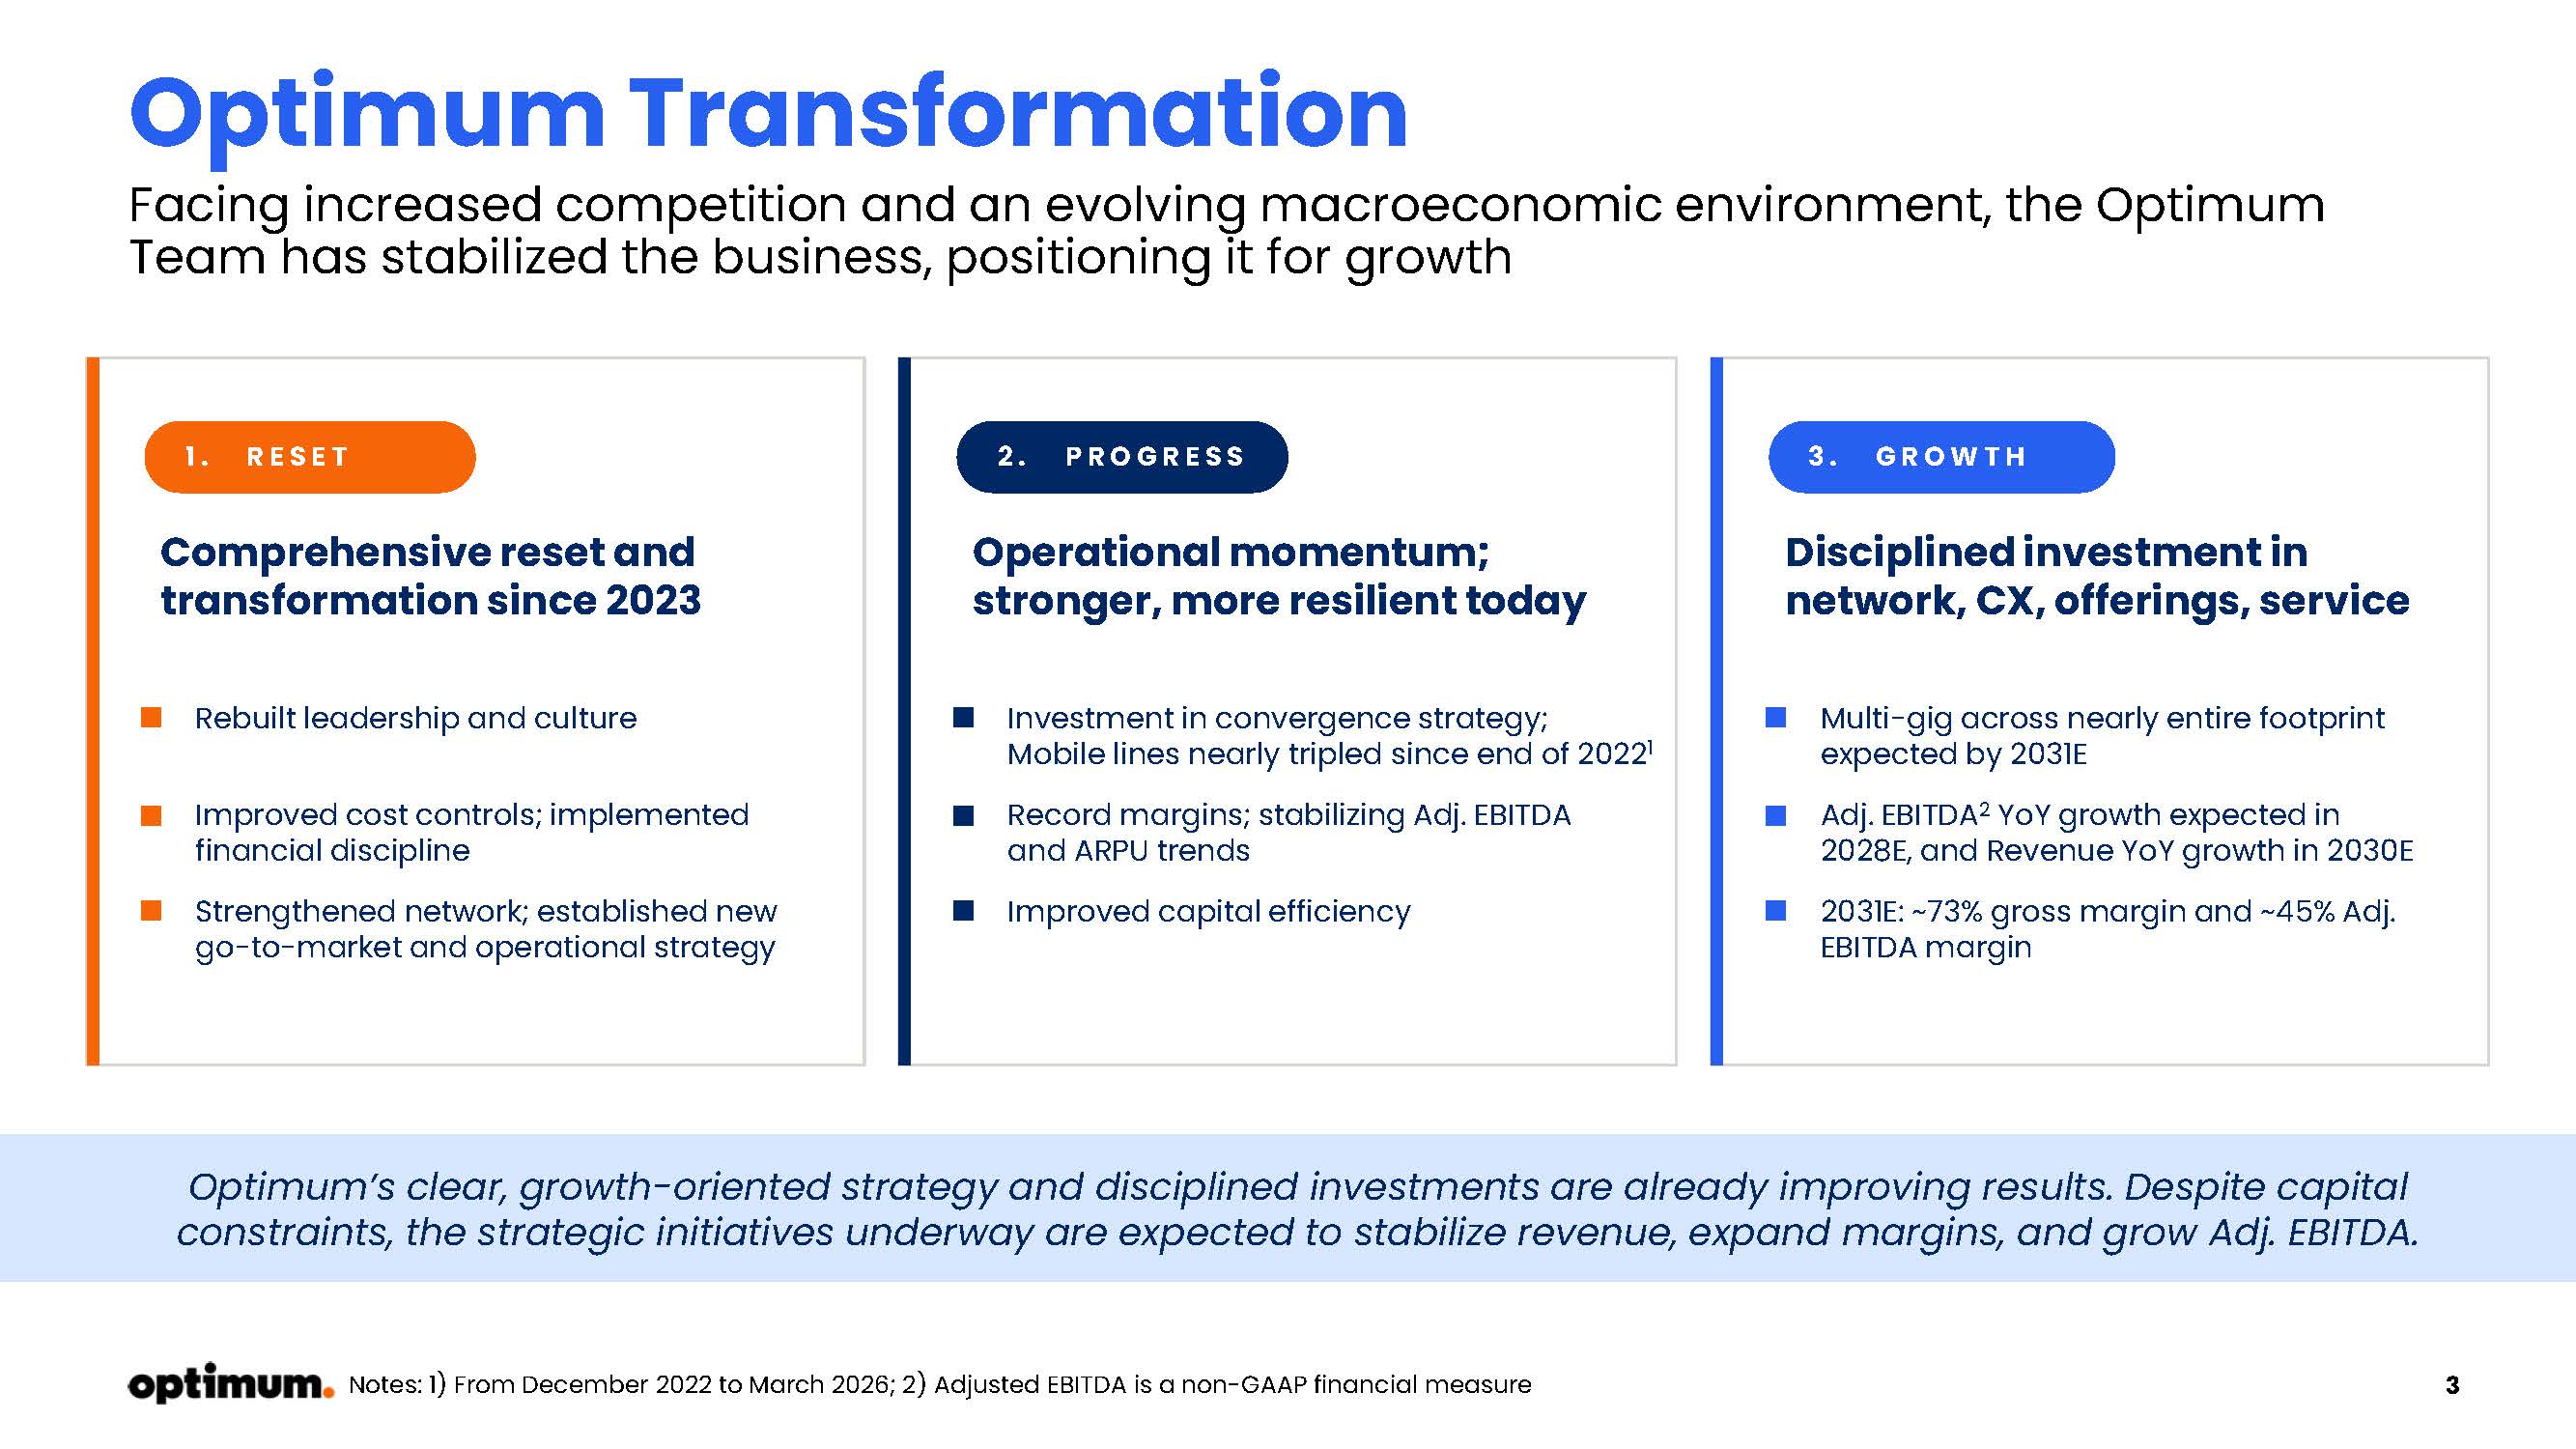
3 Optimum Transformation Facing increased competition and an evolving macroeconomic environment, the Optimum Team has stabilized the business, positioning it for growth 1. RESET Comprehensive reset and transformation since 2023 Rebuilt leadership and culture Improved cost controls; implemented financial discipline Strengthened network; established new go - to - market and operational strategy 2. PROGRESS Operational momentum; stronger, more resilient today Investment in convergence strategy; Mobile lines nearly tripled since end of 2022 1 Record margins; stabilizing Adj. EBITDA and ARPU trends Improved capital efficiency 3. GROWTH Disciplined investment in network, CX, offerings, service Multi - gig across nearly entire footprint expected by 2031E Adj. EBITDA 2 YoY growth expected in 2028E, and Revenue YoY growth in 2030E 2031E: ~73% gross margin and ~45% Adj. EBITDA margin Optimum’s clear, growth - oriented strategy and disciplined investments are already improving results. Despite capital constraints , the strategic initiatives underway are expected to stabilize revenue, expand margins, and grow Adj. EBITDA. Notes: 1) From December 2022 to March 2026; 2) Adjusted EBITDA is a non - GAAP financial measure
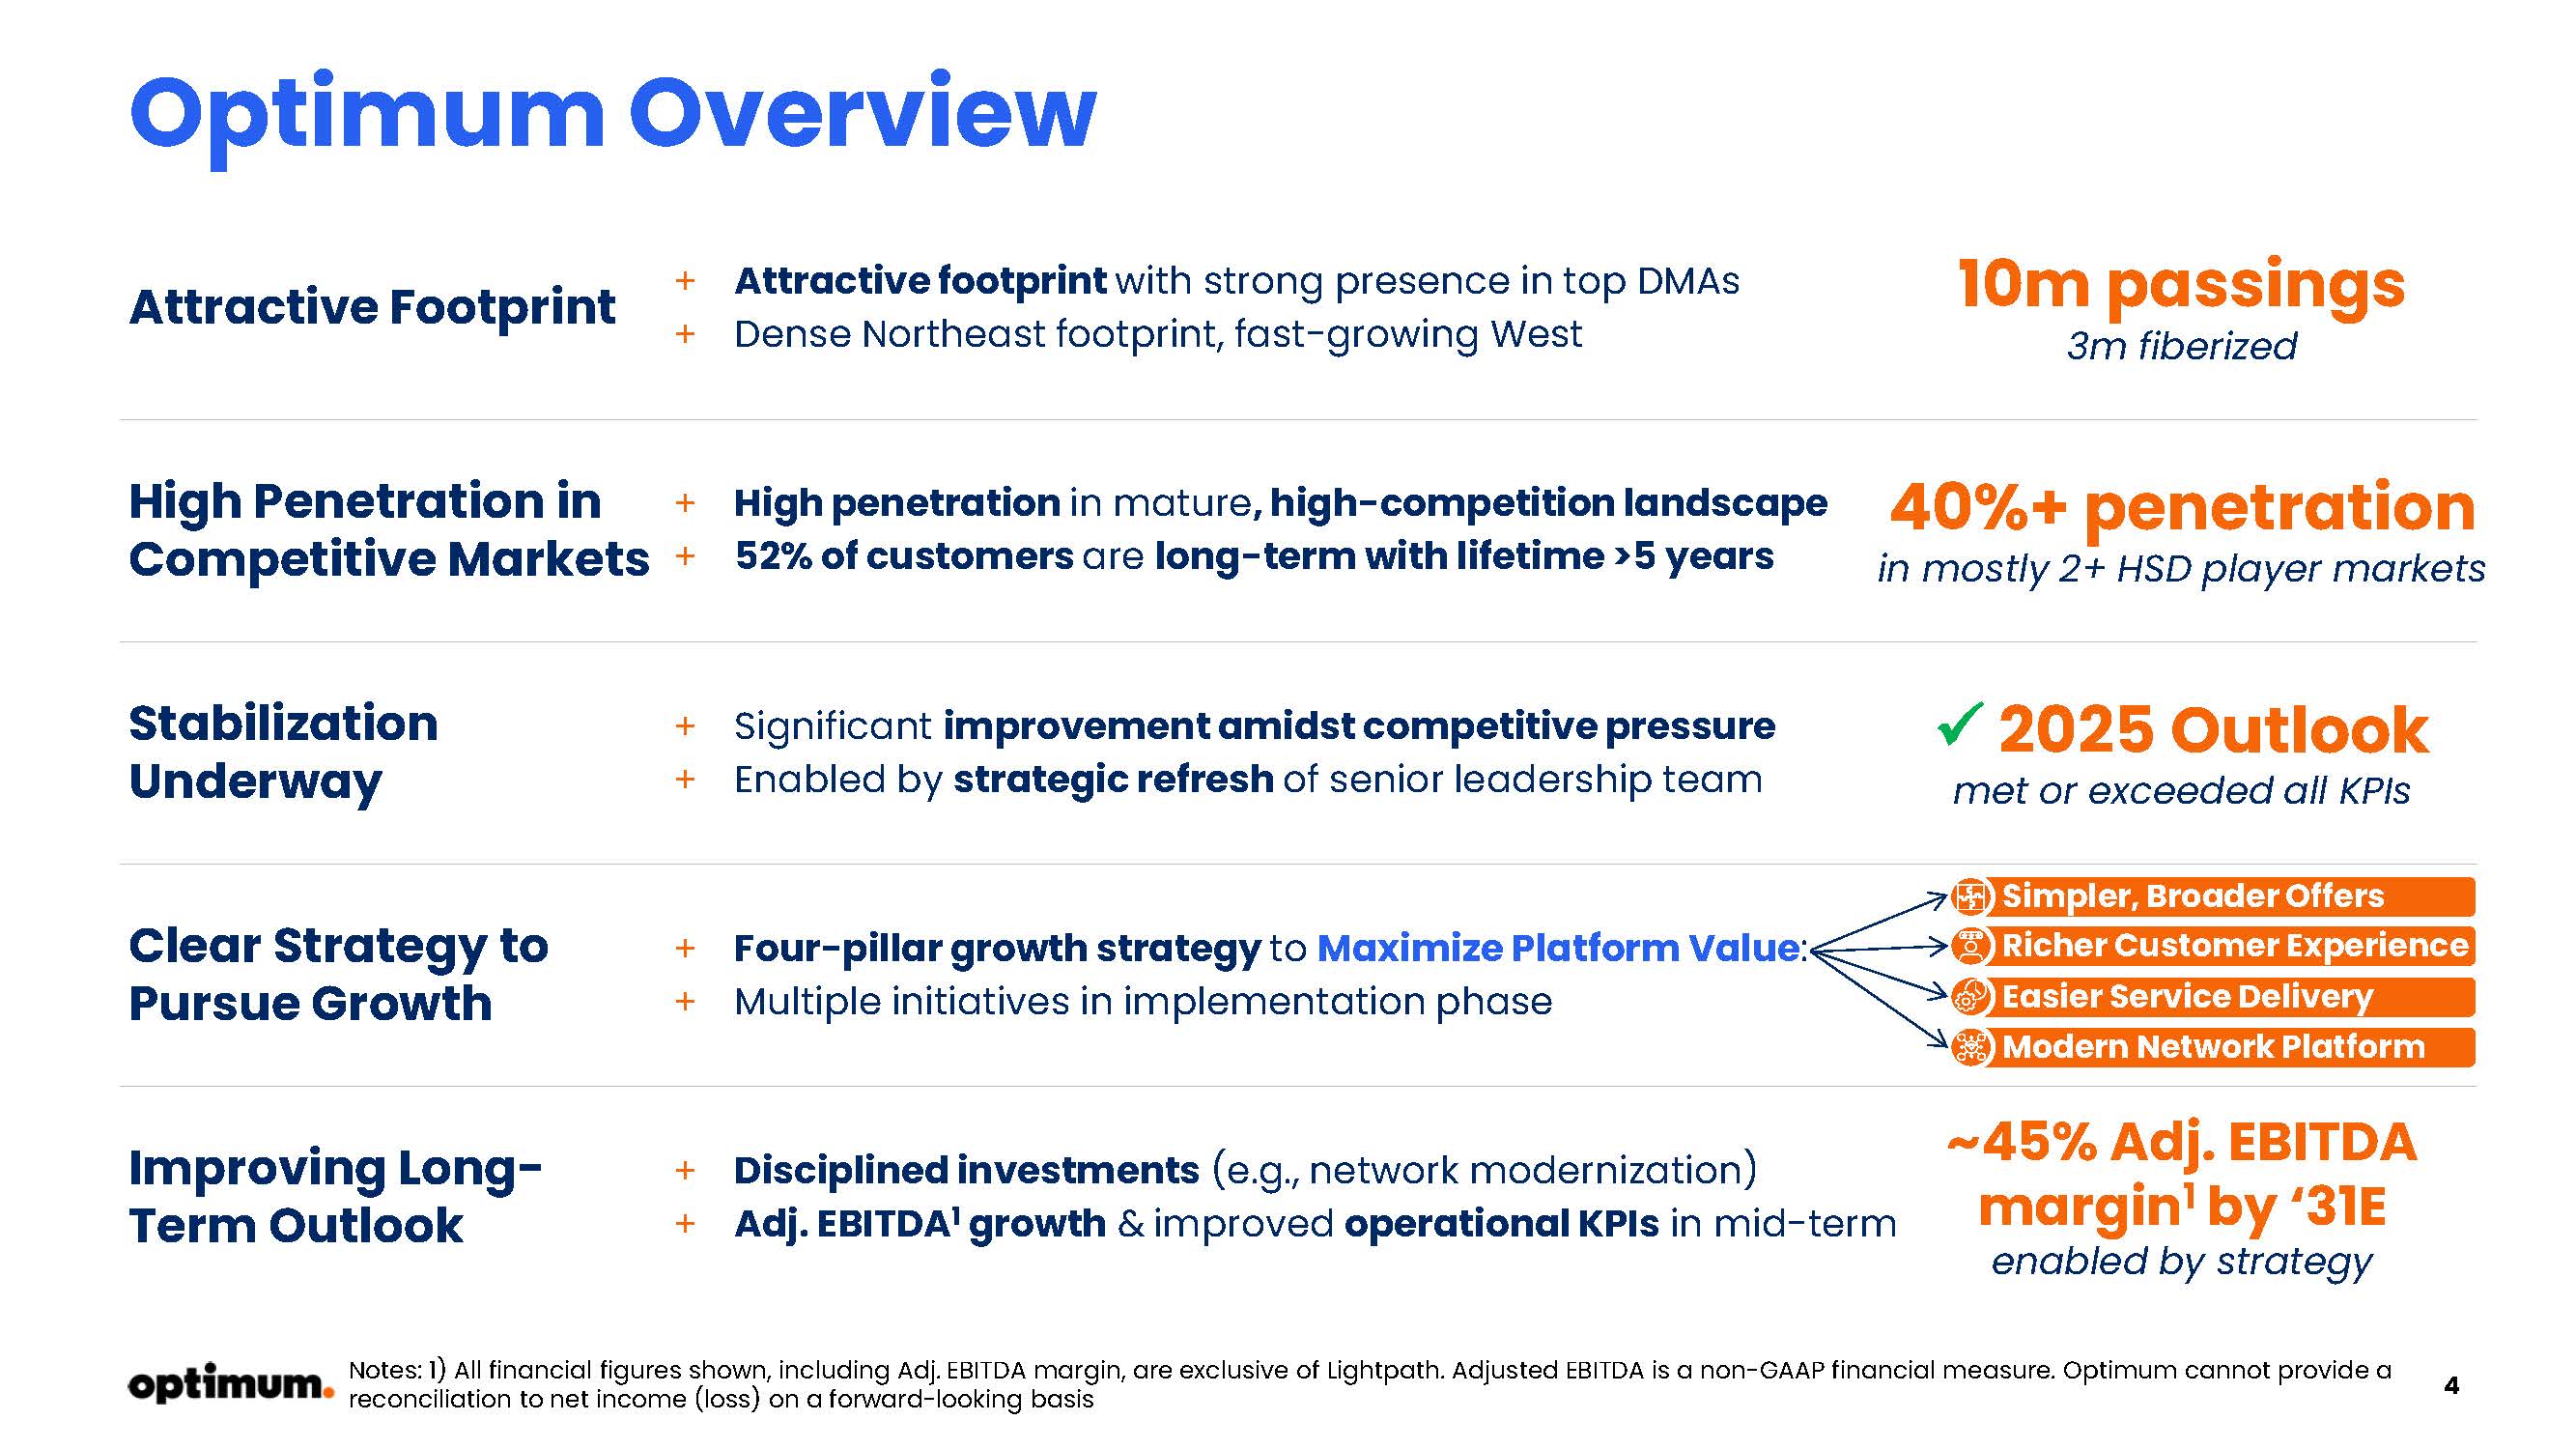
4 Optimum Overview Stabilization Underway Improving Long - Term Outlook + Significant improvement amidst competitive pressure + Enabled by strategic refresh of senior leadership team + Disciplined investments (e.g., network modernization) + Adj. EBITDA 1 growth & improved operational KPIs in mid - term Attractive Footprint + Attractive footprint with strong presence in top DMAs + Dense Northeast footprint, fast - growing West 10m passings 3m fiberized High Penetration in Competitive Markets + High penetration in mature , high - competition landscape + 52% of customers are long - term with lifetime >5 years 40%+ penetration in mostly 2+ HSD player markets x 20 25 Outlook met or exceeded all KPIs ~45% Adj. EBITDA margin 1 by ‘31E enabled by strategy Clear Strategy to Pursue Growth + Four - pillar growth strategy to Maximize Platform Value : + Multiple initiatives in implementation phase Simpler, Broader Offers Richer Customer Experience Easier Service Delivery Modern Network Platform Notes: 1) All financial figures shown, including Adj. EBITDA margin, are exclusive of Lightpath . Adjusted EBITDA is a non - GAAP financial measure. Optimum cannot provide a reconciliation to net income (loss) on a forward - looking basis
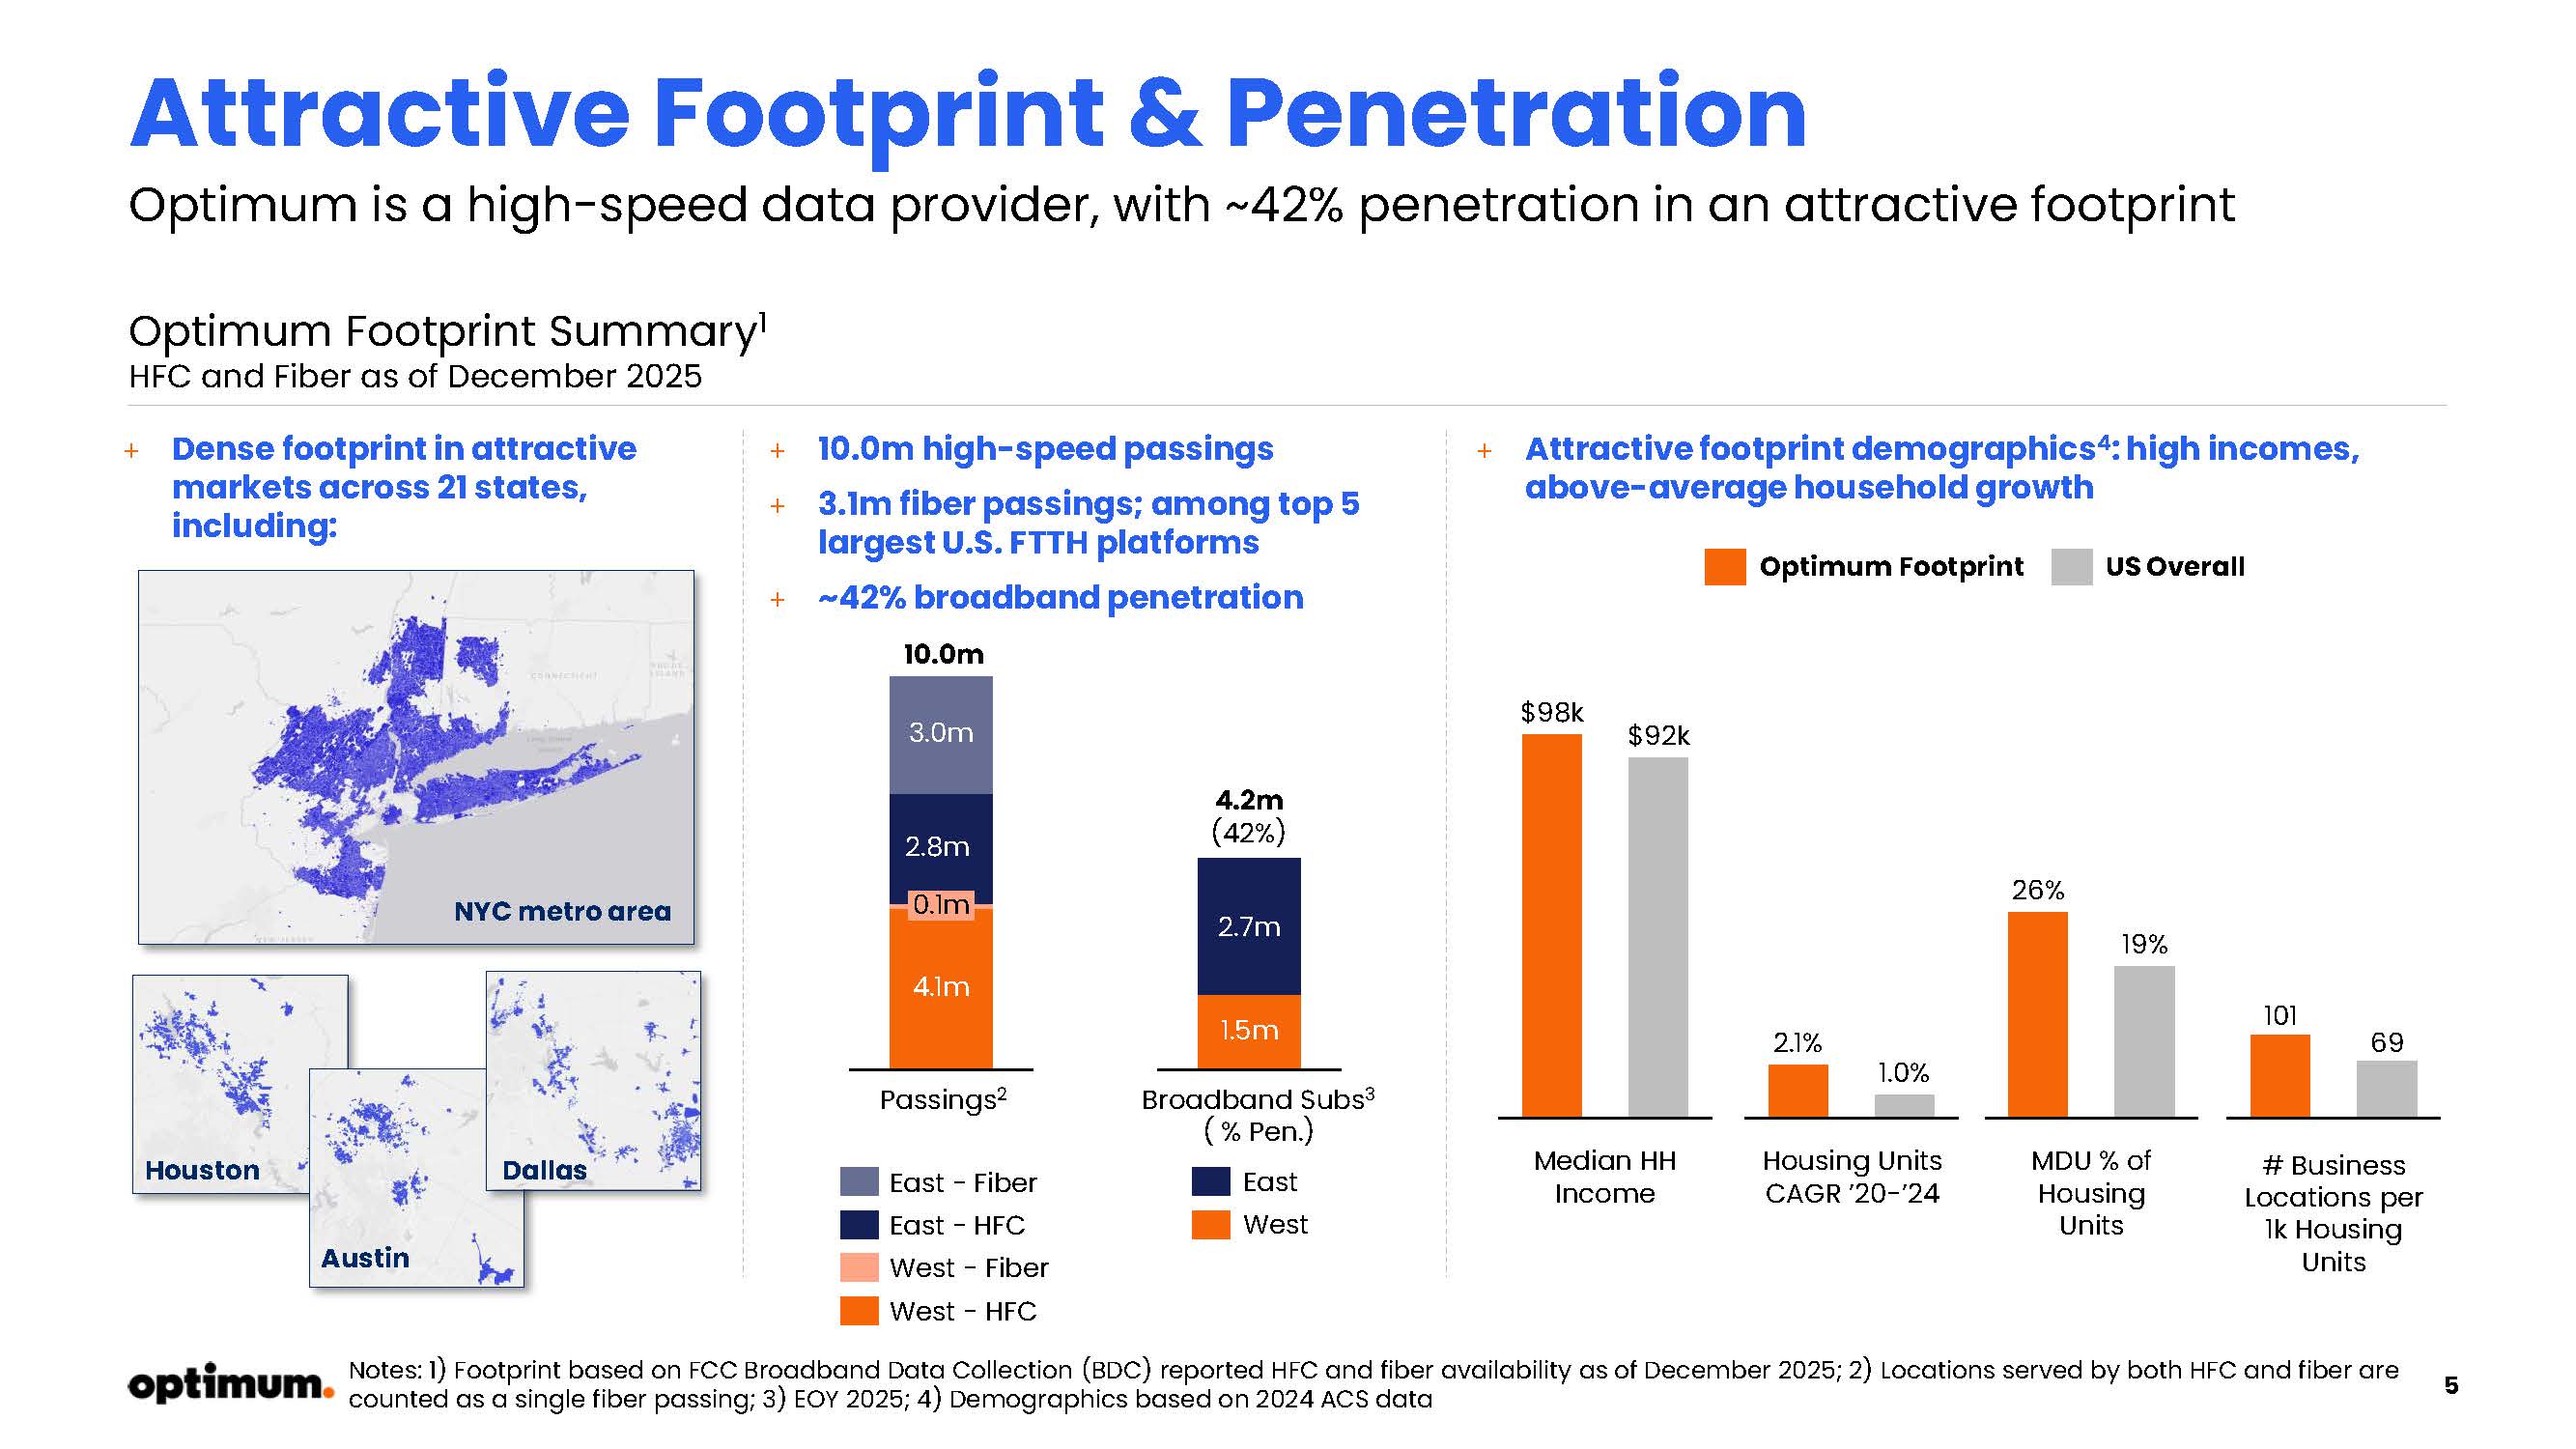
5 Attractive Footprint & Penetration Optimum is a high - speed data provider, with ~42% penetration in an attractive footprint + Dense footprint in attractive markets across 21 states, including: Optimum Footprint Summary 1 HFC and Fiber as of December 2025 Optimum Footprint US Overall + 10.0m high - speed passings + 3.1m fiber passings; among top 5 largest U.S. FTTH platforms + ~42% broadband penetration + Attractive footprint demographics 4 : high incomes, above - average household growth $98k $92k 2.1% 1.0% 26% 19% 101 69 Median HH Income Housing Units CAGR ’20 - ’24 MDU % of Housing Units # Business Locations per 1k Housing Units Notes: 1) Footprint based on FCC Broadband Data Collection (BDC) reported HFC and fiber availability as of December 2025; 2) Loc ations served by both HFC and fiber are counted as a single fiber passing; 3) EOY 2025; 4) Demographics based on 2024 ACS data NYC metro area 3 .0m 2.8m 0.1m 4.1m 2.7m 1.5m East - Fiber East - HFC West - Fiber West - HFC Passings 2 Broadband Subs 3 ( % Pen.) 10.0m 4.2m (42%) West East Houston Austin Dallas
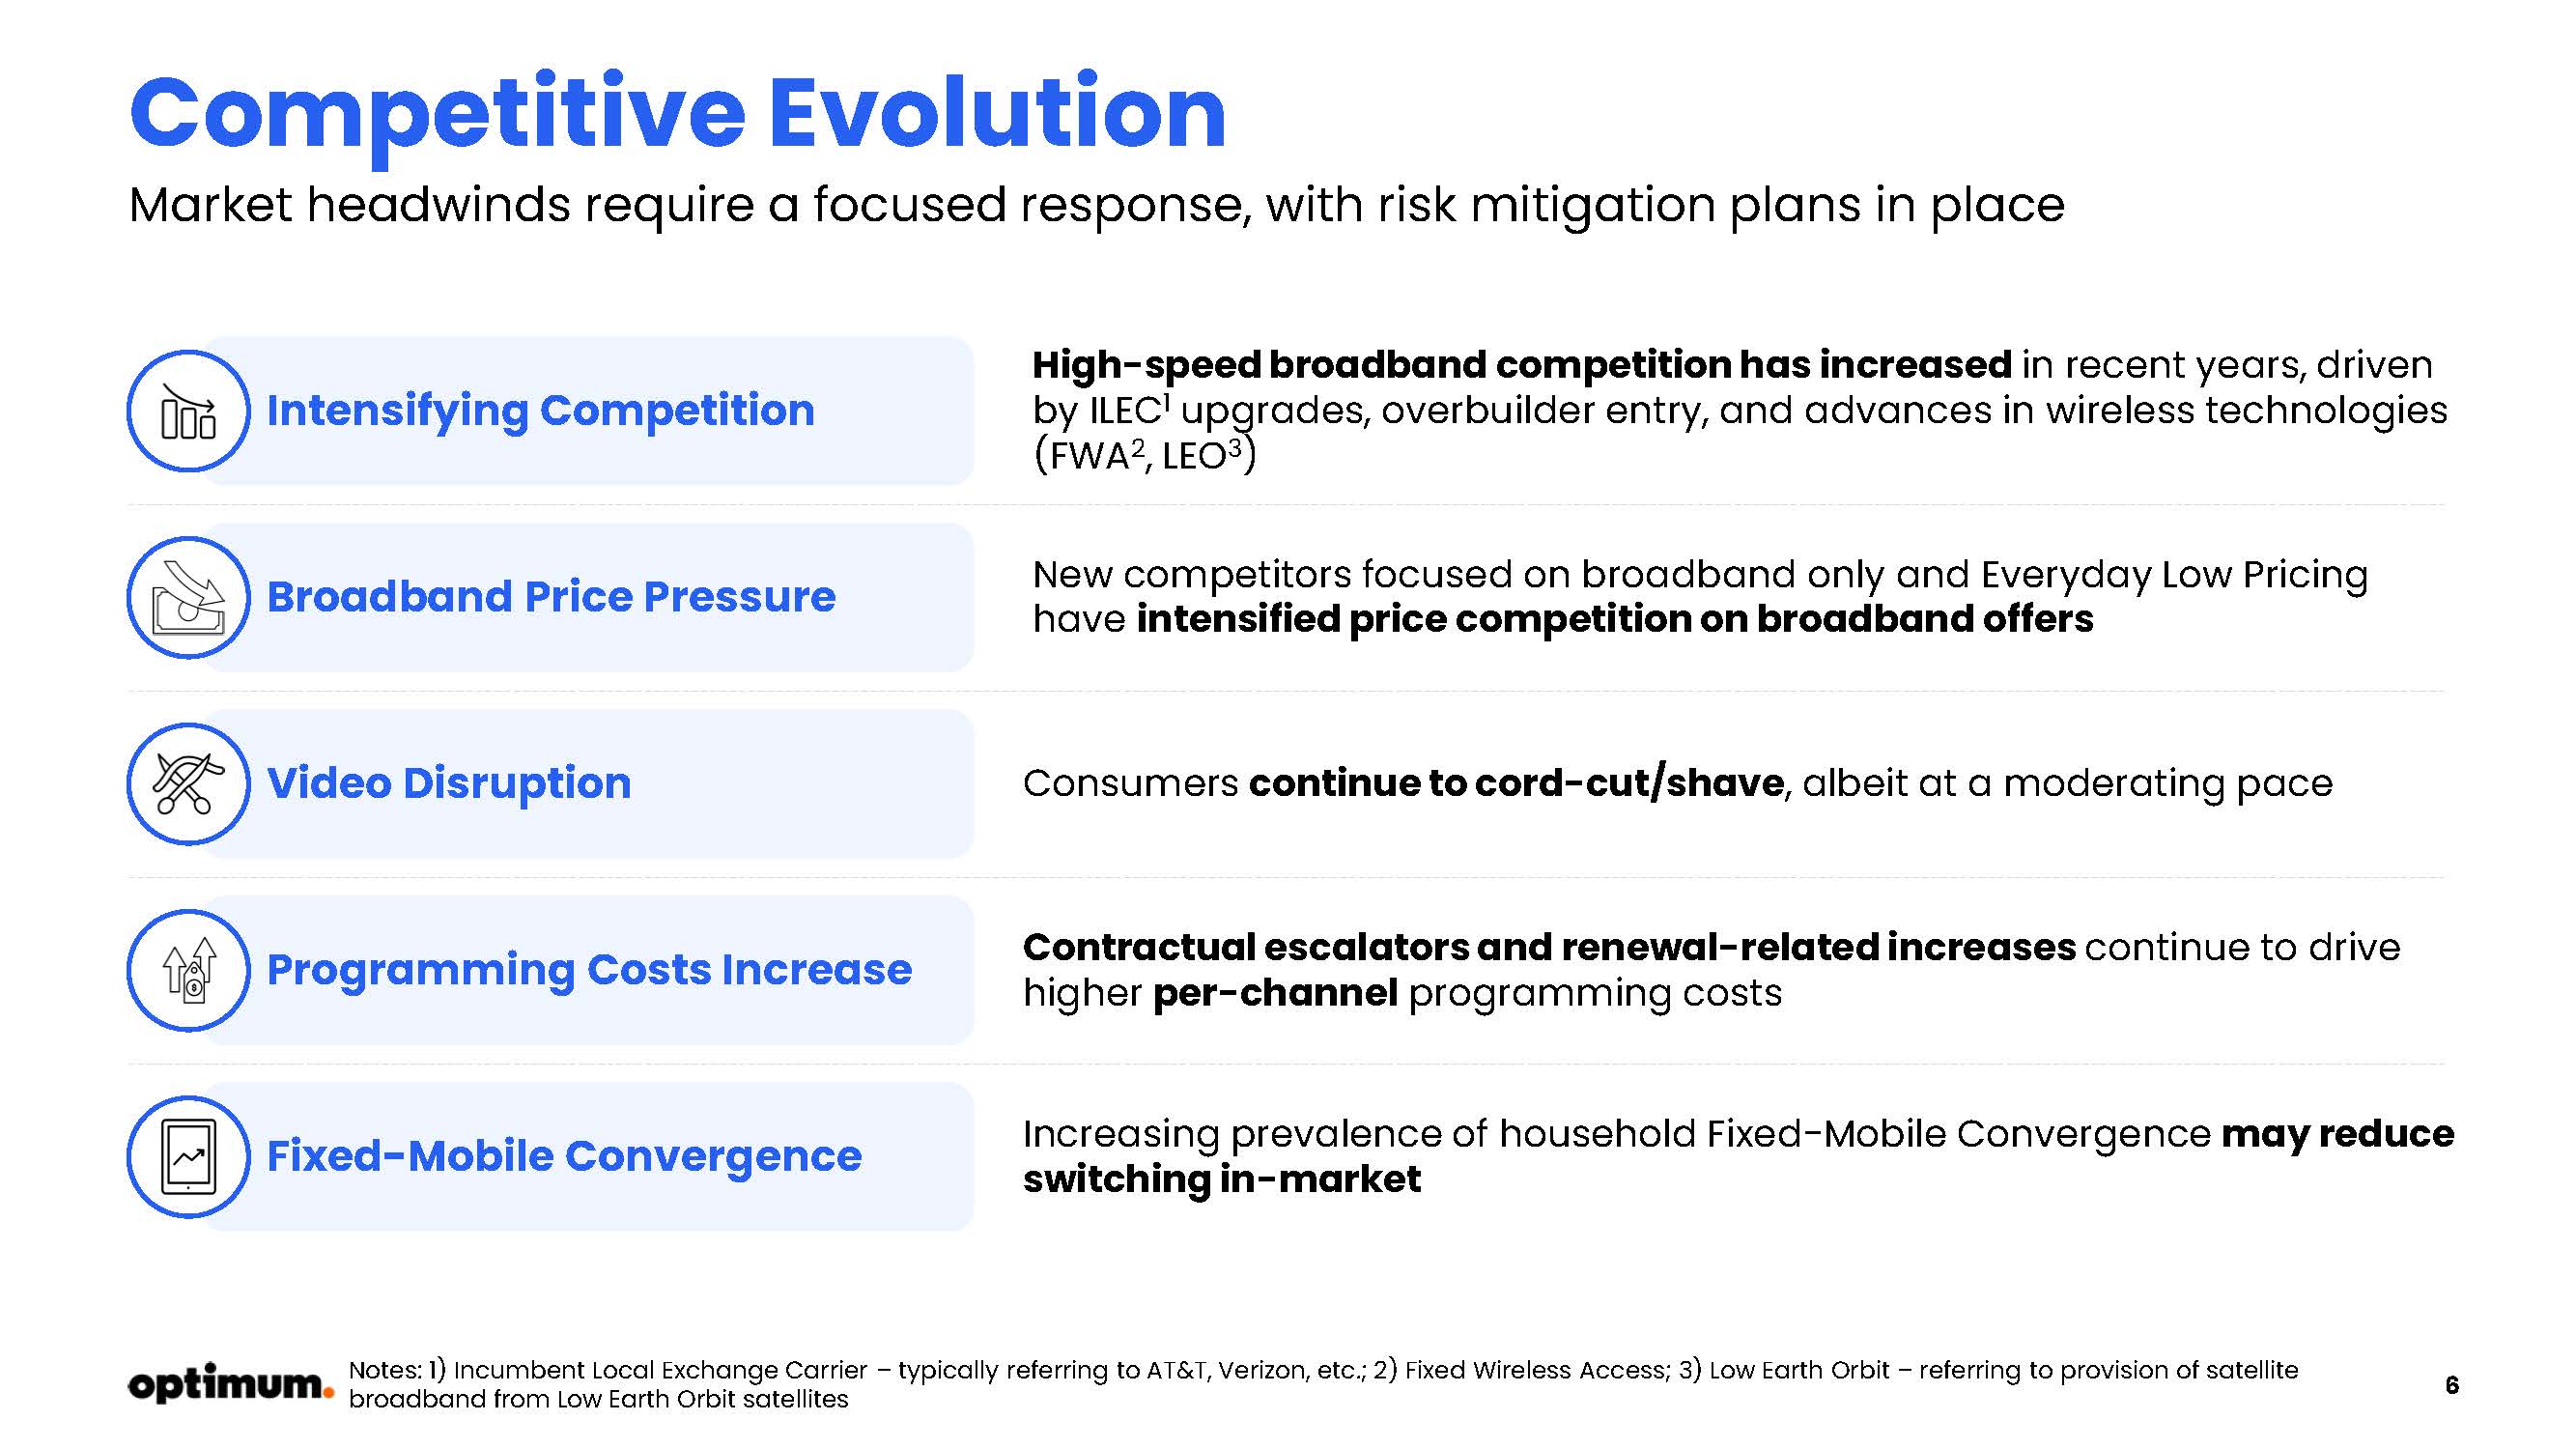
6 Broadband Price Pressure Fixed - Mobile Convergence Video Disruption Programming Costs Increase Intensifying Competition Consumers continue to cord - cut/shave , albeit at a moderating pace New competitors focused on broadband only and Everyday Low Pricing have intensified price competition on broadband offers High - speed broadband competition has increased in recent years, driven by ILEC 1 upgrades, overbuilder entry, and advances in wireless technologies (FWA 2 , LEO 3 ) Increasing prevalence of household Fixed - Mobile Convergence may reduce switching in - market Competitive Evolution Market headwinds require a focused response, with risk mitigation plans in place Contractual escalators and renewal - related increases continue to drive higher per - channel programming costs Notes: 1) Incumbent Local Exchange Carrier – typically referring to AT&T, Verizon, etc.; 2) Fixed Wireless Access; 3) Low Earth Orbit – referring to provision of satellite broadband from Low Earth Orbit satellites
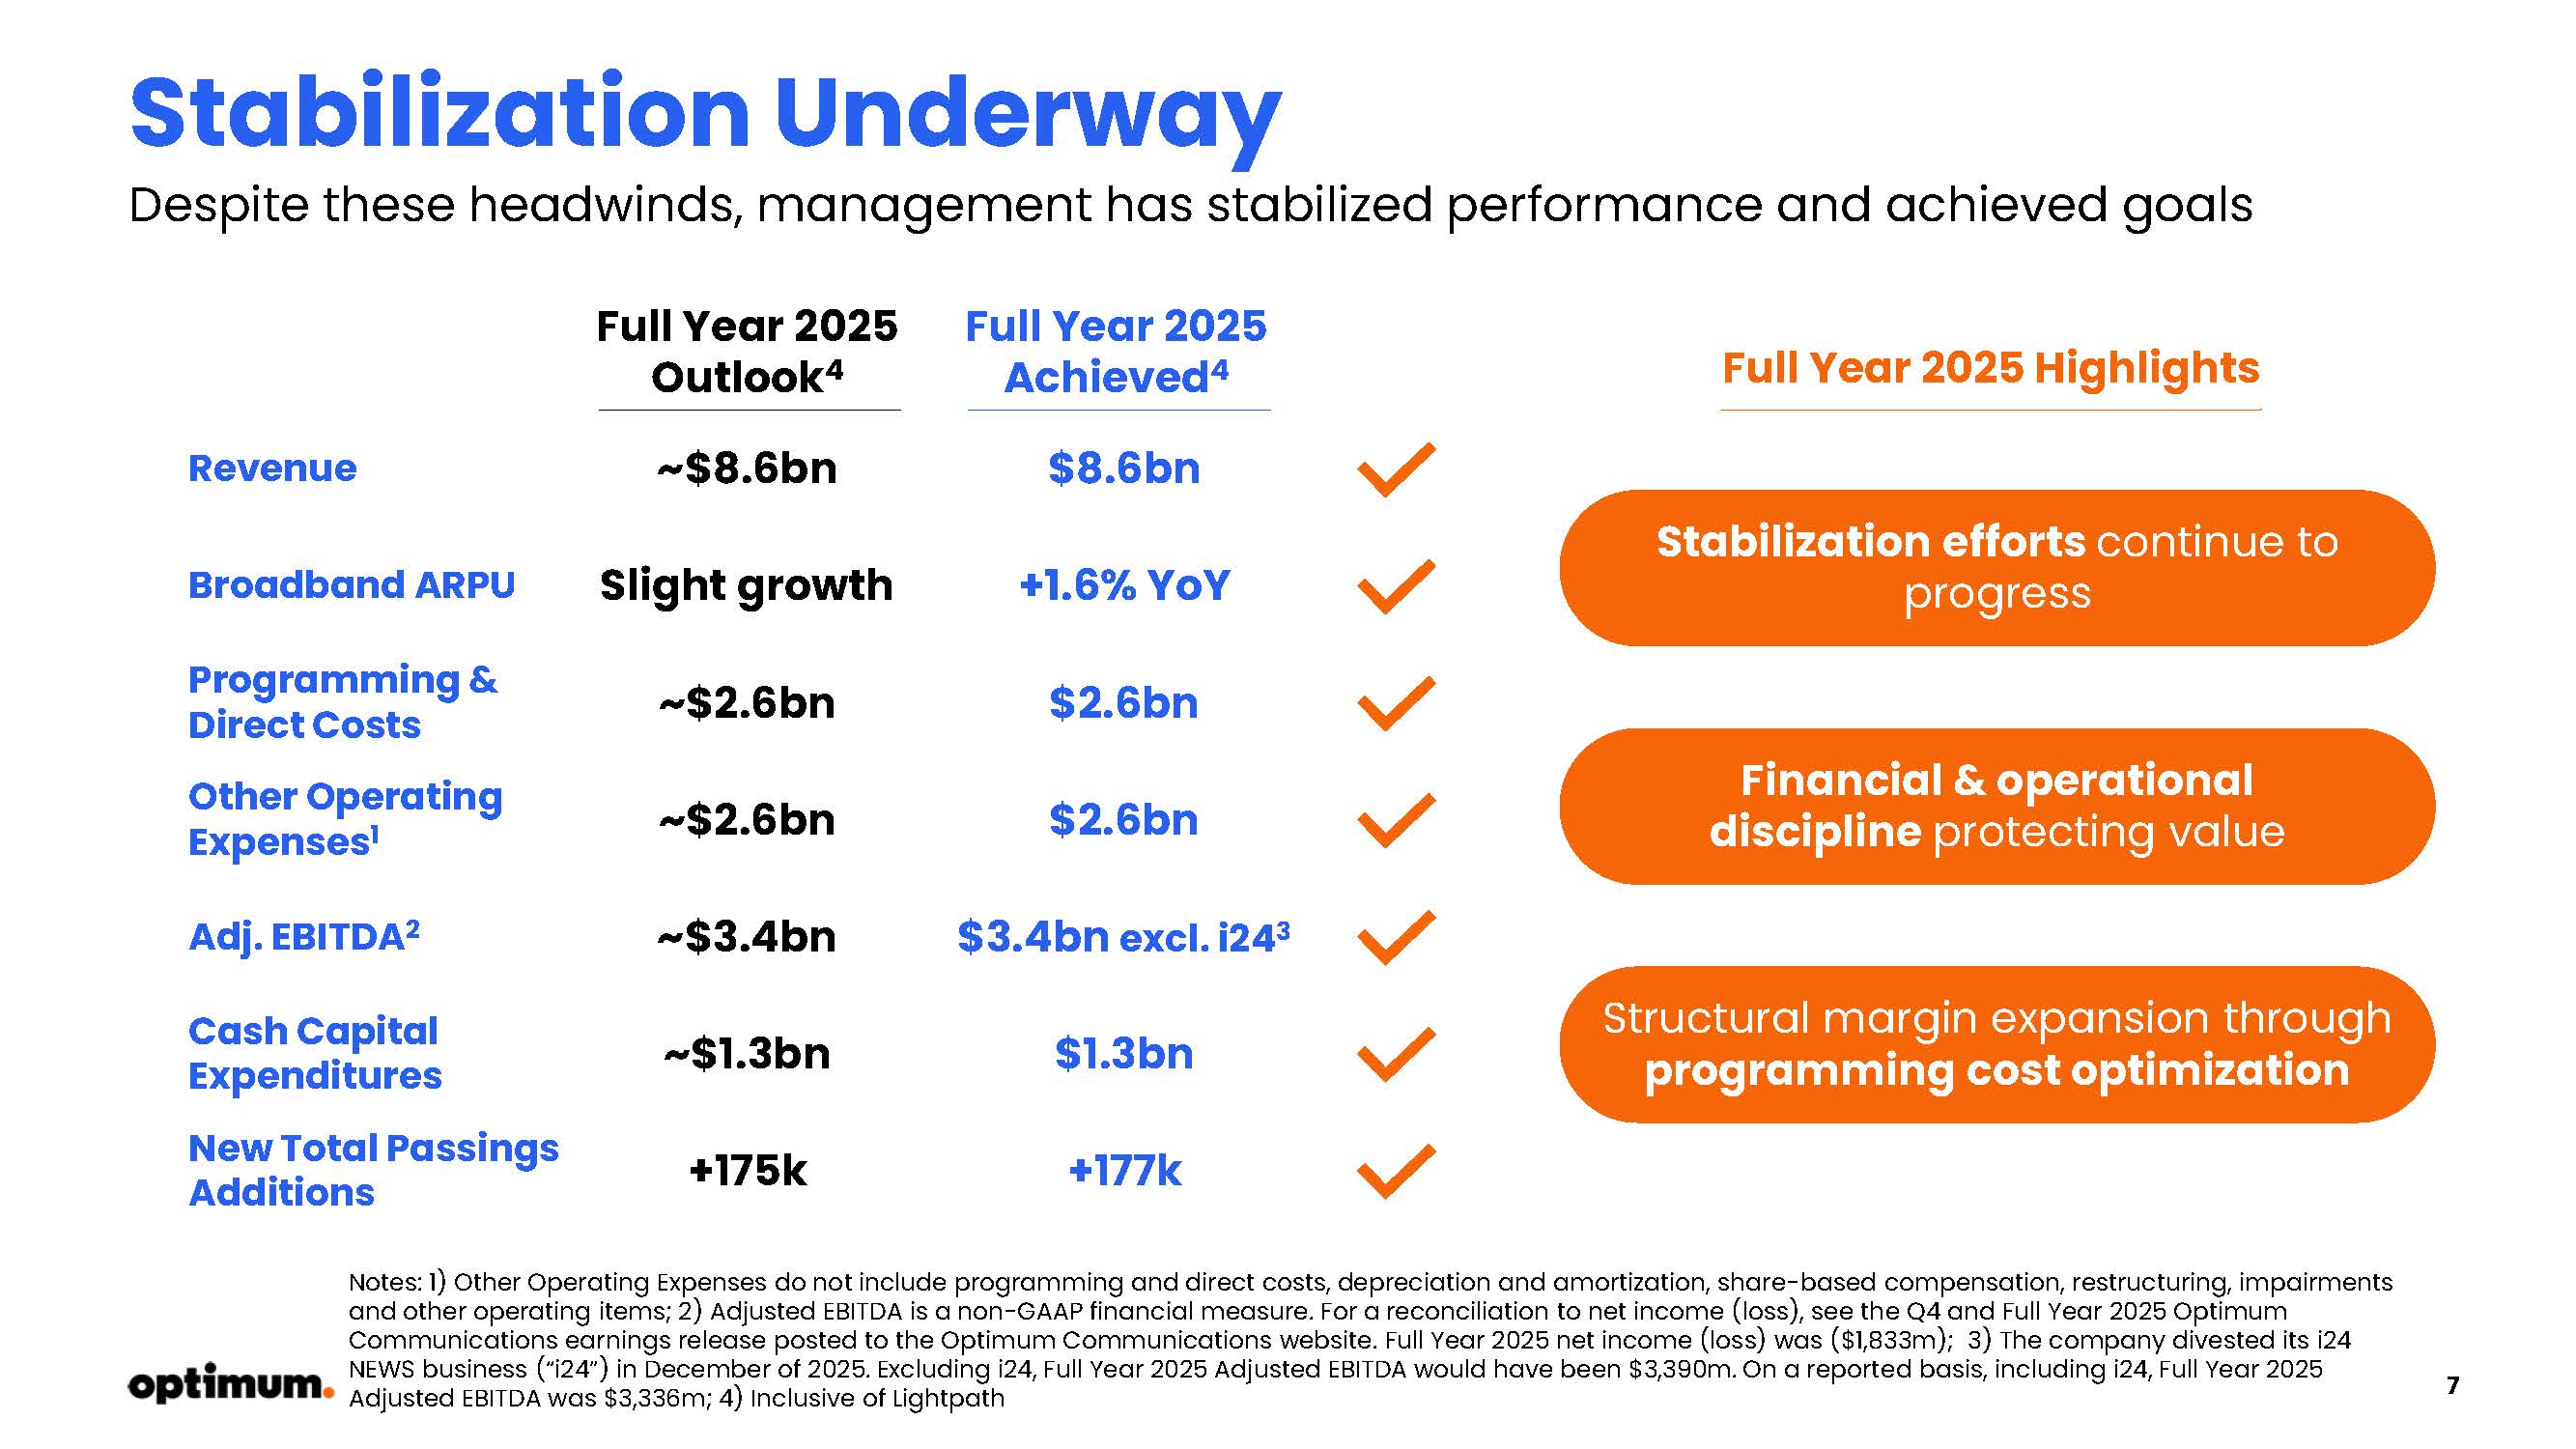
7 Stabilization Underway Despite these headwinds, management has stabilized performance and achieved goals Revenue Programming & Direct Costs Other Operating Expenses 1 Adj. EBITDA 2 ~$8.6bn $8.6bn ~$2.6bn $2.6bn ~$2.6bn $2.6bn ~$3.4bn $3.4bn excl. i24 3 Full Year 2025 Outlook 4 Full Year 2025 Achieved 4 Cash Capital Expenditures ~$1.3bn $1.3bn New Total Passings Additions +175k +177k Stabilization efforts continue to progress Broadband ARPU Slight growth +1.6% YoY Financial & operational discipline protecting value Structural margin expansion through programming cost optimization Full Year 2025 Highlights Notes: 1) Other Operating Expenses do not include programming and direct costs, depreciation and amortization, share - based compensation , restructuring, impairments and other operating items; 2) Adjusted EBITDA is a non - GAAP financial measure. For a reconciliation to net income (loss), see th e Q4 and Full Year 2025 Optimum Communications earnings release posted to the Optimum Communications website. Full Year 2025 net income (loss) was ($1,833m); 3 ) The company divested its i24 NEWS business (“i24”) in December of 2025. Excluding i24, Full Year 2025 Adjusted EBITDA would have been $3,390m. On a report ed basis, including i24, Full Year 2025 Adjusted EBITDA was $3,336m; 4) Inclusive of Lightpath
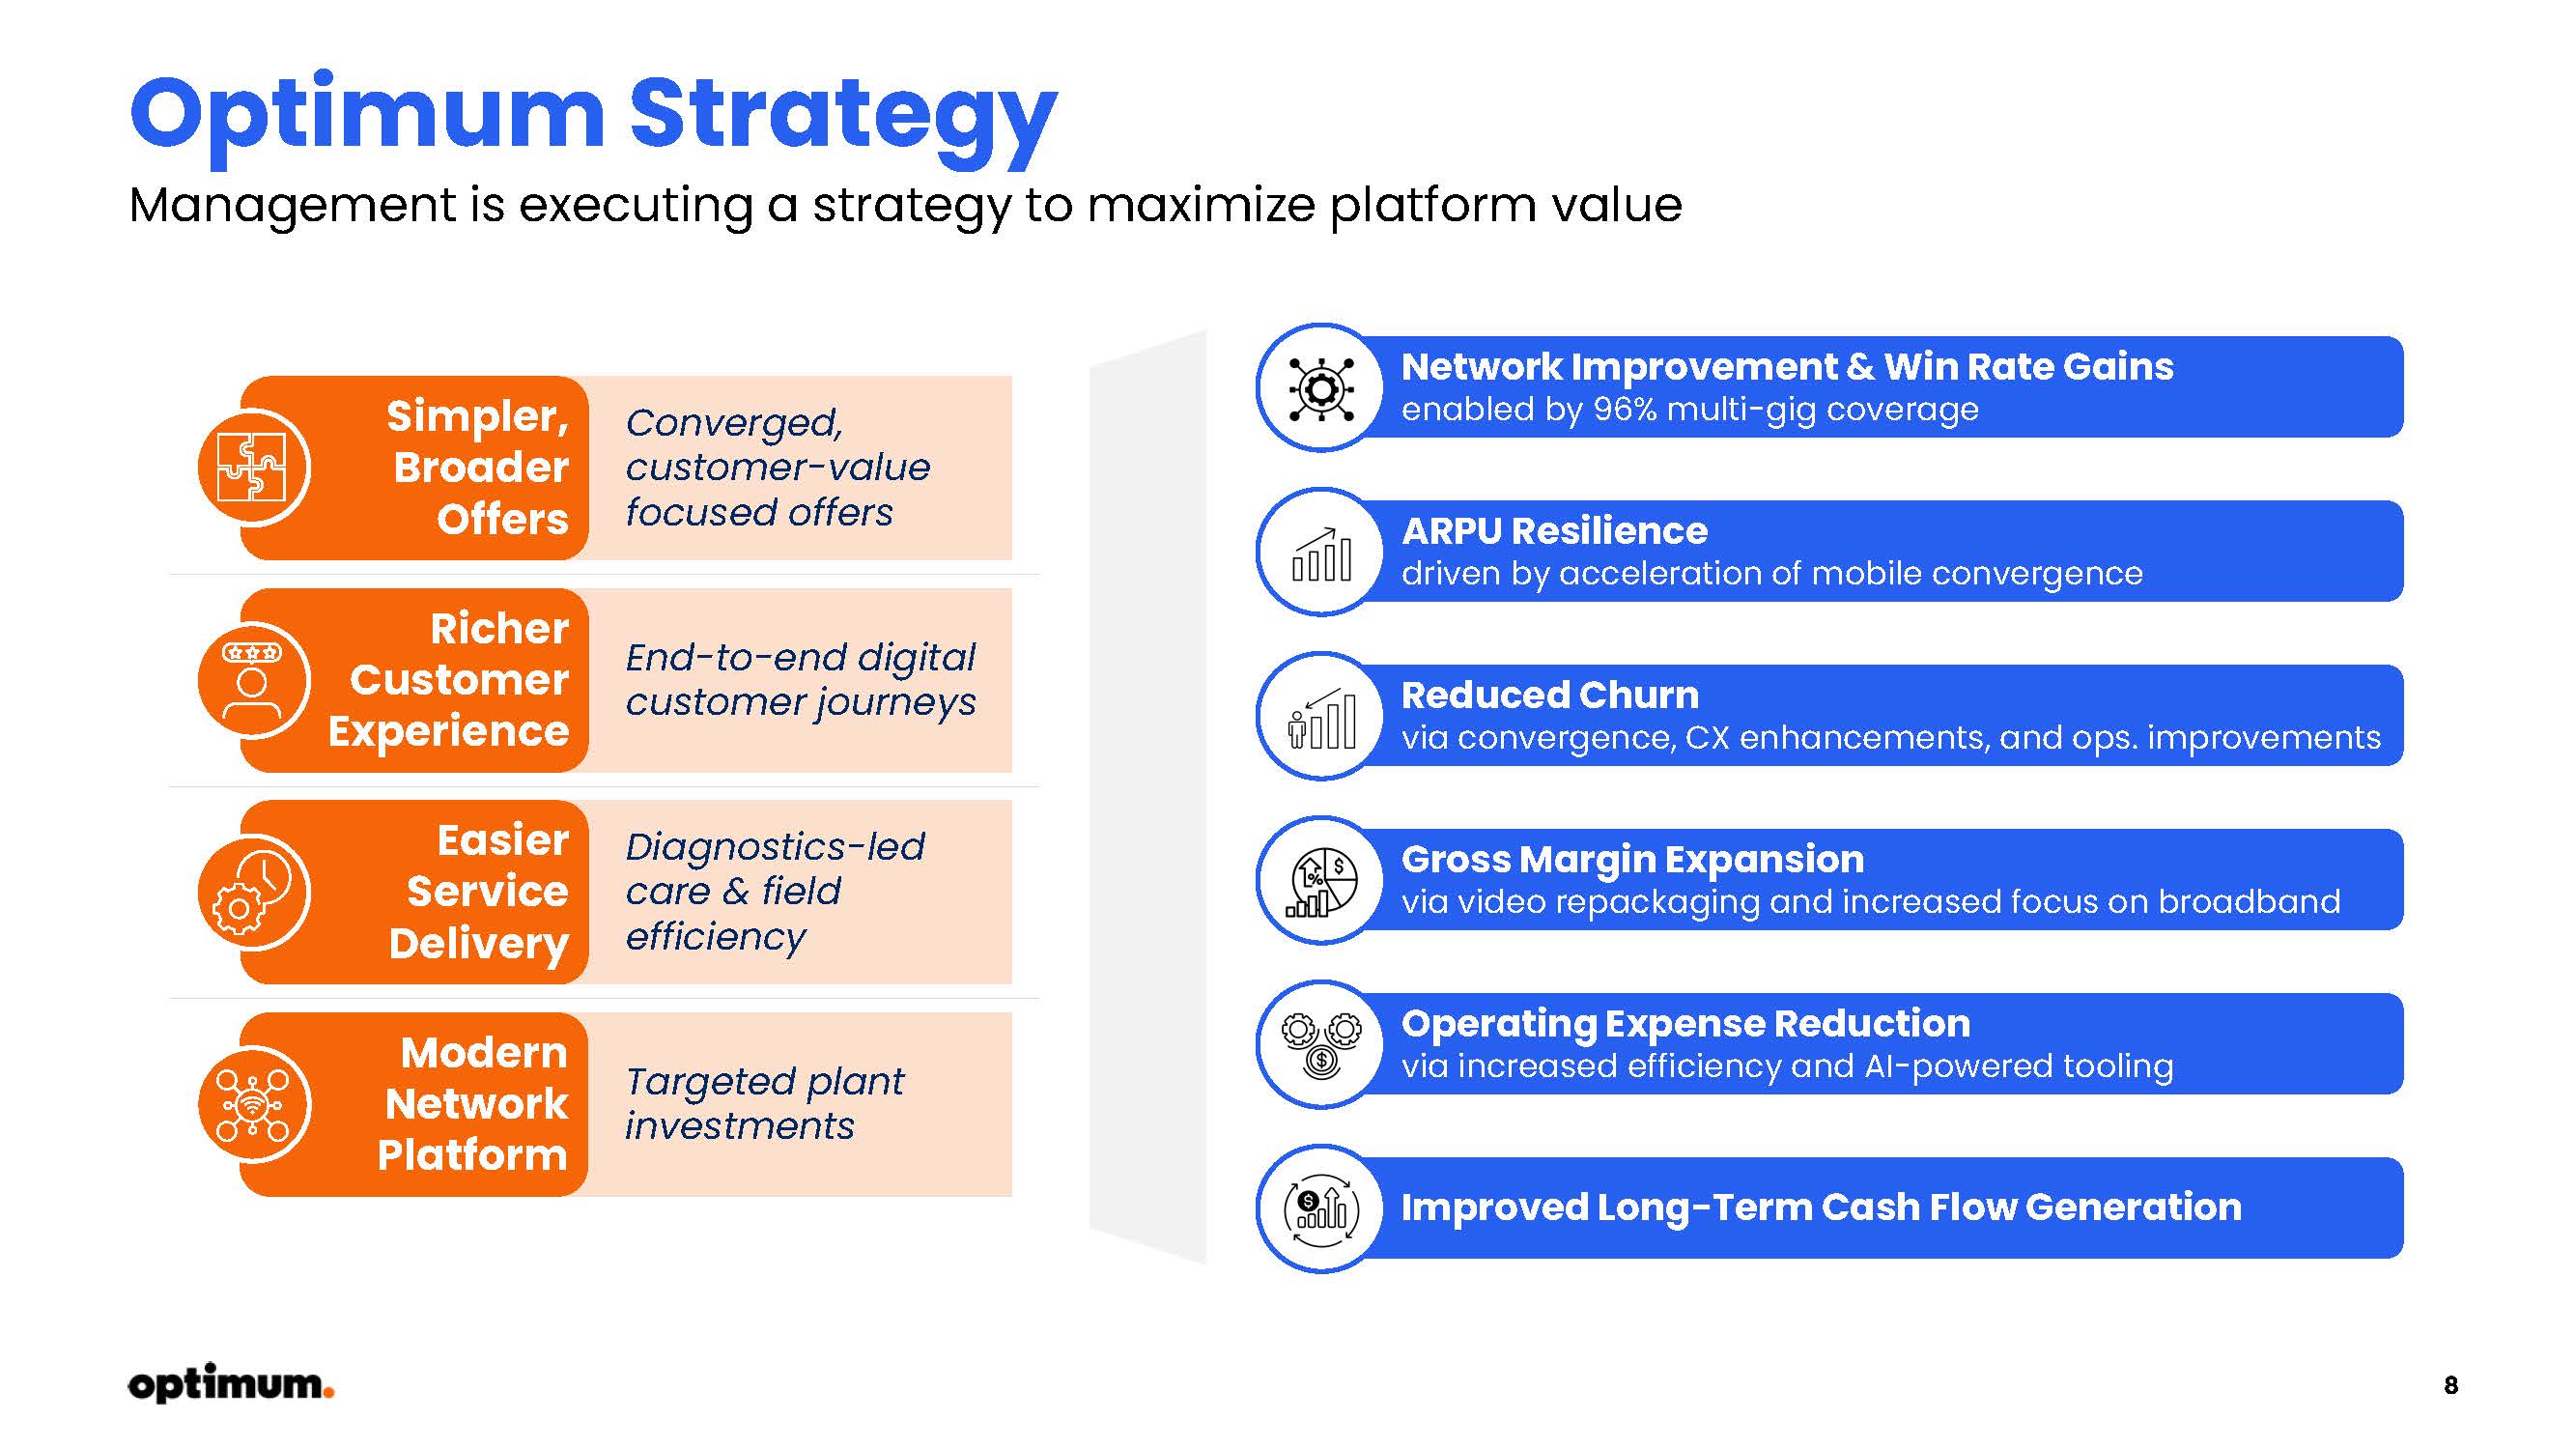
8 Optimum Strategy Management is executing a strategy to maximize platform value ARPU Resilience driven by acceleration of mobile convergence Reduced Churn via convergence, CX enhancements, and ops. improvements Gross Margin Expansion via video repackaging and increased focus on broadband Network Improvement & Win Rate Gains enabled by 96% multi - gig coverage Operating Expense Reduction via increased efficiency and AI - powered tooling Improved Long - Term Cash Flow Generation End - to - end digital customer journeys Richer Customer Experience Converged, customer - value focused offers Simpler, Broader Offers Diagnostics - led care & field efficiency Easier Service Delivery Targeted plant investments Modern Network Platform
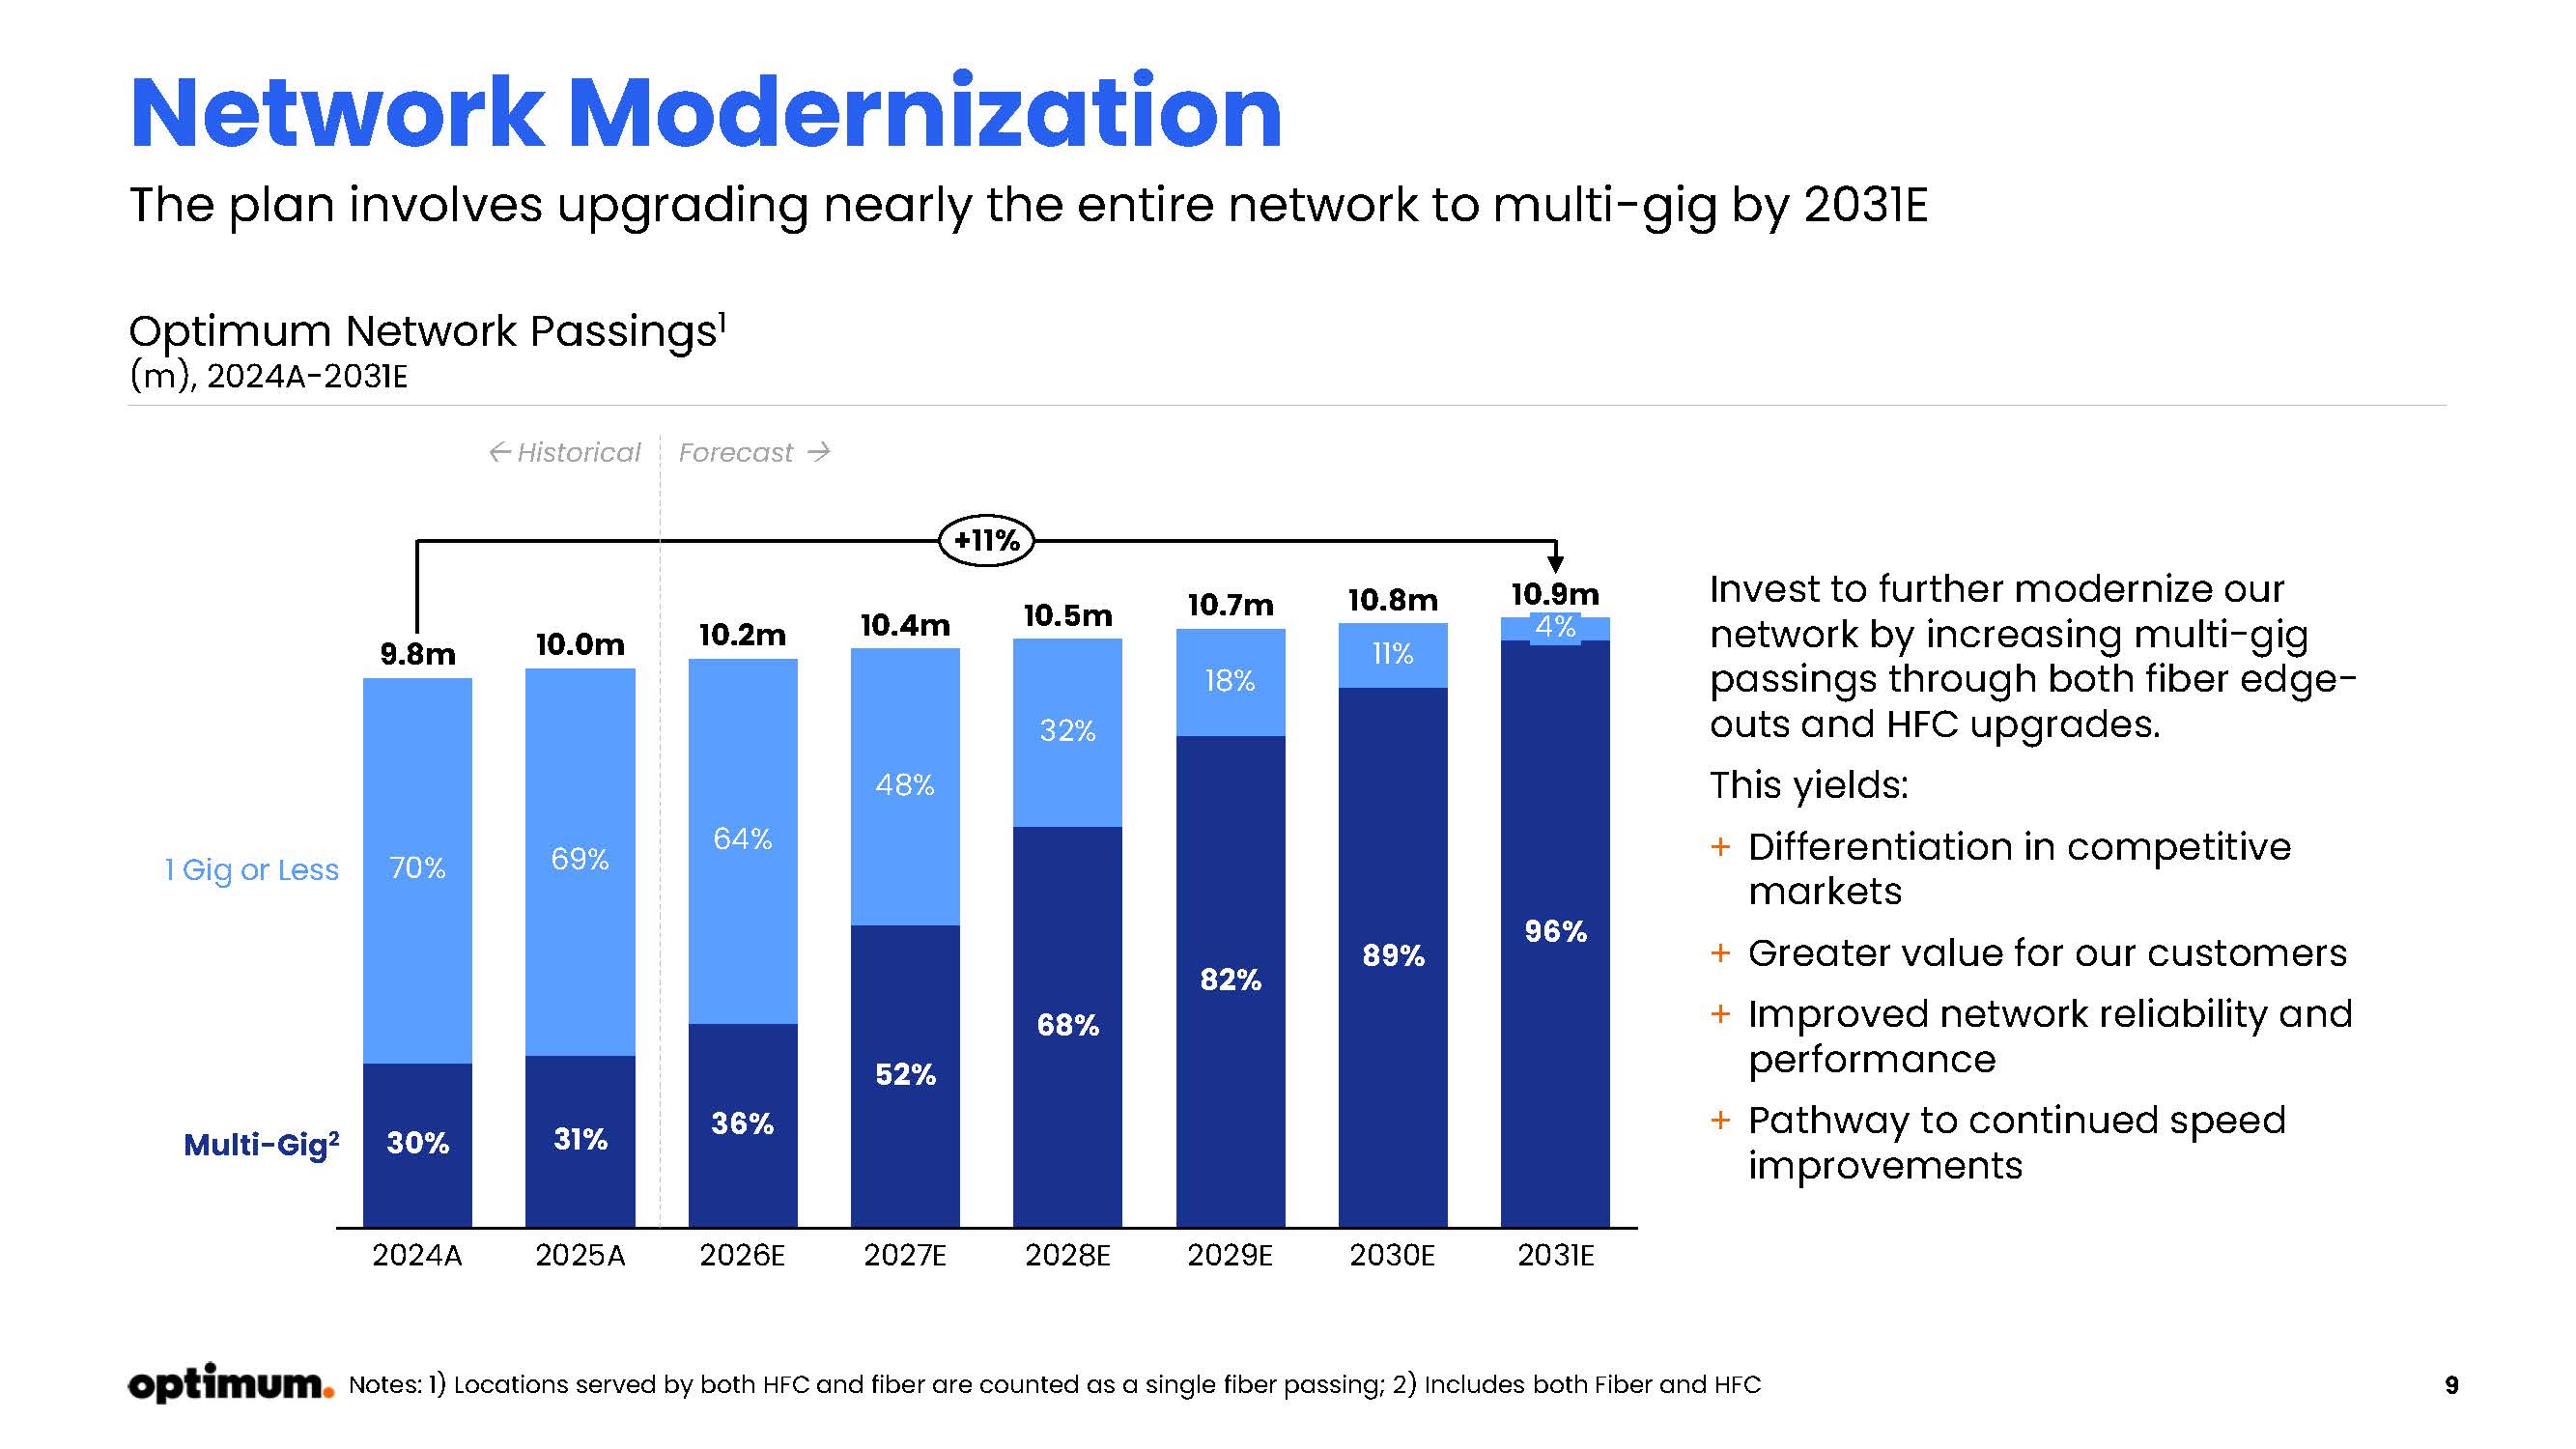
9 Network Modernization The plan involves upgrading nearly the entire network to multi - gig by 2031E 69% 2025A 36% 64% 2026E 52% 48% 2027E 68% 32% 2028E 82% 18% 2029E 89% 30% 2030E 96% 4% 2031E Multi - Gig 2 1 Gig or Less 70% 2024A 31% 9.8m 10.0m 10.2m 10.4m 10.5m 10.7m 10.8m 10.9m 11% +11% Optimum Network Passings 1 (m), 2024A - 2031E Historical Forecast Notes: 1) Locations served by both HFC and fiber are counted as a single fiber passing; 2) Includes both Fiber and HFC Invest to further modernize our network by increasing multi - gig passings through both fiber edge - outs and HFC upgrades. This yields: + Differentiation in competitive markets + Greater value for our customers + Improved network reliability and performance + Pathway to continued speed improvements
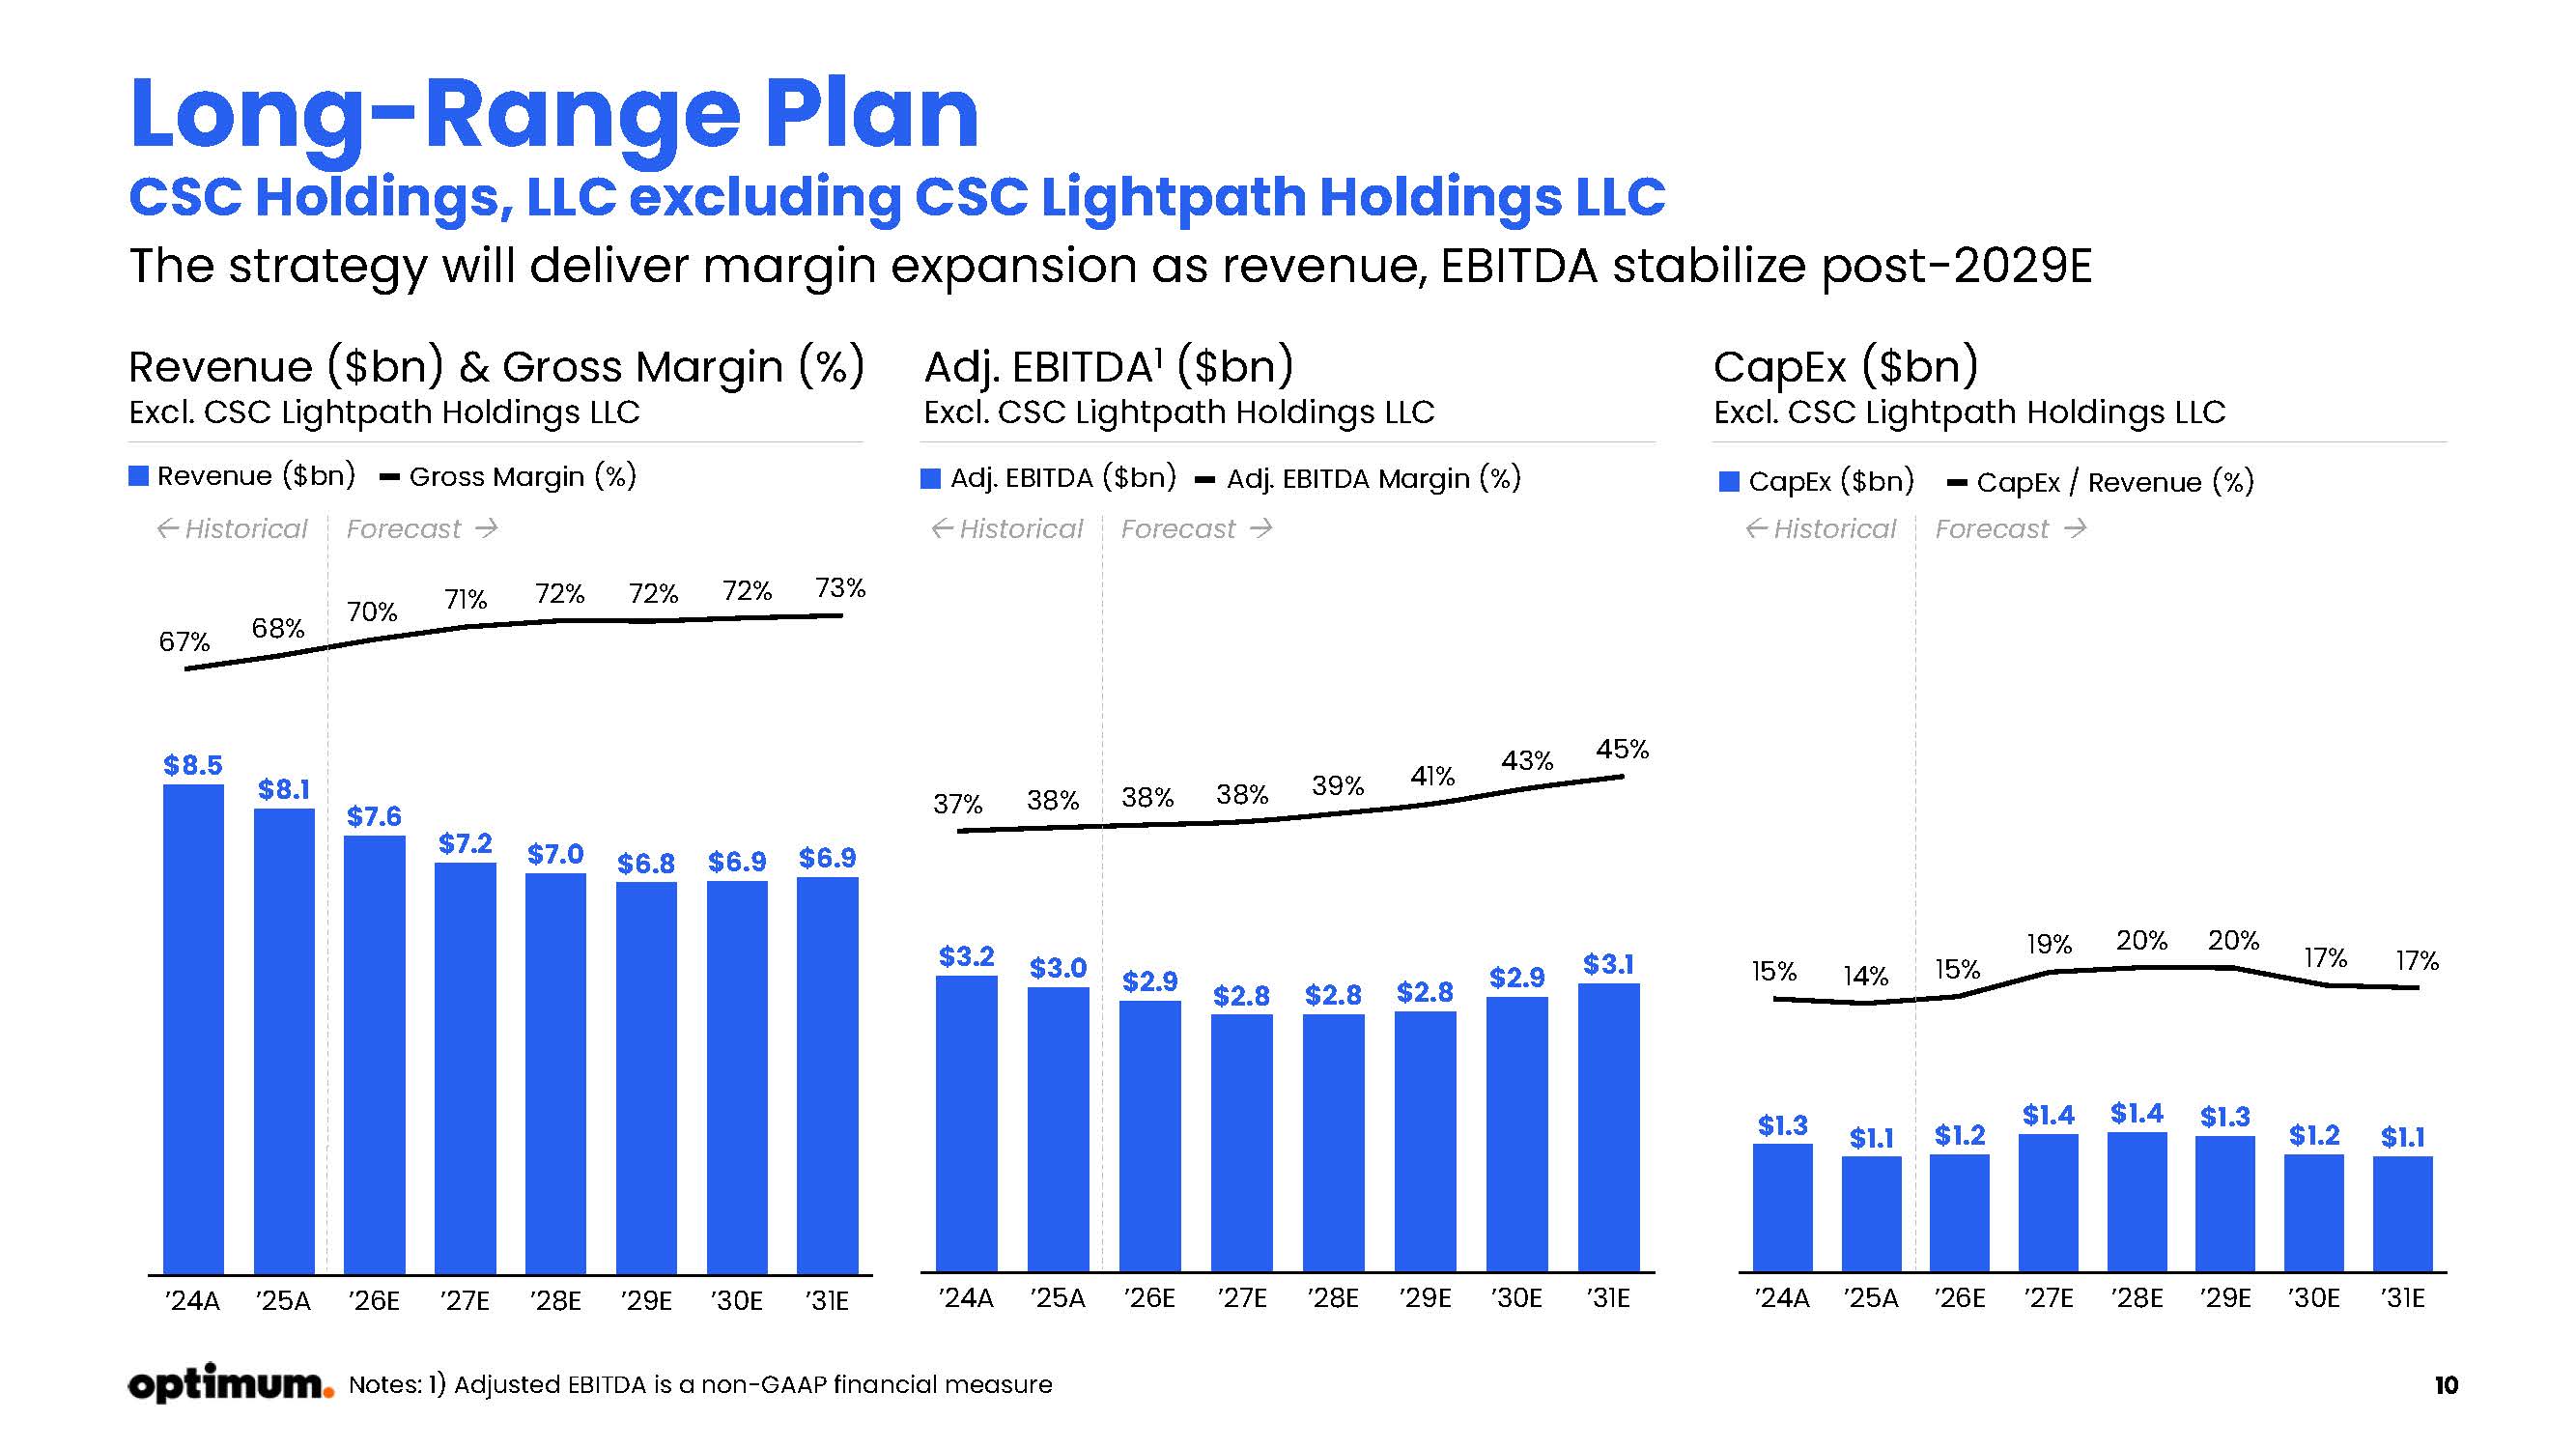
10 Long - Range Plan CSC Holdings, LLC excluding CSC Lightpath Holdings LLC The strategy will deliver margin expansion as revenue, EBITDA stabilize post - 2029E Revenue ($bn) Gross Margin (%) CapEx ($bn) CapEx / Revenue (%) Adj. EBITDA ($bn) Adj. EBITDA Margin (%) $8.5 $8.1 $7.6 $7.2 $7.0 $6.8 $6.9 $6.9 ’24 A ’25 A ’26 E ’27 E ’28 E ’29 E ’30 E ’31 E 67% 68% 70% 71% 72% 72% 72% 73% $3.2 $3.0 $2.9 $2.8 $2.8 $2.8 $2.9 $3.1 ’24 A ’25 A ’26 E ’27 E ’28 E ’29 E ’30 E ’31 E $1.3 $1.1 $1.2 $1.4 $1.4 $1.3 $1.2 $1.1 ’24 A ’25 A ’26 E ’27 E ’28 E ’29 E ’30 E ’31 E 37% 38% 38% 38% 39% 41% 43% 45% 15% 14% 15% 19% 20% 20% 17% 17% Historical Forecast Historical Forecast Revenue ($bn) & Gross Margin (%) Excl. CSC Lightpath Holdings LLC Adj. EBITDA 1 ($bn) Excl. CSC Lightpath Holdings LLC CapEx ($bn) Excl. CSC Lightpath Holdings LLC Notes: 1) Adjusted EBITDA is a non - GAAP financial measure Historical Forecast
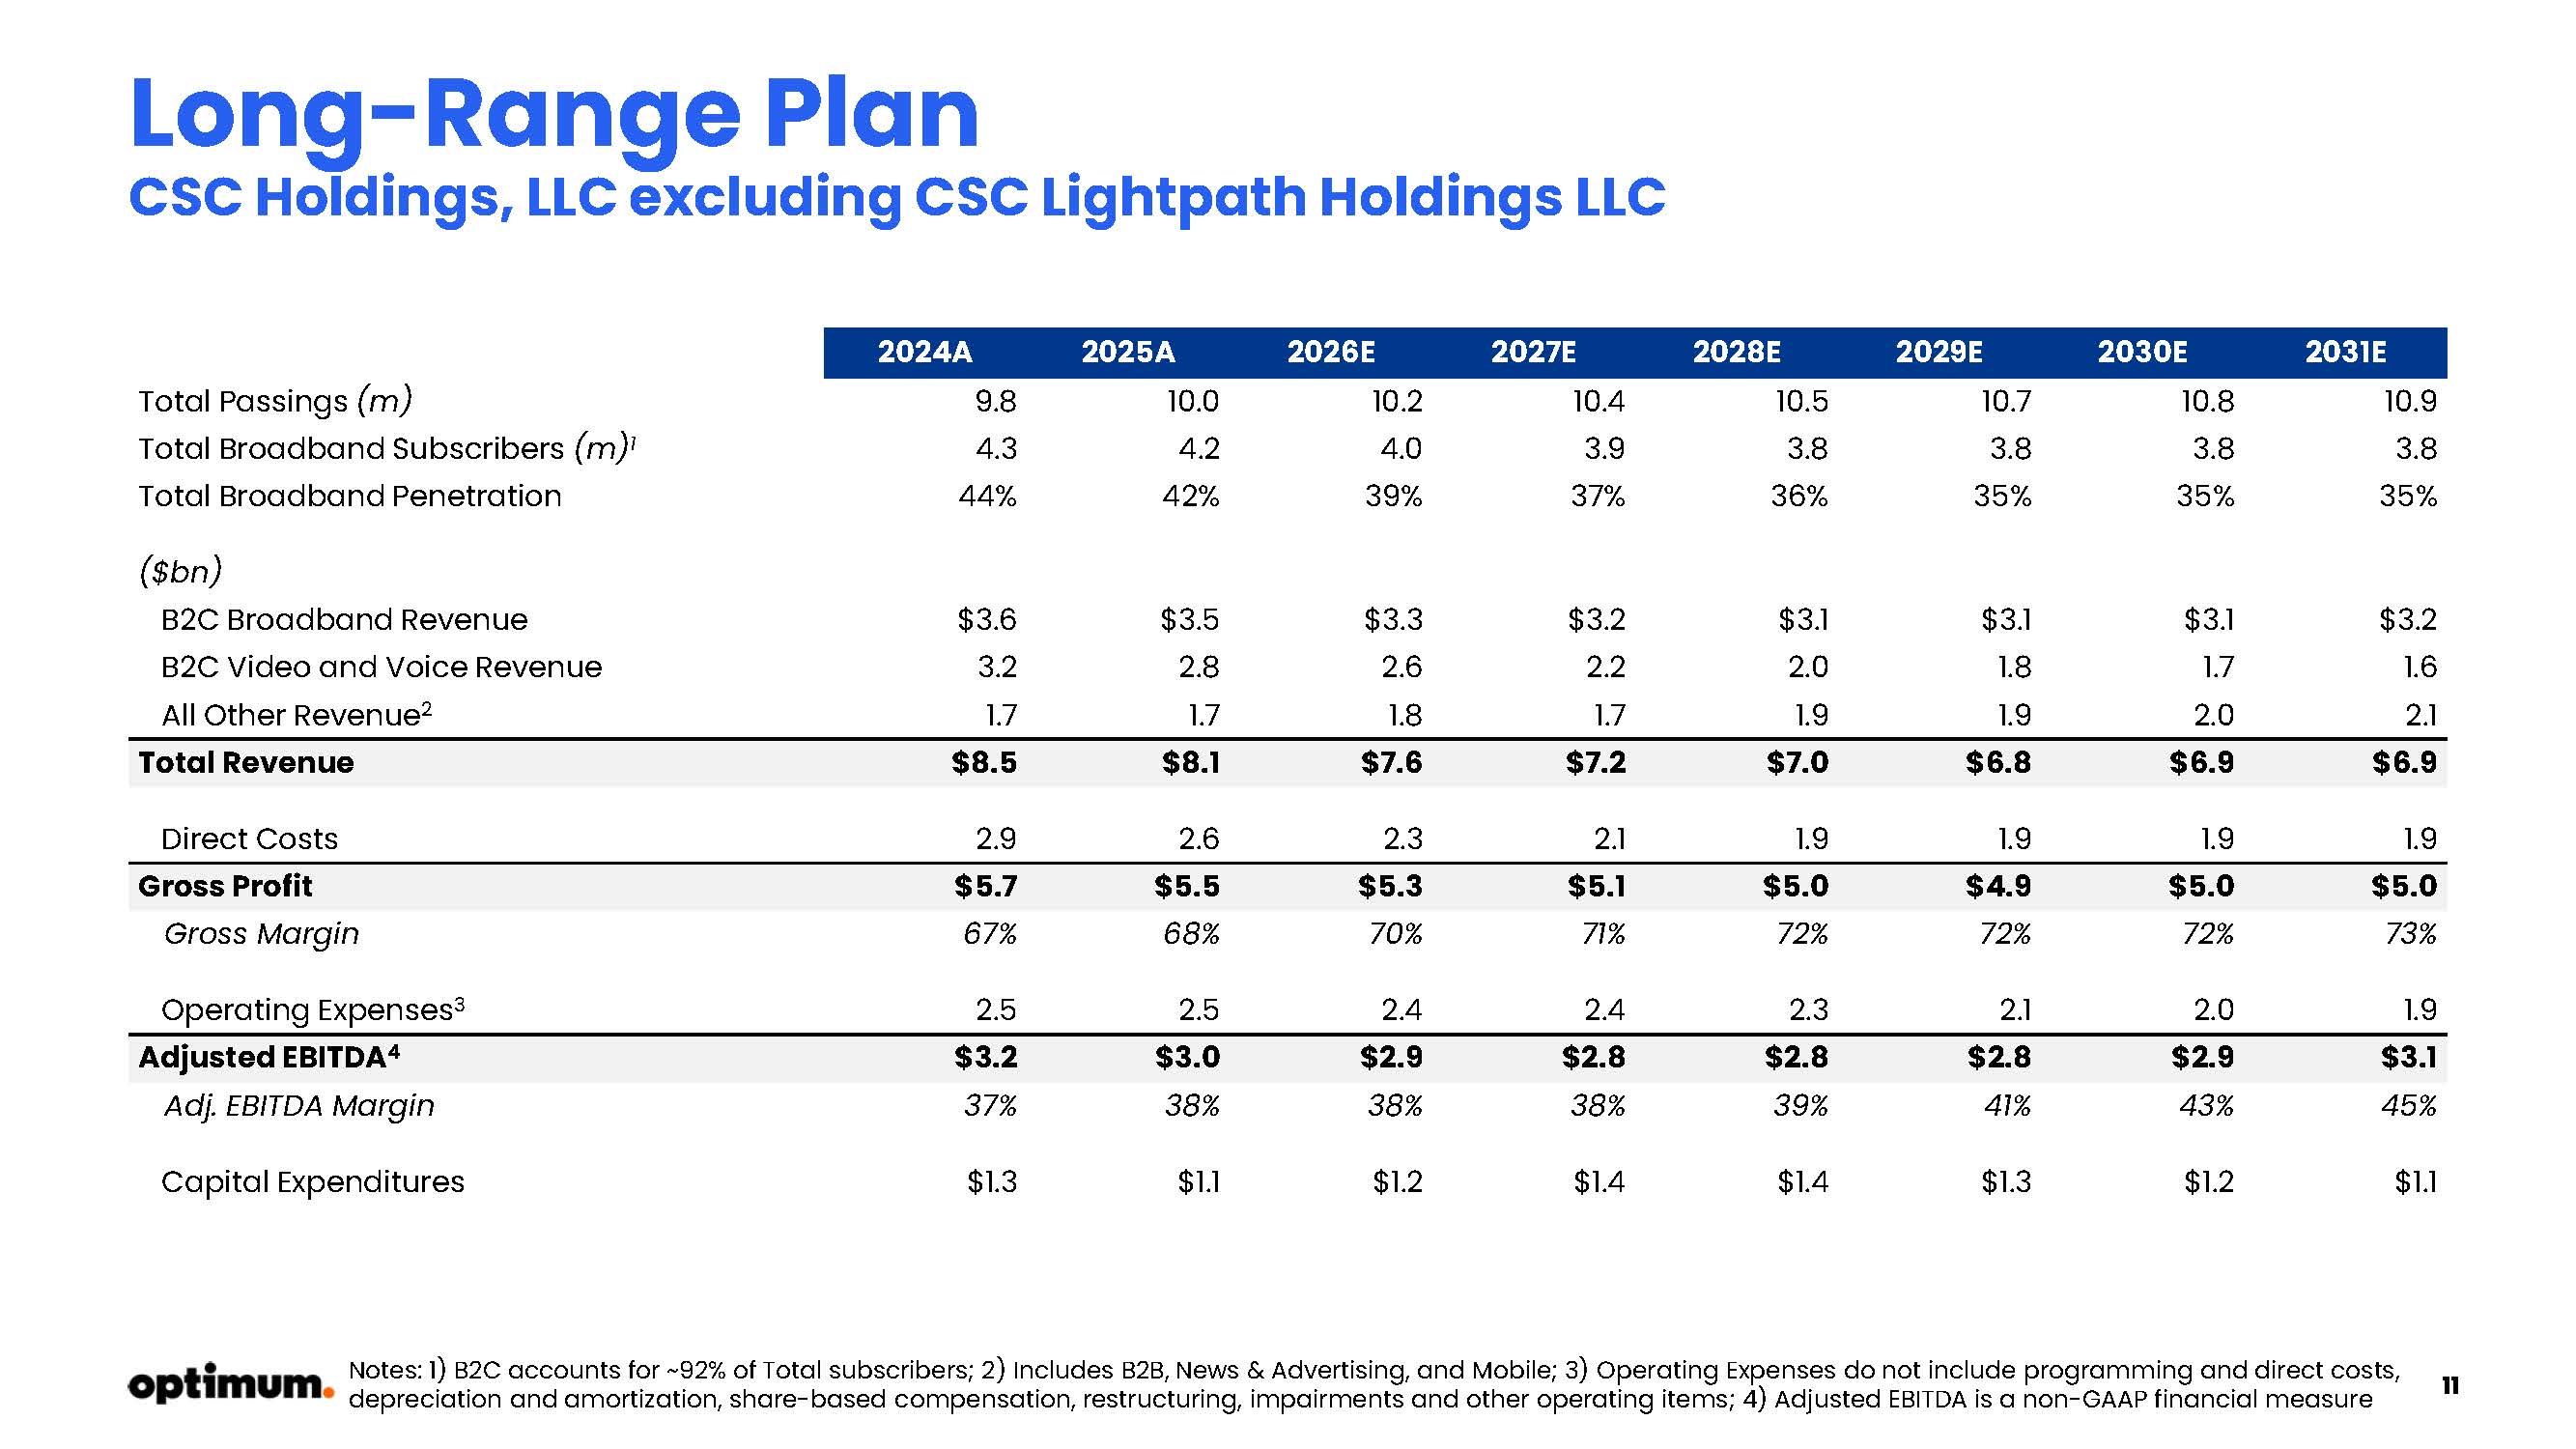
11 Long - Range Plan CSC Holdings, LLC excluding CSC Lightpath Holdings LLC 2031E 2030E 2029E 2028E 2027E 2026E 2025A 2024A 10.9 10.8 10.7 10.5 10.4 10.2 10.0 9.8 Total Passings (m) 3.8 3.8 3.8 3.8 3.9 4.0 4.2 4.3 Total Broadband Subscribers (m) 1 35% 35% 35% 36% 37% 39% 42% 44% Total Broadband Penetration ($bn) $3.2 $3.1 $3.1 $3.1 $3.2 $3.3 $3.5 $3.6 B2C Broadband Revenue 1.6 1.7 1.8 2.0 2.2 2.6 2.8 3.2 B2C Video and Voice Revenue 2.1 2.0 1.9 1.9 1.7 1.8 1.7 1.7 All Other Revenue 2 $6.9 $6.9 $6.8 $7.0 $7.2 $7.6 $8.1 $8.5 Total Revenue 1.9 1.9 1.9 1.9 2.1 2.3 2.6 2.9 Direct Costs $5.0 $5.0 $4.9 $5.0 $5.1 $5.3 $5.5 $5.7 Gross Profit 73% 72% 72% 72% 71% 70% 68% 67% Gross Margin 1.9 2.0 2.1 2.3 2.4 2.4 2.5 2.5 Operating Expenses 3 $3.1 $2.9 $2.8 $2.8 $2.8 $2.9 $3.0 $3.2 Adjusted EBITDA 4 45% 43% 41% 39% 38% 38% 38% 37% Adj. EBITDA Margin $1.1 $1.2 $1.3 $1.4 $1.4 $1.2 $1.1 $1.3 Capital Expenditures Notes: 1) B2C accounts for ~92% of Total subscribers; 2) Includes B2B, News & Advertising, and Mobile; 3) Operating Expenses do not include programming and direct costs, depreciation and amortization, share - based compensation, restructuring, impairments and other operating items ; 4) Adjusted EBITDA is a non - GAAP financial measure
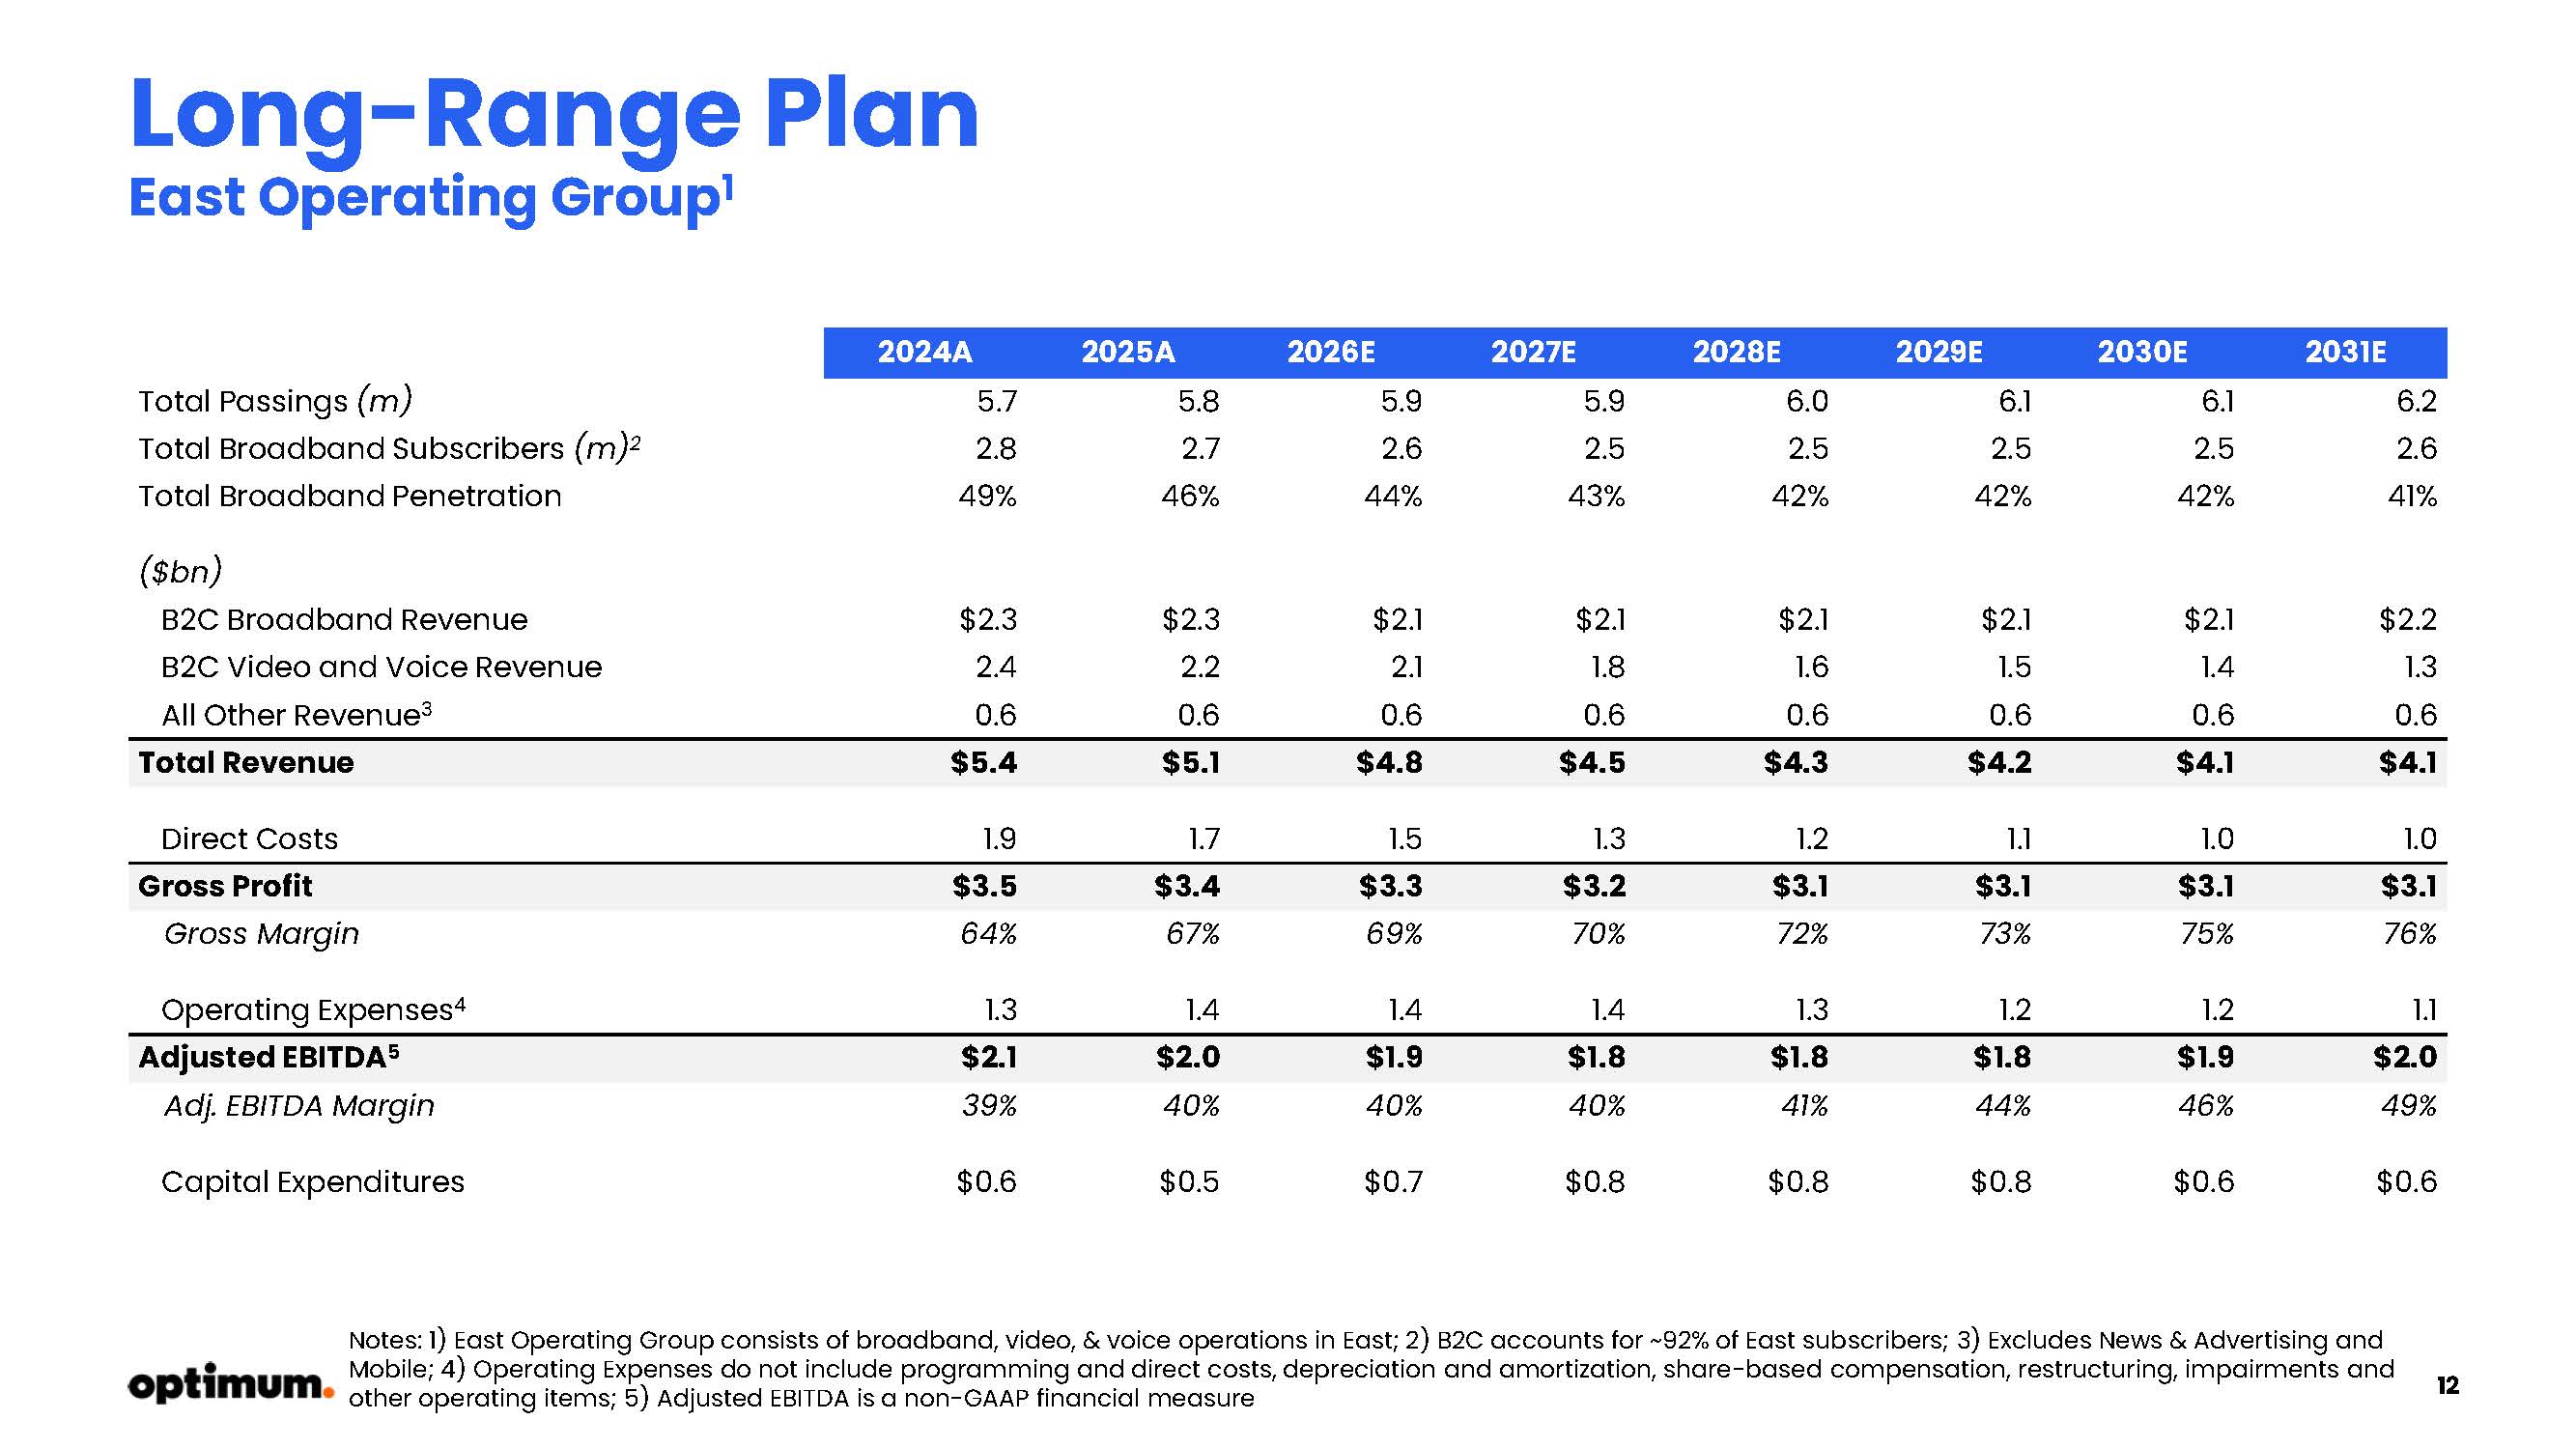
12 Long - Range Plan East Operating Group 1 2031E 2030E 2029E 2028E 2027E 2026E 2025A 2024A 6.2 6.1 6.1 6.0 5.9 5.9 5.8 5.7 Total Passings (m) 2.6 2.5 2.5 2.5 2.5 2.6 2.7 2.8 Total Broadband Subscribers (m) 2 41% 42% 42% 42% 43% 44% 46% 49% Total Broadband Penetration ($bn) $2.2 $2.1 $2.1 $2.1 $2.1 $2.1 $2.3 $2.3 B2C Broadband Revenue 1.3 1.4 1.5 1.6 1.8 2.1 2.2 2.4 B2C Video and Voice Revenue 0.6 0.6 0.6 0.6 0.6 0.6 0.6 0.6 All Other Revenue 3 $4.1 $4.1 $4.2 $4.3 $4.5 $4.8 $5.1 $5.4 Total Revenue 1.0 1.0 1.1 1.2 1.3 1.5 1.7 1.9 Direct Costs $3.1 $3.1 $3.1 $3.1 $3.2 $3.3 $3.4 $3.5 Gross Profit 76% 75% 73% 72% 70% 69% 67% 64% Gross Margin 1.1 1.2 1.2 1.3 1.4 1.4 1.4 1.3 Operating Expenses 4 $2.0 $1.9 $1.8 $1.8 $1.8 $1.9 $2.0 $2.1 Adjusted EBITDA 5 49% 46% 44% 41% 40% 40% 40% 39% Adj. EBITDA Margin $0.6 $0.6 $0.8 $0.8 $0.8 $0.7 $0.5 $0.6 Capital Expenditures Notes: 1) East Operating Group consists of broadband, video, & voice operations in East; 2) B2C accounts for ~92% of East sub scr ibers; 3) Excludes News & Advertising and Mobile; 4) Operating Expenses do not include programming and direct costs, depreciation and amortization, share - based compensation, restruc turing, impairments and other operating items; 5) Adjusted EBITDA is a non - GAAP financial measure
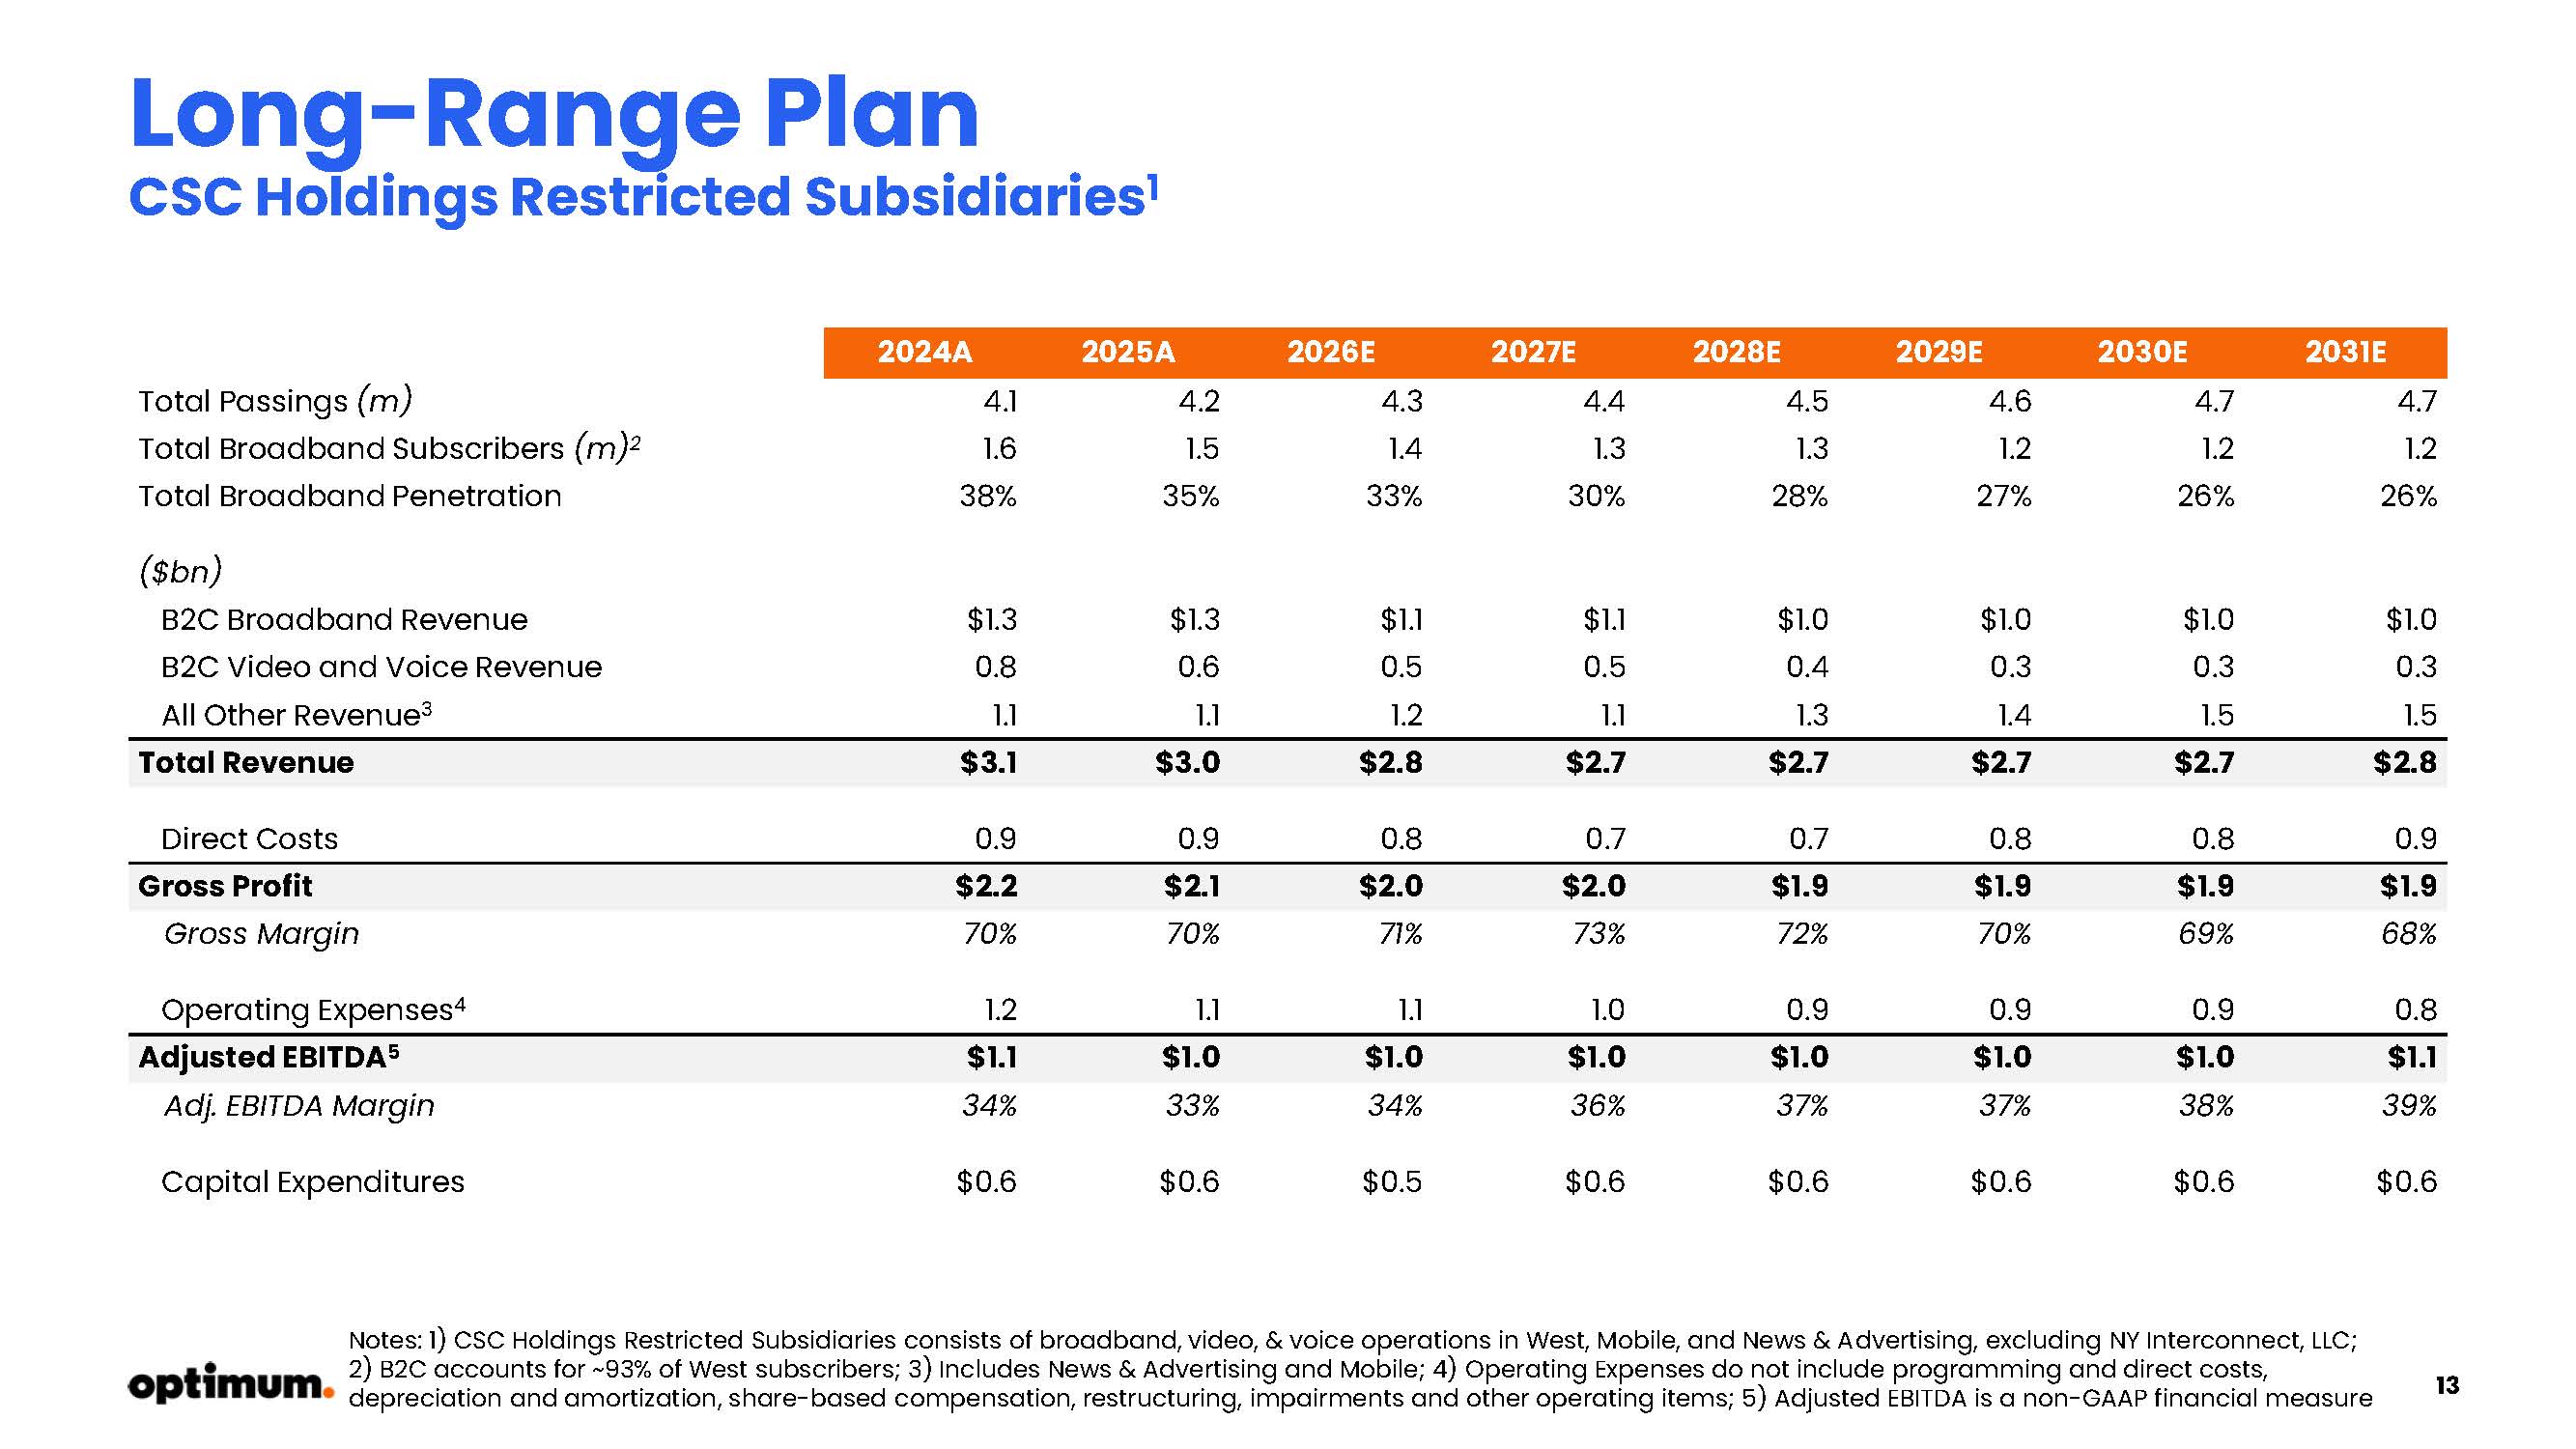
13 Long - Range Plan CSC Holdings Restricted Subsidiaries 1 2031E 2030E 2029E 2028E 2027E 2026E 2025A 2024A 4.7 4.7 4.6 4.5 4.4 4.3 4.2 4.1 Total Passings (m) 1.2 1.2 1.2 1.3 1.3 1.4 1.5 1.6 Total Broadband Subscribers (m) 2 26% 26% 27% 28% 30% 33% 35% 38% Total Broadband Penetration ($bn) $1.0 $1.0 $1.0 $1.0 $1.1 $1.1 $1.3 $1.3 B2C Broadband Revenue 0.3 0.3 0.3 0.4 0.5 0.5 0.6 0.8 B2C Video and Voice Revenue 1.5 1.5 1.4 1.3 1.1 1.2 1.1 1.1 All Other Revenue 3 $2.8 $2.7 $2.7 $2.7 $2.7 $2.8 $3.0 $3.1 Total Revenue 0.9 0.8 0.8 0.7 0.7 0.8 0.9 0.9 Direct Costs $1.9 $1.9 $1.9 $1.9 $2.0 $2.0 $2.1 $2.2 Gross Profit 68% 69% 70% 72% 73% 71% 70% 70% Gross Margin 0.8 0.9 0.9 0.9 1.0 1.1 1.1 1.2 Operating Expenses 4 $1.1 $1.0 $1.0 $1.0 $1.0 $1.0 $1.0 $1.1 Adjusted EBITDA 5 39% 38% 37% 37% 36% 34% 33% 34% Adj. EBITDA Margin $0.6 $0.6 $0.6 $0.6 $0.6 $0.5 $0.6 $0.6 Capital Expenditures Notes: 1) CSC Holdings Restricted Subsidiaries consists of broadband, video, & voice operations in West, Mobile, and News & A dve rtising, excluding NY Interconnect, LLC; 2) B2C accounts for ~93% of West subscribers; 3) Includes News & Advertising and Mobile; 4) Operating Expenses do not include programming and direct costs, depreciation and amortization, share - based compensation, restructuring, impairments and other operating items; 5) Adjusted EBITD A is a non - GAAP financial measure
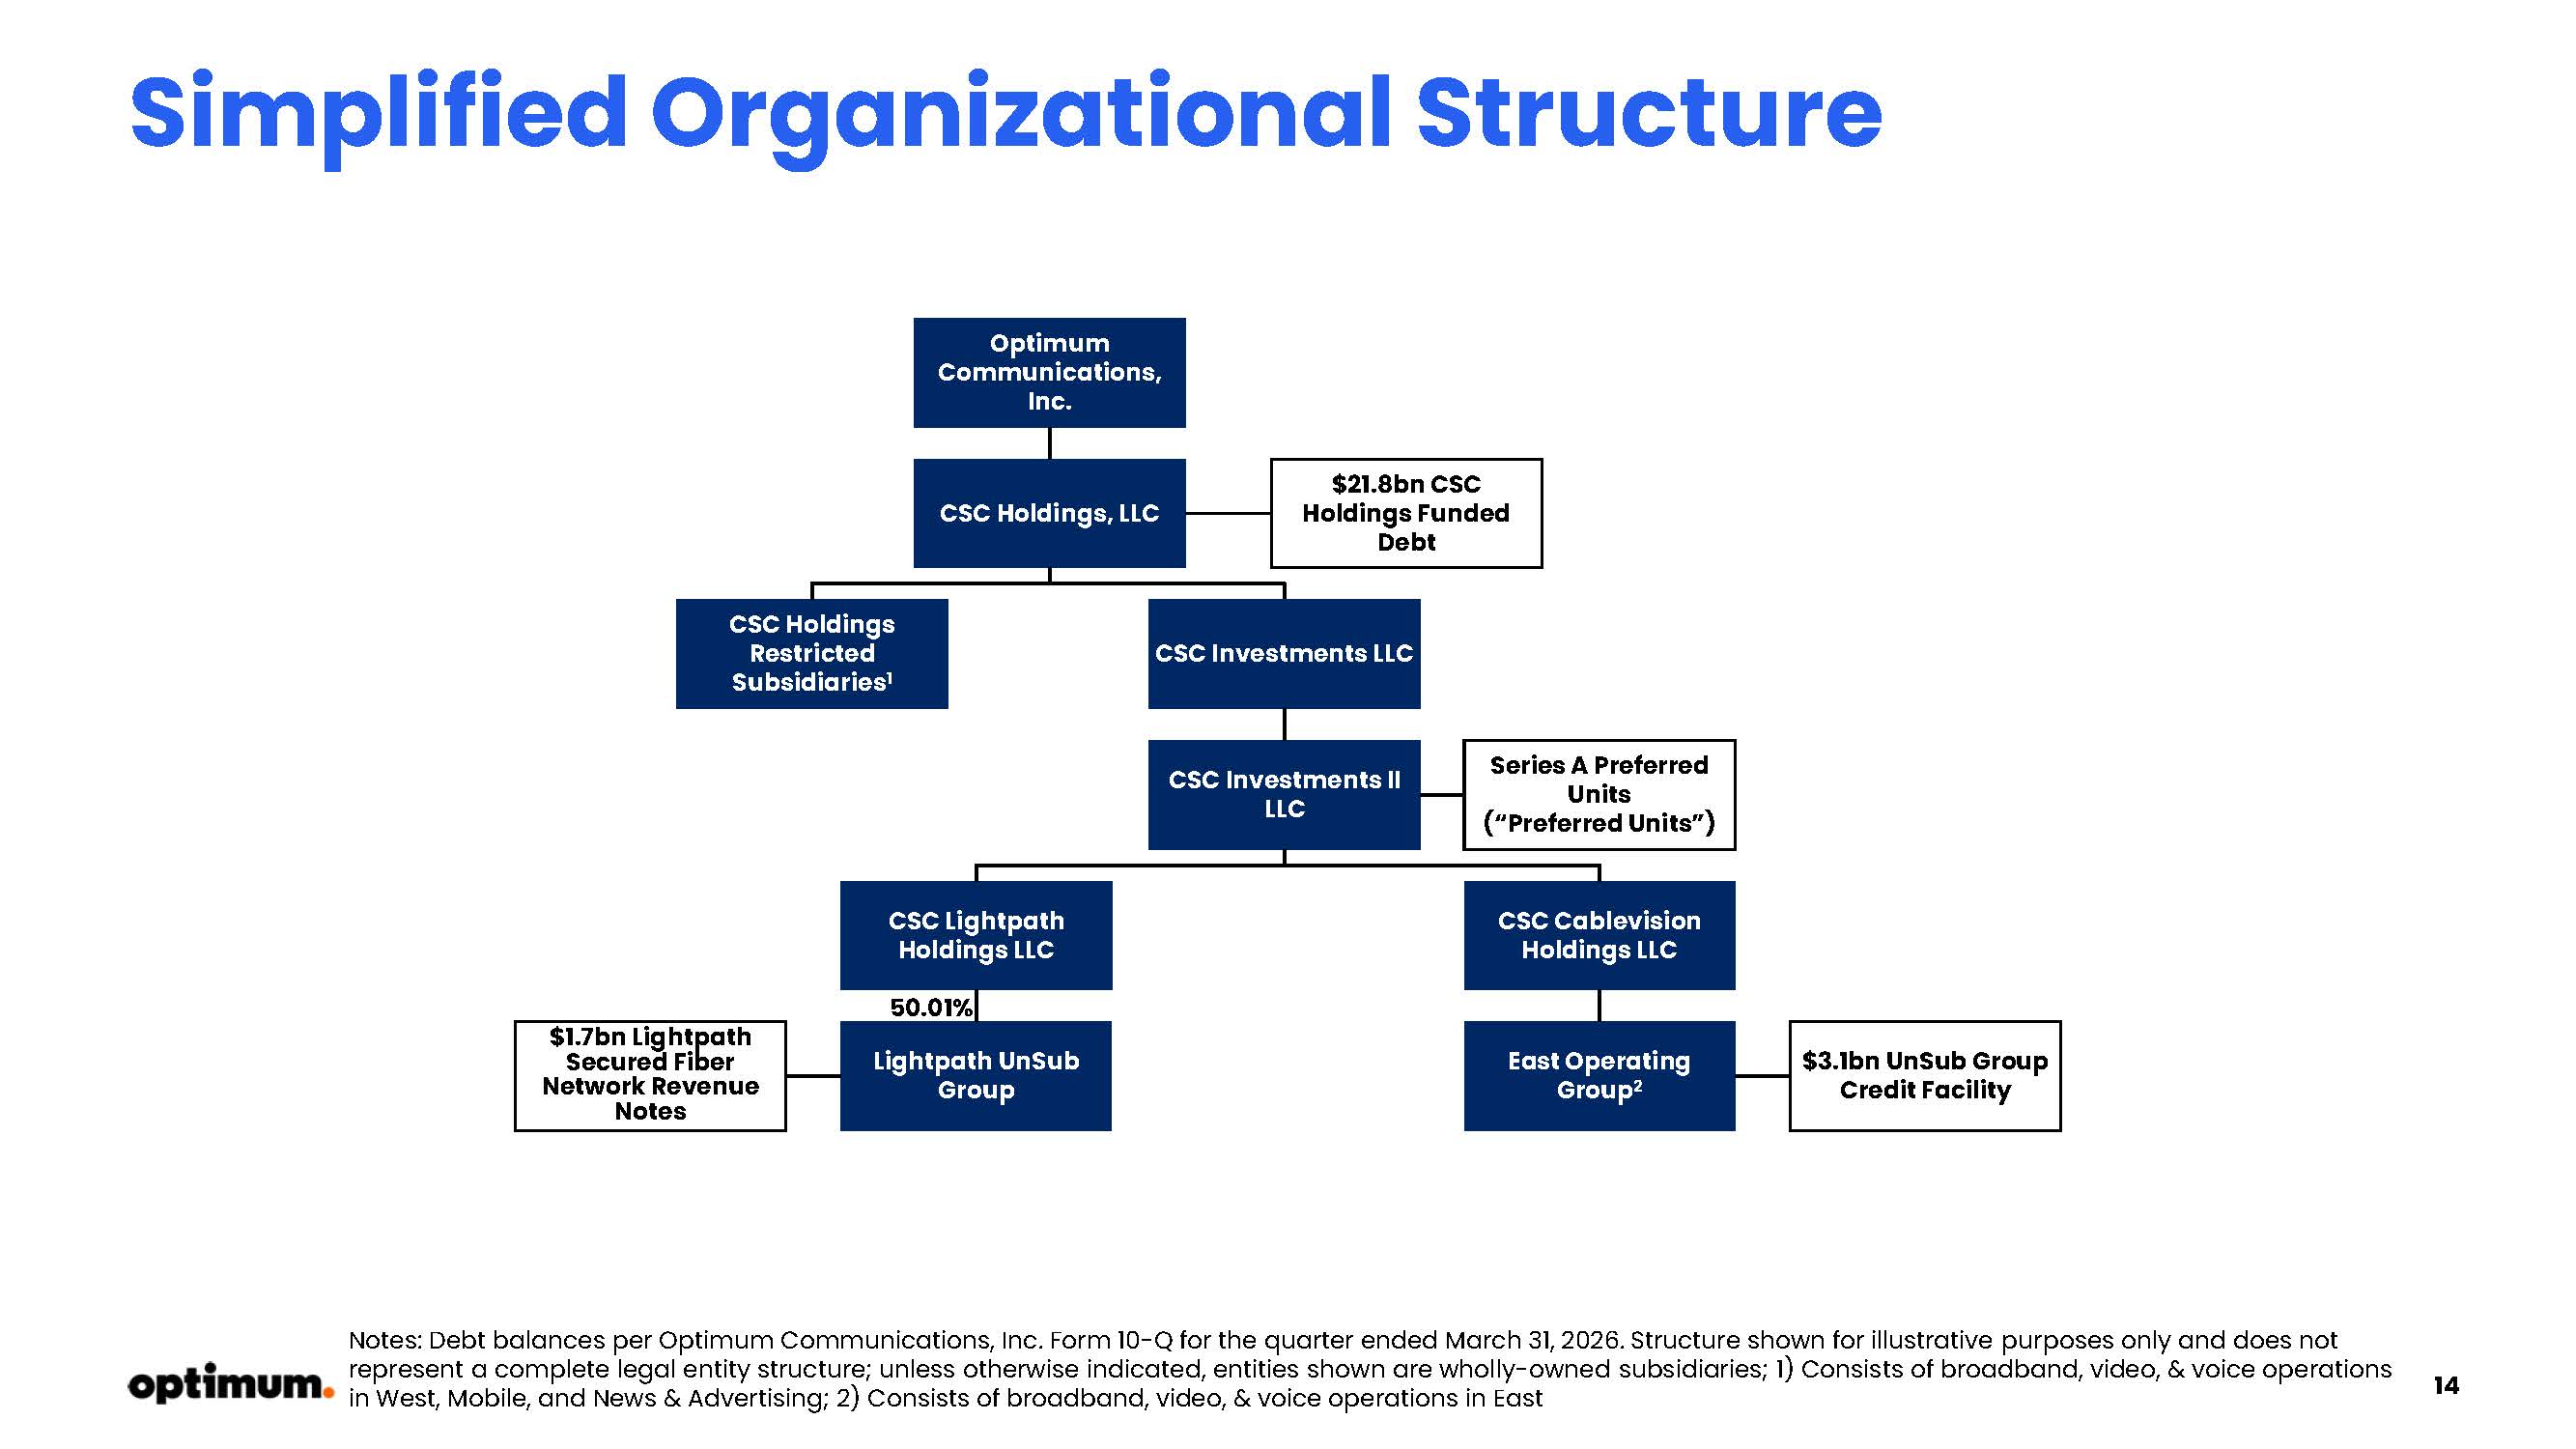
14 Simplified Organizational Structure Notes: Debt balances per Optimum Communications, Inc. Form 10 - Q for the quarter ended March 31, 2026. Structure shown for illustrative purposes only and does not represent a complete legal entity structure; unless otherwise indicated, entities shown are wholly - owned subsidiaries; 1) Consis ts of broadband, video, & voice operations in West, Mobile, and News & Advertising; 2) Consists of broadband, video, & voice operations in East Series A Preferred Units (“Preferred Units”) $21.8bn CSC Holdings Funded Debt Optimum Communications, Inc. CSC Holdings, LLC CSC Investments II LLC CSC Lightpath Holdings LLC CSC Cablevision Holdings LLC 50.01% $3.1bn UnSub Group Credit Facility CSC Holdings Restricted Subsidiaries 1 Lightpath UnSub Group $1.7bn Lightpath Secured Fiber Network Revenue Notes East Operating Group 2 CSC Investments LLC

15 15