
Exhibit 99.2
Q3 EARNINGS PRESENTATION NOVEMBER 6, 2025
6 February 2023 PAGE 2 Forward - Looking Statements Please note that in this presentation we may use words such as “appears,” “anticipates,” “believes,” “plans,” “expects,” “int end s,” “future,” and similar expressions which constitute forward - looking statements within the meaning of the safe harbor provisions of the Private Securities Litigation Reform Act of 1995. Forward - looking statem ents are made based on our expectations and beliefs concerning future events impacting the Company and therefore involve a number of risks and uncertainties. We caution that forward - looking statements are not guarantees and that actual results could differ materially from those expressed or implied in the forward - looking statements. Potential risks and uncertainties that could cause the actual results of operations or financial condition of the Company to differ materially from those expressed or implied by forward - looking statements in this presentation, include, but are not limited to, those risks and uncert ainties more fully described from time to time in the Company's public reports filed with the Securities and Exchange Commission, including under the section titled “Risk Factors” in the Company's Annual Report on Form 10 - K, and/or Quarterly Reports on Form 10 - Q, as well as in the Company’s Current Reports on Form 8 - K. All forward - looking statements included in this presentation are based upon information available t o the Company as of the date of this presentation and speak only as of the date hereof. We assume no obligation to update any forward - looking statements to reflect events or circumstances after the date of t his presentation. Non - GAAP Financial Measures The Company reports its financial results in accordance with U.S. generally accepted accounting principles (“GAAP”). This pre sen tation contains the non - GAAP measures: ( i ) adjusted gross margin and adjusted gross profit, (ii) adjusted (loss) income from continuing operations and related earnings (loss) per diluted share, (iii) ear nin gs before interest, taxes, other income or expense, depreciation and amortization (“EBITDA”), EBITDA margin, adjusted EBITDA, and adjusted EBITDA margin, and (iv) free cash flow (defined as net cash provided by operating activities less capital expenditures). The Company believes that the presentation of certain non - GAAP measures, i.e.: ( i ) adjusted gross margin and adjusted gross profit, (ii) adjusted (loss) income from continuing operations and related earning s ( loss) per diluted share, (iii) EBITDA, EBITDA margin, adjusted EBITDA and adjusted EBITDA margin, and (iv) free cash flow, provide useful information for the unders tan ding of its ongoing operations and enables investors to focus on period - over - period operating performance, and thereby enhances the user's overall understanding of the Company's current financial perfor man ce relative to past performance and provides, along with the nearest GAAP measures, a baseline for modeling future earnings expectations. Non - GAAP measures are reconciled to comparable GAAP financial me asures within this presentation. We do not provide a reconciliation of the non - GAAP guidance measures adjusted EBITDA and/or adjusted EBITDA margin for the fiscal year 2025 to net income for the fiscal y ear 2025, the most comparable GAAP financial measure, due to the inherent difficulty of forecasting certain types of expenses and gains, without unreasonable effort, which affect net income but not a dju sted EBITDA and/or adjusted EBITDA margin. The Company cautions that non - GAAP measures should be considered in addition to, but not as a substitute for, the Company's reported GAAP results. Additionally, th e Company notes that there can be no assurance that the above referenced non - GAAP financial measures are comparable to similarly titled financial measures used by other publicly traded companies. Market and Industry Data The market and industry data used throughout this presentation was obtained from various sources, including the Company’s own re search and estimates, surveys or studies conducted by third parties and industry or general publications and forecasts. Industry publications, surveys and forecasts generally state that they have o bta ined information from sources believed to be reliable, but there can be no assurance as to the accuracy and completeness of such information. While the Company believes that each of these surveys, studies, publ ica tions and forecasts is reliable, it has not independently verified such data and the Company is not making any representation as to the accuracy of such information. Similarly, the Company believes its internal re search and estimates are reliable but it has not been verified by any independent sources. In addition, while the Company believes that the industry and market information included herein is generally reliab le, such information is inherently imprecise. While the Company is not aware of any misstatements regarding the industry and market data presented herein, its estimates involve risks and uncertainties and are sub ject to change based on various factors, including those discussed under the heading “Forward - Looking Statements” above. DISCLAIMER

Warren Kanders EXECUTIVE CHAIRMAN Clarus TODAY’S PRESENTERS Mike Yates CFO Clarus Neil Fiske PRESIDENT Black Diamond Equipment
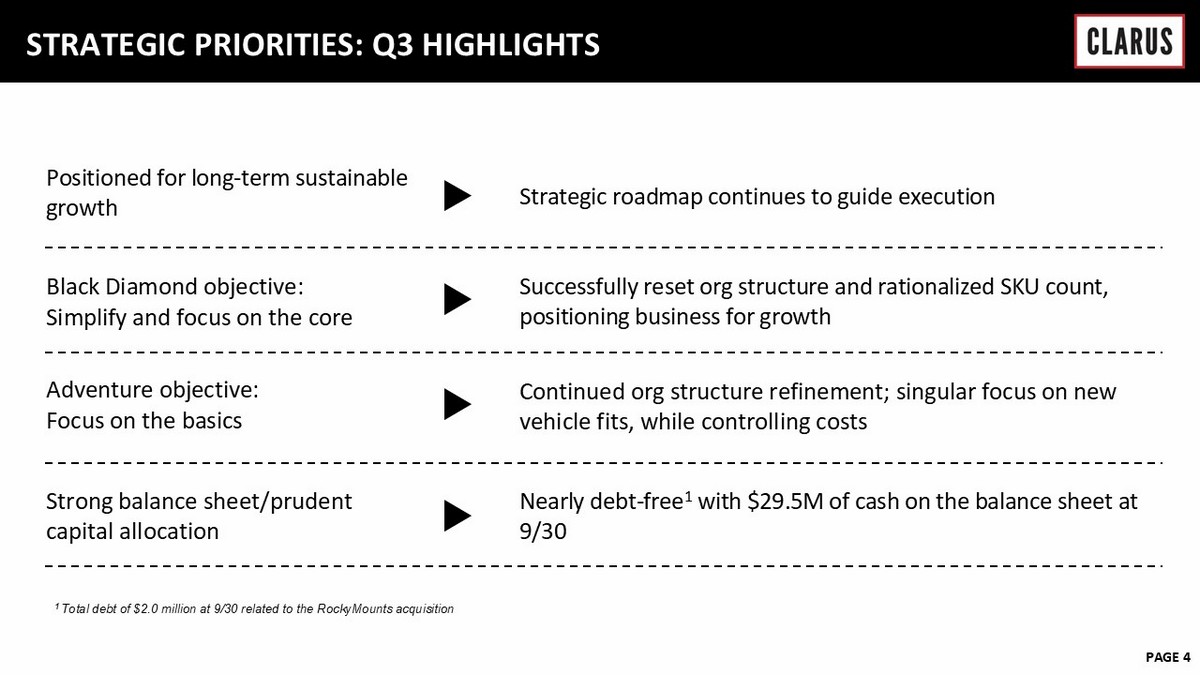
6 February 2023 PAGE 4 STRATEGIC PRIORITIES: Q3 HIGHLIGHTS Positioned for long - term sustainable growth Strategic roadmap continues to guide execution Black Diamond objective : Simplify and focus on the core Successfully reset org structure and rationalized SKU count, positioning business for growth Adventure objective: Focus on the basics Continued org structure refinement; singular focus on new vehicle fits, while controlling costs Strong balance sheet/ p rudent capital allocation Nearly debt - free 1 with $29.5M of cash on the balance sheet at 9/30 1 Total debt of $2.0 million at 9/30 related to the RockyMounts acquisition
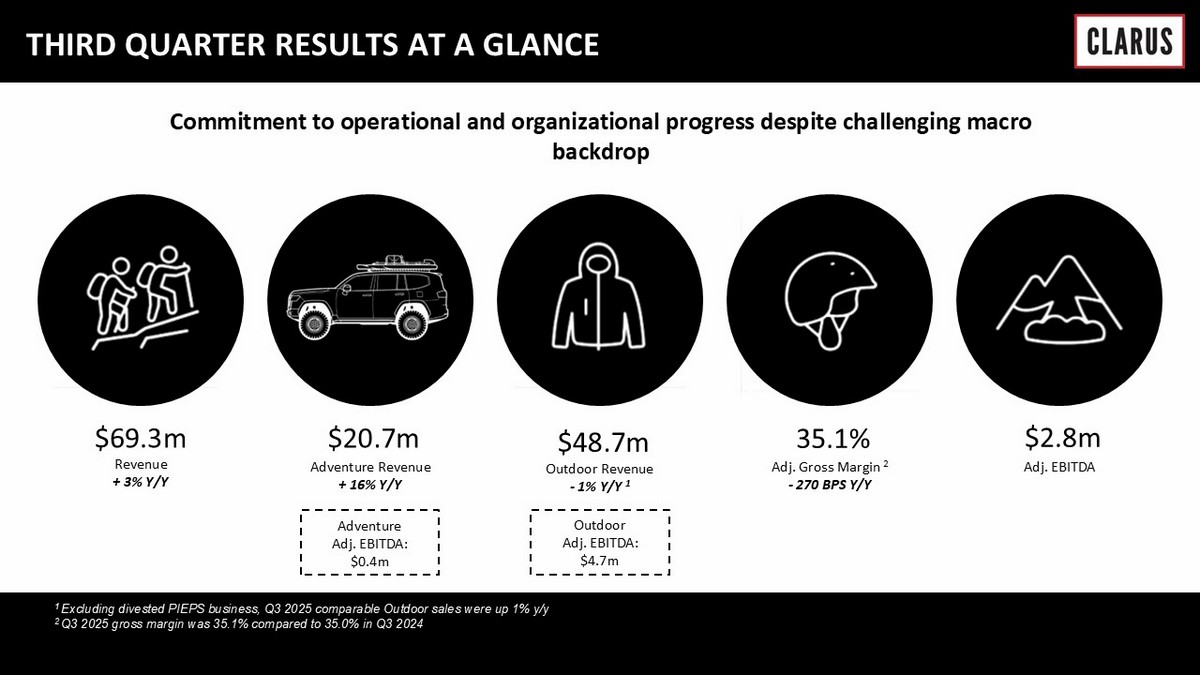
Commitment to operational and organizational progress despite challenging macro backdrop $ 69.3m $20.7 m $48.7 m 35.1 % $2.8 m Revenue + 3% Y/Y Adventure Revenue + 16% Y/Y Outdoor Revenue - 1% Y/Y 1 Adj. Gross Margin 2 - 270 BPS Y/Y Adj. EBITDA THIRD QUARTER RESULTS AT A GLANCE Adventure Adj. EBITDA: $0.4m Outdoor Adj. EBITDA: $4.7m 1 Excluding divested PIEPS business, Q3 2025 comparable Outdoor sales were up 1% y/y 2 Q3 2025 gross margin was 35.1% compared to 35.0% in Q3 2024
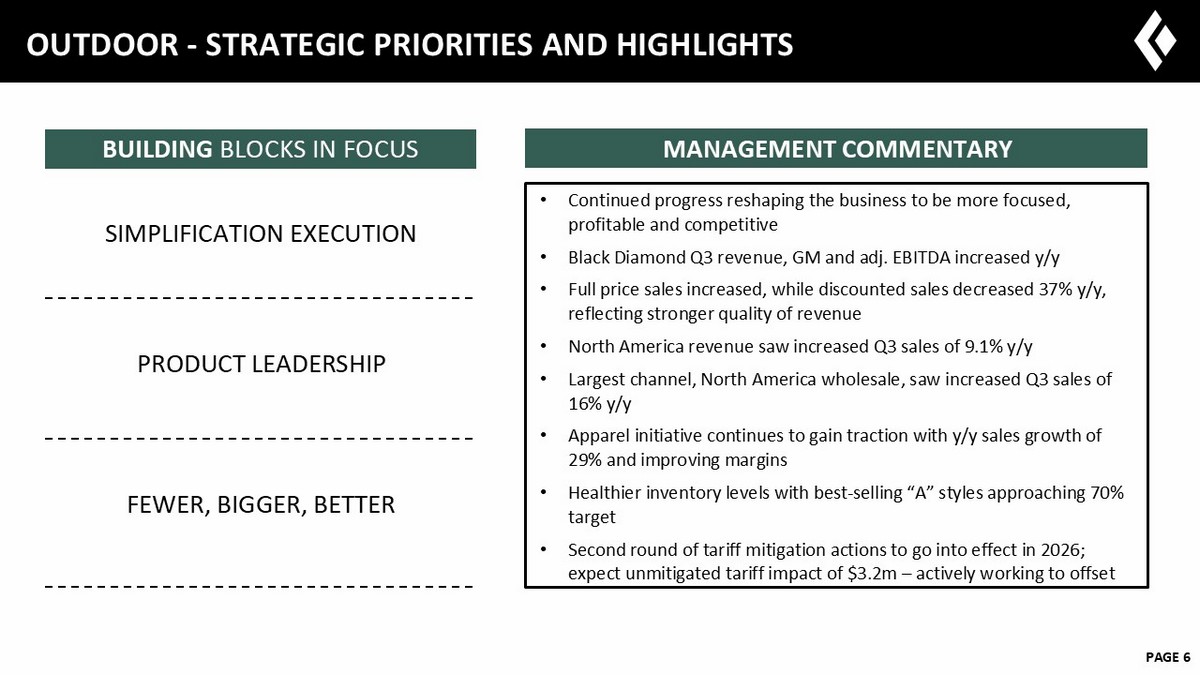
6 February 2023 PAGE 6 OUTDOOR - STRATEGIC PRIORITIES AND HIGHLIGHTS • Continued progress reshaping the business to be more focused, profitable and competitive • Black Diamond Q3 revenue, GM and adj. EBITDA increased y/y • Full price sales increased, while discounted sales decreased 37% y/y, reflecting stronger quality of revenue • North America revenue saw increased Q3 sales of 9.1% y/y • Largest channel, North America wholesale, saw increased Q3 sales of 16% y/y • Apparel initiative continues to gain traction with y/y sales growth of 29% and improving margins • Healthier inventory levels with best - selling “A” styles approaching 70% target • Second round of tariff mitigation actions to go into effect in 2026; expect unmitigated tariff impact of $3.2m – actively working to offset MANAGEMENT COMMENTARY BUILDING BLOCKS IN FOCUS SIMPLIFICATION EXECUTION PRODUCT LEADERSHIP FEWER, BIGGER, BETTER
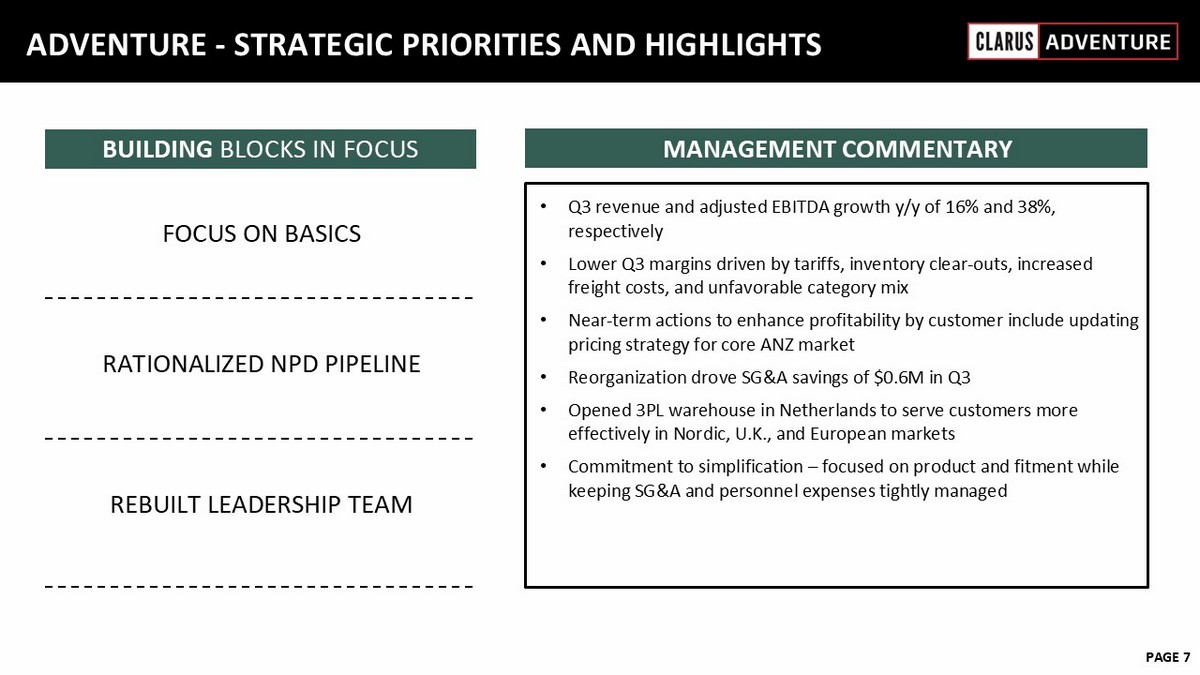
6 February 2023 PAGE 7 ADVENTURE - STRATEGIC PRIORITIES AND HIGHLIGHTS • Q3 revenue and adjusted EBITDA growth y/y of 16% and 38%, respectively • Lower Q3 margins driven by tariffs, inventory clear - outs, increased freight costs, and unfavorable category mix • Near - term actions to enhance profitability by customer include updating pricing strategy for core ANZ market • Reorganization drove SG&A savings of $0.6M in Q3 • Opened 3PL warehouse in Netherlands to serve customers more effectively in Nordic, U.K., and European markets • Commitment to simplification – focused on product and fitment while keeping SG&A and personnel expenses tightly managed MANAGEMENT COMMENTARY BUILDING BLOCKS IN FOCUS FOCUS ON BASICS RATIONALIZED NPD PIPELINE REBUILT LEADERSHIP TEAM
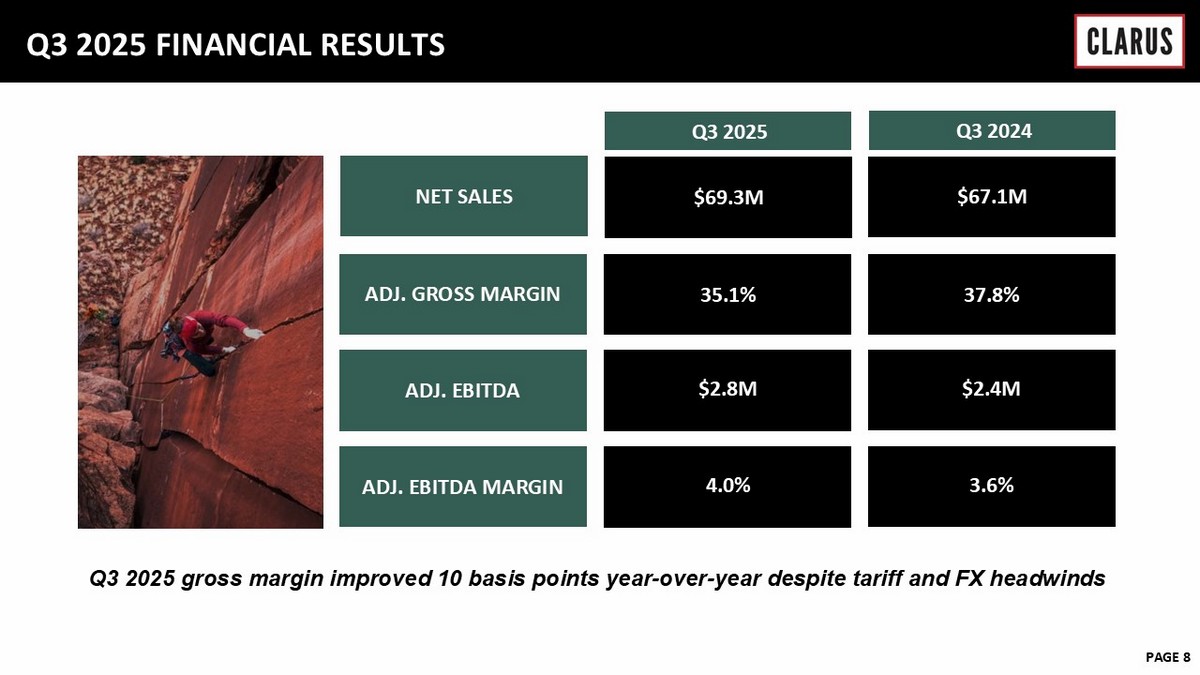
6 February 2023 PAGE 8 NET SALES Q3 2025 FINANCIAL RESULTS Q3 202 5 ADJ. GROSS MARGIN ADJ. EBITDA ADJ. EBITDA MARGIN 4.0% $2.8M 35.1% $69.3M Q3 202 4 3.6% $ 2.4 M 37.8% $67.1M Q3 2025 gross margin improved 10 basis points year - over - year despite tariff and FX headwinds

APPENDIX
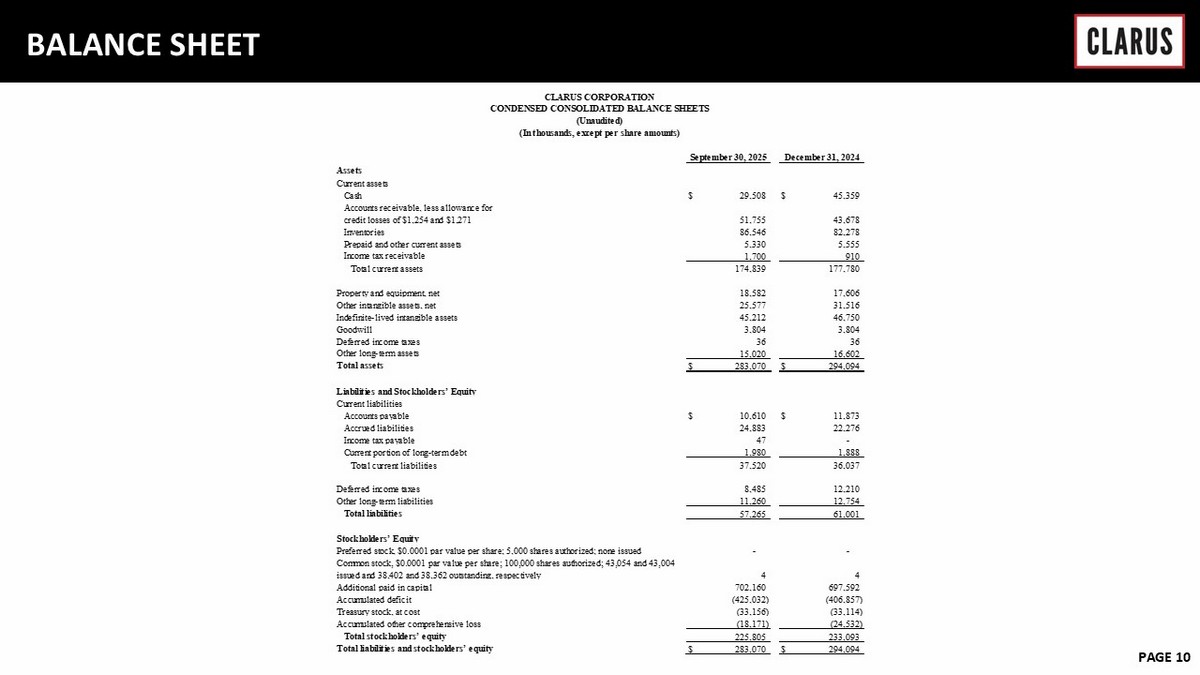
6 February 2023 PAGE 10 BALANCE SHEET Assets Current assets Cash $ 29,508 $ 45,359 Accounts receivable, less allowance for credit losses of $1,254 and $1,271 51,755 43,678 Inventories 86,546 82,278 Prepaid and other current assets 5,330 5,555 Income tax receivable 1,700 910 Total current assets 174,839 177,780 Property and equipment, net 18,582 17,606 Other intangible assets, net 25,577 31,516 Indefinite-lived intangible assets 45,212 46,750 Goodwill 3,804 3,804 Deferred income taxes 36 36 Other long-term assets 15,020 16,602 Total assets $ 283,070 $ 294,094 Liabilities and Stockholders’ Equity Current liabilities Accounts payable $ 10,610 $ 11,873 Accrued liabilities 24,883 22,276 Income tax payable 47 - Current portion of long-term debt 1,980 1,888 Total current liabilities 37,520 36,037 Deferred income taxes 8,485 12,210 Other long-term liabilities 11,260 12,754 Total liabilities 57,265 61,001 Stockholders’ Equity Preferred stock, $0.0001 par value per share; 5,000 shares authorized; none issued - - Common stock, $0.0001 par value per share; 100,000 shares authorized; 43,054 and 43,004 issued and 38,402 and 38,362 outstanding, respectively 4 4 Additional paid in capital 702,160 697,592 Accumulated deficit (425,032) (406,857) Treasury stock, at cost (33,156) (33,114) Accumulated other comprehensive loss (18,171) (24,532) Total stockholders’ equity 225,805 233,093 Total liabilities and stockholders’ equity $ 283,070 $ 294,094 September 30, 2025 December 31, 2024 CLARUS CORPORATION CONDENSED CONSOLIDATED BALANCE SHEETS (Unaudited) (In thousands, except per share amounts)
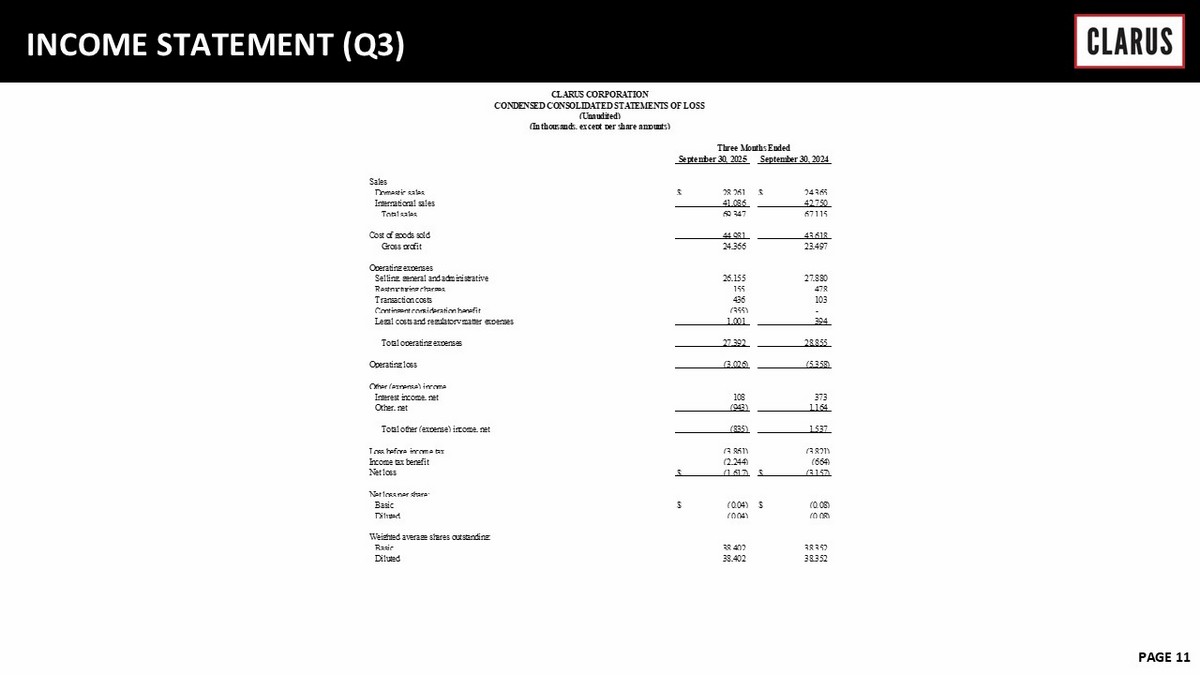
6 February 2023 PAGE 11 INCOME STATEMENT (Q3) Sales Domestic sales $ 28,261 $ 24,365 International sales 41,086 42,750 Total sales 69,347 67,115 Cost of goods sold 44,981 43,618 Gross profit 24,366 23,497 Operating expenses Selling, general and administrative 26,155 27,880 Restructuring charges 155 478 Transaction costs 436 103 Contingent consideration benefit (355) - Legal costs and regulatory matter expenses 1,001 394 Total operating expenses 27,392 28,855 Operating loss (3,026) (5,358) Other (expense) income Interest income, net 108 373 Other, net (943) 1,164 Total other (expense) income, net (835) 1,537 Loss before income tax (3,861) (3,821) Income tax benefit (2,244) (664) Net loss $ (1,617) $ (3,157) Net loss per share: Basic $ (0.04) $ (0.08) Diluted (0.04) (0.08) Weighted average shares outstanding: Basic 38,402 38,352 Diluted 38,402 38,352 CLARUS CORPORATION CONDENSED CONSOLIDATED STATEMENTS OF LOSS (Unaudited) (In thousands, except per share amounts) Three Months Ended September 30, 2025 September 30, 2024
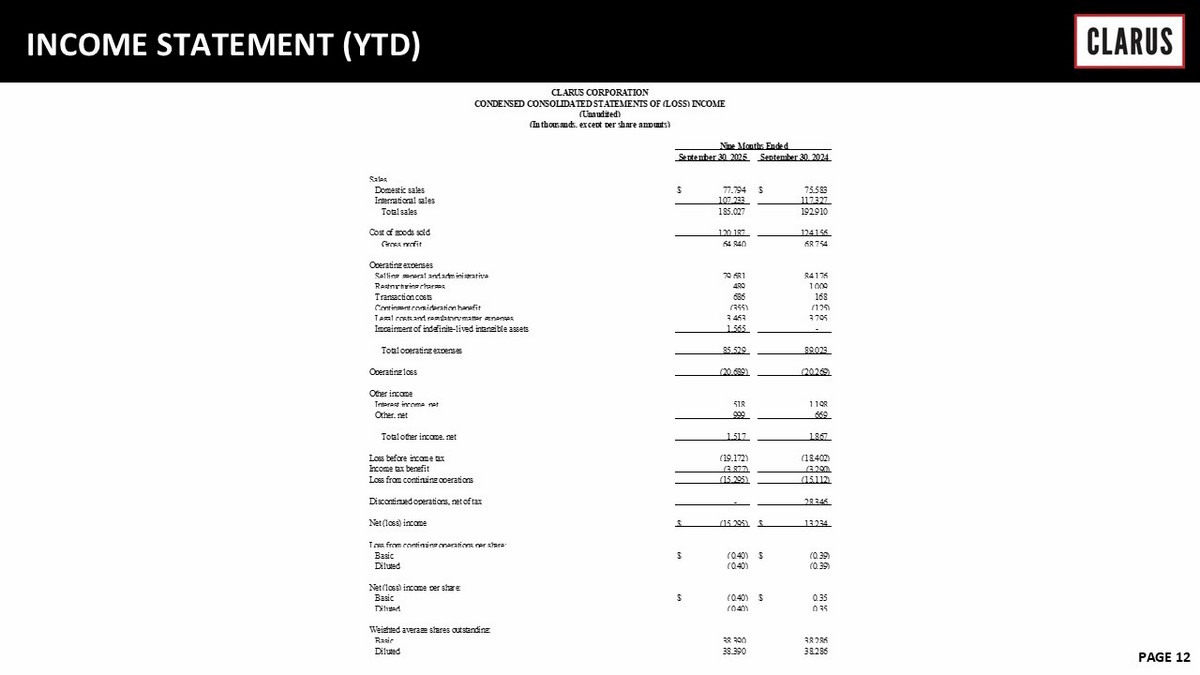
6 February 2023 PAGE 12 INCOME STATEMENT (YTD) Sales Domestic sales $ 77,794 $ 75,583 International sales 107,233 117,327 Total sales 185,027 192,910 Cost of goods sold 120,187 124,156 Gross profit 64,840 68,754 Operating expenses Selling, general and administrative 79,681 84,176 Restructuring charges 489 1,009 Transaction costs 686 168 Contingent consideration benefit (355) (125) Legal costs and regulatory matter expenses 3,463 3,795 Impairment of indefinite-lived intangible assets 1,565 - Total operating expenses 85,529 89,023 Operating loss (20,689) (20,269) Other income Interest income, net 518 1,198 Other, net 999 669 Total other income, net 1,517 1,867 Loss before income tax (19,172) (18,402) Income tax benefit (3,877) (3,290) Loss from continuing operations (15,295) (15,112) Discontinued operations, net of tax - 28,346 Net (loss) income $ (15,295) $ 13,234 Loss from continuing operations per share: Basic $ (0.40) $ (0.39) Diluted (0.40) (0.39) Net (loss) income per share: Basic $ (0.40) $ 0.35 Diluted (0.40) 0.35 Weighted average shares outstanding: Basic 38,390 38,286 Diluted 38,390 38,286 September 30, 2025 September 30, 2024 CLARUS CORPORATION CONDENSED CONSOLIDATED STATEMENTS OF (LOSS) INCOME (Unaudited) (In thousands, except per share amounts) Nine Months Ended
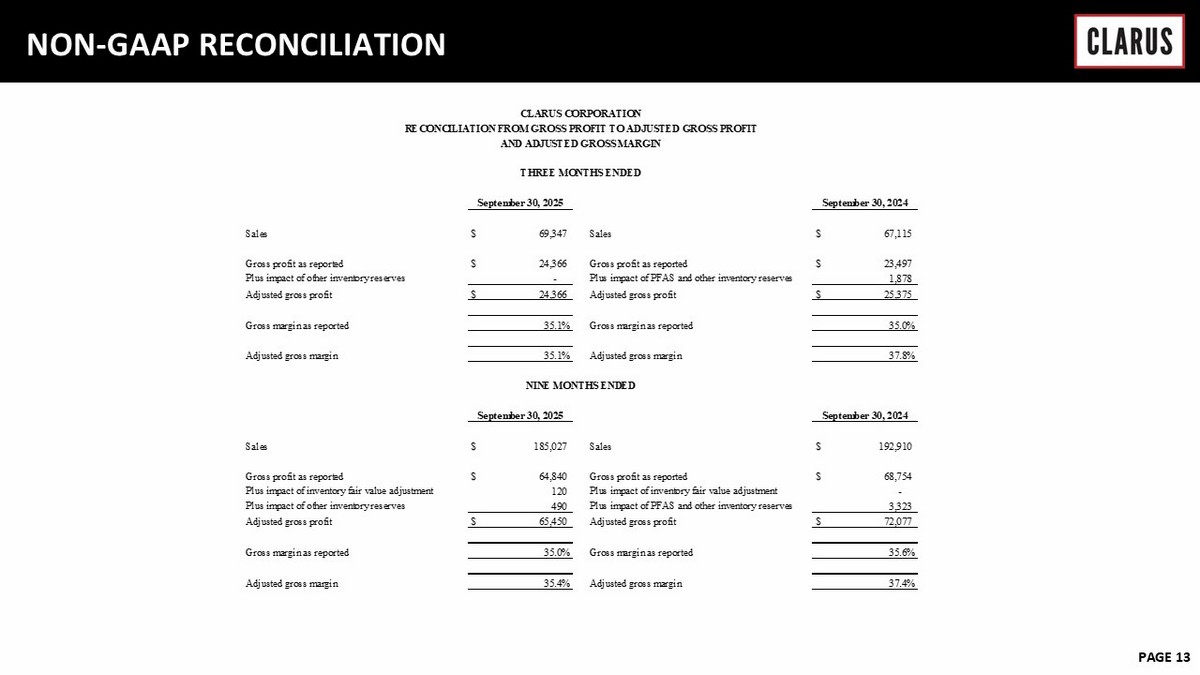
6 February 2023 PAGE 13 NON - GAAP RECONCILIATION Sales $ 69,347 Sales $ 67,115 Gross profit as reported $ 24,366 Gross profit as reported $ 23,497 Plus impact of other inventory reserves - Plus impact of PFAS and other inventory reserves 1,878 Adjusted gross profit $ 24,366 Adjusted gross profit $ 25,375 Gross margin as reported 35.1% Gross margin as reported 35.0% Adjusted gross margin 35.1% Adjusted gross margin 37.8% Sales $ 185,027 Sales $ 192,910 Gross profit as reported $ 64,840 Gross profit as reported $ 68,754 Plus impact of inventory fair value adjustment 120 Plus impact of inventory fair value adjustment - Plus impact of other inventory reserves 490 Plus impact of PFAS and other inventory reserves 3,323 Adjusted gross profit $ 65,450 Adjusted gross profit $ 72,077 Gross margin as reported 35.0% Gross margin as reported 35.6% Adjusted gross margin 35.4% Adjusted gross margin 37.4% NINE MONTHS ENDED September 30, 2025 September 30, 2024 CLARUS CORPORATION RECONCILIATION FROM GROSS PROFIT TO ADJUSTED GROSS PROFIT AND ADJUSTED GROSS MARGIN THREE MONTHS ENDED September 30, 2025 September 30, 2024
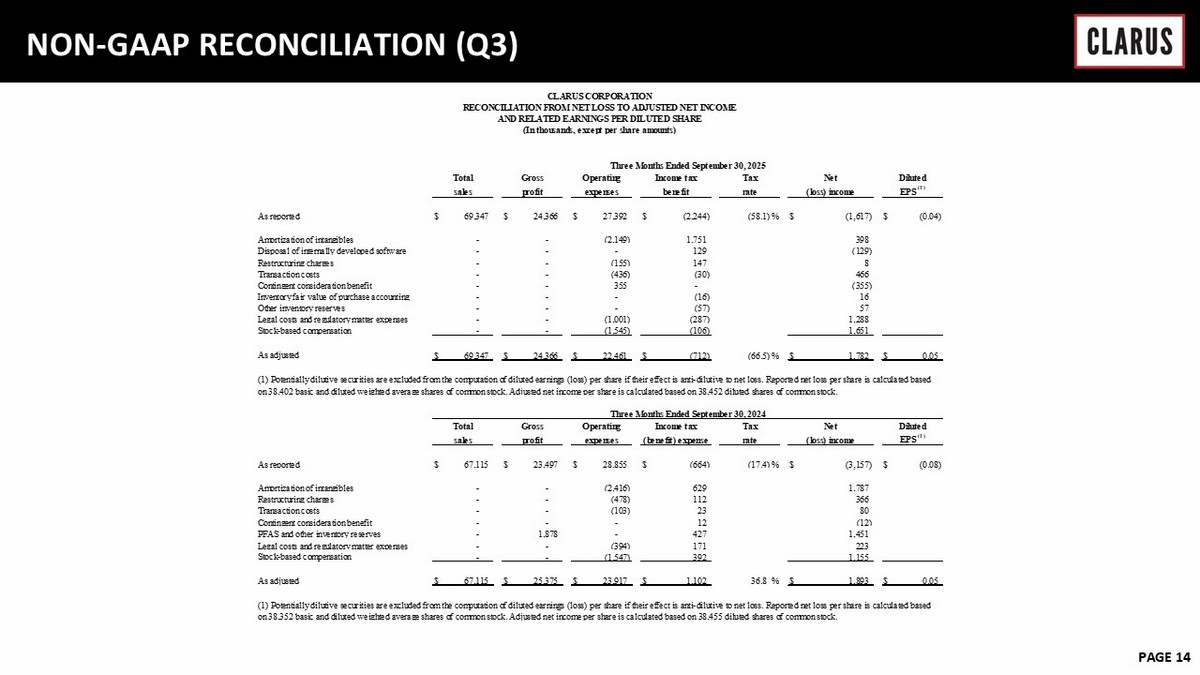
6 February 2023 PAGE 14 NON - GAAP RECONCILIATION (Q3) As reported $ 69,347 $ 24,366 $ 27,392 $ (2,244) (58.1) % $ (1,617) $ (0.04) Amortization of intangibles - - (2,149) 1,751 398 Disposal of internally developed software - - - 129 (129) Restructuring charges - - (155) 147 8 Transaction costs - - (436) (30) 466 Contingent consideration benefit - - 355 - (355) Inventory fair value of purchase accounting - - - (16) 16 Other inventory reserves - - - (57) 57 Legal costs and regulatory matter expenses - - (1,001) (287) 1,288 Stock-based compensation - - (1,545) (106) 1,651 As adjusted $ 69,347 $ 24,366 $ 22,461 $ (712) (66.5) % $ 1,782 $ 0.05 As reported $ 67,115 $ 23,497 $ 28,855 $ (664) (17.4) % $ (3,157) $ (0.08) Amortization of intangibles - - (2,416) 629 1,787 Restructuring charges - - (478) 112 366 Transaction costs - - (103) 23 80 Contingent consideration benefit - - - 12 (12) PFAS and other inventory reserves - 1,878 - 427 1,451 Legal costs and regulatory matter expenses - - (394) 171 223 Stock-based compensation - - (1,547) 392 1,155 As adjusted $ 67,115 $ 25,375 $ 23,917 $ 1,102 36.8 % $ 1,893 $ 0.05 CLARUS CORPORATION RECONCILIATION FROM NET LOSS TO ADJUSTED NET INCOME AND RELATED EARNINGS PER DILUTED SHARE (In thousands, except per share amounts) Three Months Ended September 30, 2025 Total Gross Operating Income tax Tax Net Diluted sales profit expenses benefit rate (loss) income EPS (1) (1) Potentially dilutive securities are excluded from the computation of diluted earnings (loss) per share if their effect is anti-dilutive to net loss. Reported net loss per share is calculated based on 38,402 basic and diluted weighted average shares of common stock. Adjusted net income per share is calculated based on 38,452 diluted shares of common stock. Three Months Ended September 30, 2024 Total Gross Operating Income tax (loss) income EPS (1) (1) Potentially dilutive securities are excluded from the computation of diluted earnings (loss) per share if their effect is anti-dilutive to net loss. Reported net loss per share is calculated based on 38,352 basic and diluted weighted average shares of common stock. Adjusted net income per share is calculated based on 38,455 diluted shares of common stock. Tax Net Diluted sales profit expenses (benefit) expense rate
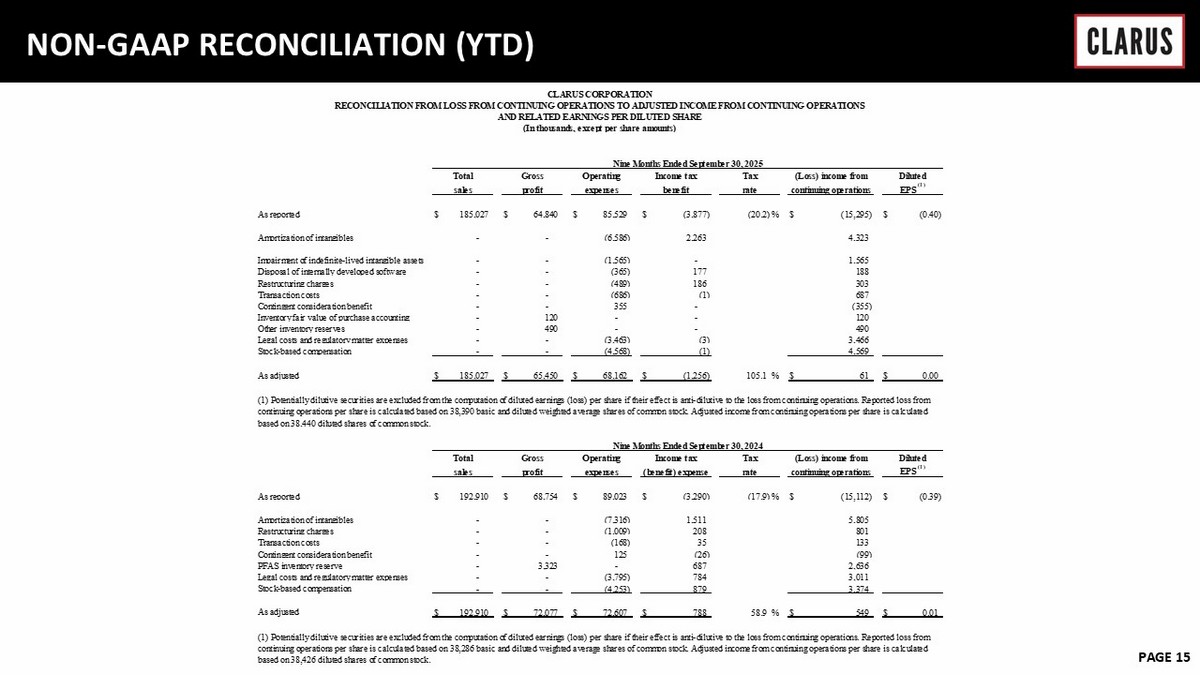
6 February 2023 PAGE 15 NON - GAAP RECONCILIATION (YTD) As reported $ 185,027 $ 64,840 $ 85,529 $ (3,877) (20.2) % $ (15,295) $ (0.40) Amortization of intangibles - - (6,586) 2,263 4,323 Impairment of indefinite-lived intangible assets - - (1,565) - 1,565 Disposal of internally developed software - - (365) 177 188 Restructuring charges - - (489) 186 303 Transaction costs - - (686) (1) 687 Contingent consideration benefit - - 355 - (355) Inventory fair value of purchase accounting - 120 - - 120 Other inventory reserves - 490 - - 490 Legal costs and regulatory matter expenses - - (3,463) (3) 3,466 Stock-based compensation - - (4,568) (1) 4,569 As adjusted $ 185,027 $ 65,450 $ 68,162 $ (1,256) 105.1 % $ 61 $ 0.00 As reported $ 192,910 $ 68,754 $ 89,023 $ (3,290) (17.9) % $ (15,112) $ (0.39) Amortization of intangibles - - (7,316) 1,511 5,805 Restructuring charges - - (1,009) 208 801 Transaction costs - - (168) 35 133 Contingent consideration benefit - - 125 (26) (99) PFAS inventory reserve - 3,323 - 687 2,636 Legal costs and regulatory matter expenses - - (3,795) 784 3,011 Stock-based compensation - - (4,253) 879 3,374 As adjusted $ 192,910 $ 72,077 $ 72,607 $ 788 58.9 % $ 549 $ 0.01 CLARUS CORPORATION RECONCILIATION FROM LOSS FROM CONTINUING OPERATIONS TO ADJUSTED INCOME FROM CONTINUING OPERATIONS AND RELATED EARNINGS PER DILUTED SHARE (In thousands, except per share amounts) Nine Months Ended September 30, 2025 Total Gross Operating Income tax Tax (Loss) income from Diluted sales profit expenses benefit rate continuing operations EPS (1) (1) Potentially dilutive securities are excluded from the computation of diluted earnings (loss) per share if their effect is anti-dilutive to the loss from continuing operations. Reported loss from continuing operations per share is calculated based on 38,390 basic and diluted weighted average shares of common stock. Adjusted income from continuing operations per share is calculated based on 38,440 diluted shares of common stock. Nine Months Ended September 30, 2024 Total Gross Operating Income tax continuing operations EPS (1) (1) Potentially dilutive securities are excluded from the computation of diluted earnings (loss) per share if their effect is anti-dilutive to the loss from continuing operations. Reported loss from continuing operations per share is calculated based on 38,286 basic and diluted weighted average shares of common stock. Adjusted income from continuing operations per share is calculated based on 38,426 diluted shares of common stock. Tax (Loss) income from Diluted sales profit expenses (benefit) expense rate
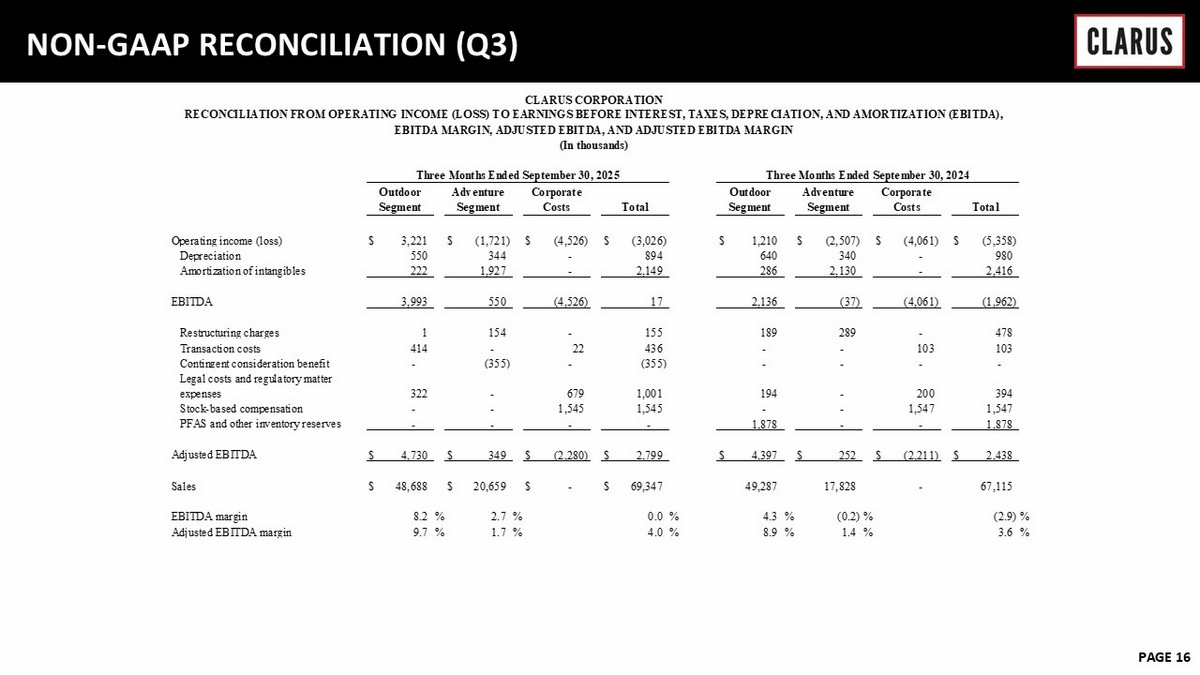
6 February 2023 PAGE 16 NON - GAAP RECONCILIATION (Q3) Operating income (loss) $ 3,221 $ (1,721) $ (4,526) $ (3,026) $ 1,210 $ (2,507) $ (4,061) $ (5,358) Depreciation 550 344 - 894 640 340 - 980 Amortization of intangibles 222 1,927 - 2,149 286 2,130 - 2,416 EBITDA 3,993 550 (4,526) 17 2,136 (37) (4,061) (1,962) Restructuring charges 1 154 - 155 189 289 - 478 Transaction costs 414 - 22 436 - - 103 103 Contingent consideration benefit - (355) - (355) - - - - Legal costs and regulatory matter expenses 322 - 679 1,001 194 - 200 394 Stock-based compensation - - 1,545 1,545 - - 1,547 1,547 PFAS and other inventory reserves - - - - 1,878 - - 1,878 Adjusted EBITDA $ 4,730 $ 349 $ (2,280) $ 2,799 $ 4,397 $ 252 $ (2,211) $ 2,438 Sales $ 48,688 $ 20,659 $ - $ 69,347 49,287 17,828 - 67,115 EBITDA margin 8.2 % 2.7 % 0.0 % 4.3 % (0.2) % (2.9) % Adjusted EBITDA margin 9.7 % 1.7 % 4.0 % 8.9 % 1.4 % 3.6 % CLARUS CORPORATION RECONCILIATION FROM OPERATING INCOME (LOSS) TO EARNINGS BEFORE INTEREST, TAXES, DEPRECIATION, AND AMORTIZATION (EBITDA), EBITDA MARGIN, ADJUSTED EBITDA, AND ADJUSTED EBITDA MARGIN (In thousands) Three Months Ended September 30, 2025 Three Months Ended September 30, 2024 Outdoor Segment Adventure Segment Corporate Costs Total Outdoor Segment Adventure Segment Corporate Costs Total
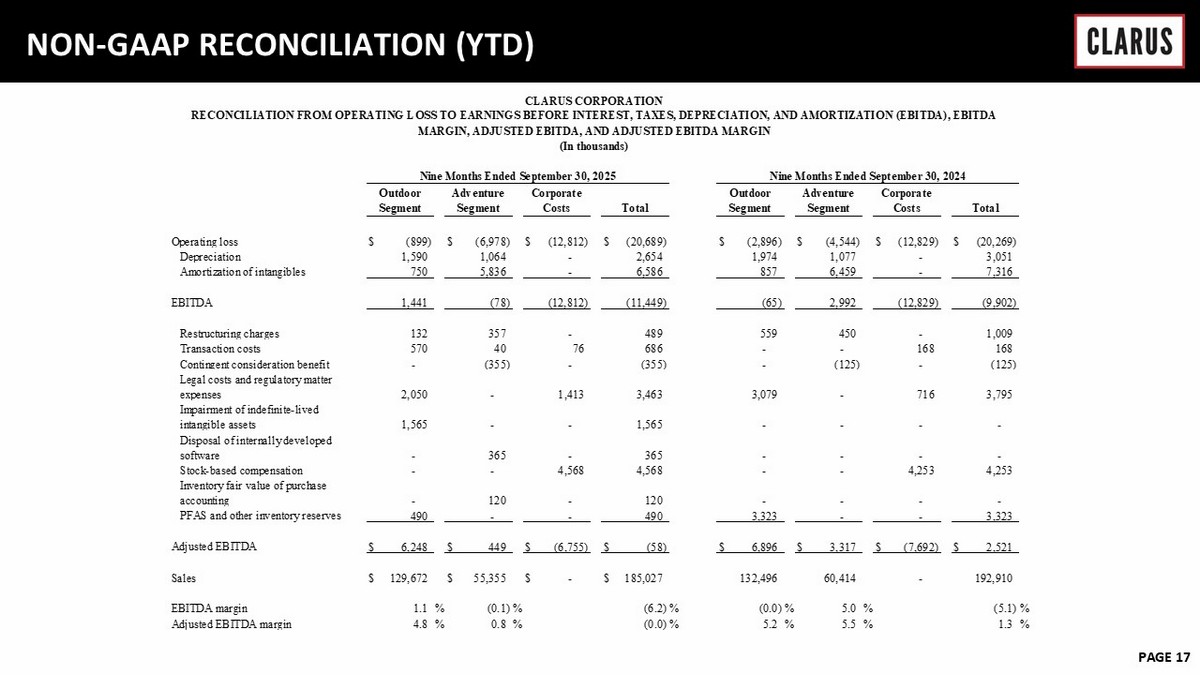
6 February 2023 PAGE 17 NON - GAAP RECONCILIATION (YTD) Operating loss $ (899) $ (6,978) $ (12,812) $ (20,689) $ (2,896) $ (4,544) $ (12,829) $ (20,269) Depreciation 1,590 1,064 - 2,654 1,974 1,077 - 3,051 Amortization of intangibles 750 5,836 - 6,586 857 6,459 - 7,316 EBITDA 1,441 (78) (12,812) (11,449) (65) 2,992 (12,829) (9,902) Restructuring charges 132 357 - 489 559 450 - 1,009 Transaction costs 570 40 76 686 - - 168 168 Contingent consideration benefit - (355) - (355) - (125) - (125) Legal costs and regulatory matter expenses 2,050 - 1,413 3,463 3,079 - 716 3,795 Impairment of indefinite-lived intangible assets 1,565 - - 1,565 - - - - Disposal of internally developed software - 365 - 365 - - - - Stock-based compensation - - 4,568 4,568 - - 4,253 4,253 Inventory fair value of purchase accounting - 120 - 120 - - - - PFAS and other inventory reserves 490 - - 490 3,323 - - 3,323 Adjusted EBITDA $ 6,248 $ 449 $ (6,755) $ (58) $ 6,896 $ 3,317 $ (7,692) $ 2,521 Sales $ 129,672 $ 55,355 $ - $ 185,027 132,496 60,414 - 192,910 EBITDA margin 1.1 % (0.1) % (6.2) % (0.0) % 5.0 % (5.1) % Adjusted EBITDA margin 4.8 % 0.8 % (0.0) % 5.2 % 5.5 % 1.3 % Adventure Segment Corporate Costs Total CLARUS CORPORATION RECONCILIATION FROM OPERATING LOSS TO EARNINGS BEFORE INTEREST, TAXES, DEPRECIATION, AND AMORTIZATION (EBITDA), EBITDA MARGIN, ADJUSTED EBITDA, AND ADJUSTED EBITDA MARGIN (In thousands) Nine Months Ended September 30, 2025 Nine Months Ended September 30, 2024 Outdoor Segment Adventure Segment Corporate Costs Total Outdoor Segment