
Exhibit 99.2
Q4 EARNINGS PRESENTATION MARCH 5, 2026
6 February 2023 PAGE 2 Forward - Looking Statements Please note that in this presentation we may use words such as “appears,” “anticipates,” “believes,” “plans,” “expects,” “int end s,” “future,” and similar expressions which constitute forward - looking statements within the meaning of the safe harbor provisions of the Private Securities Litigation Reform Act of 1995. Forward - looking statem ents are made based on our expectations and beliefs concerning future events impacting the Company and therefore involve a number of risks and uncertainties. We caution that forward - looking statements are not guarantees and that actual results could differ materially from those expressed or implied in the forward - looking statements. Potential risks and uncertainties that could cause the actual results of operations or financial condition of the Company to differ materially from those expressed or implied by forward - looking statements in this presentation, include, but are not limited to, those risks and uncert ainties more fully described from time to time in the Company's public reports filed with the Securities and Exchange Commission, including under the section titled “Risk Factors” in the Company's Annual Report on Form 10 - K, and/or Quarterly Reports on Form 10 - Q, as well as in the Company’s Current Reports on Form 8 - K. All forward - looking statements included in this presentation are based upon information available t o the Company as of the date of this presentation and speak only as of the date hereof. We assume no obligation to update any forward - looking statements to reflect events or circumstances after the date of t his presentation. Non - GAAP Financial Measures The Company reports its financial results in accordance with U.S. generally accepted accounting principles (“GAAP”). This pre sen tation contains the non - GAAP measures: ( i ) adjusted gross margin and adjusted gross profit, (ii) adjusted (loss) income from continuing operations and related earnings (loss) per diluted share, (iii) ear nin gs before interest, taxes, other income or expense, depreciation and amortization (“EBITDA”), EBITDA margin, adjusted EBITDA, and adjusted EBITDA margin, and (iv) free cash flow (defined as net cash provided by operating activities less capital expenditures). The Company believes that the presentation of certain non - GAAP measures, i.e.: ( i ) adjusted gross margin and adjusted gross profit, (ii) adjusted (loss) income from continuing operations and related earning s ( loss) per diluted share, (iii) EBITDA, EBITDA margin, adjusted EBITDA and adjusted EBITDA margin, and (iv) free cash flow, provide useful information for the unders tan ding of its ongoing operations and enables investors to focus on period - over - period operating performance, and thereby enhances the user's overall understanding of the Company's current financial perfor man ce relative to past performance and provides, along with the nearest GAAP measures, a baseline for modeling future earnings expectations. Non - GAAP measures are reconciled to comparable GAAP financial me asures within this presentation. We do not provide a reconciliation of the non - GAAP guidance measures adjusted EBITDA and/or adjusted EBITDA margin for the fiscal year 2026 to net income for the fiscal y ear 2026, the most comparable GAAP financial measure, due to the inherent difficulty of forecasting certain types of expenses and gains, without unreasonable effort, which affect net income but not a dju sted EBITDA and/or adjusted EBITDA margin. The Company cautions that non - GAAP measures should be considered in addition to, but not as a substitute for, the Company's reported GAAP results. Additionally, th e Company notes that there can be no assurance that the above referenced non - GAAP financial measures are comparable to similarly titled financial measures used by other publicly traded companies. Market and Industry Data The market and industry data used throughout this presentation was obtained from various sources, including the Company’s own re search and estimates, surveys or studies conducted by third parties and industry or general publications and forecasts. Industry publications, surveys and forecasts generally state that they have o bta ined information from sources believed to be reliable, but there can be no assurance as to the accuracy and completeness of such information. While the Company believes that each of these surveys, studies, publ ica tions and forecasts is reliable, it has not independently verified such data and the Company is not making any representation as to the accuracy of such information. Similarly, the Company believes its internal re search and estimates are reliable but it has not been verified by any independent sources. In addition, while the Company believes that the industry and market information included herein is generally reliab le, such information is inherently imprecise. While the Company is not aware of any misstatements regarding the industry and market data presented herein, its estimates involve risks and uncertainties and are sub ject to change based on various factors, including those discussed under the heading “Forward - Looking Statements” above. DISCLAIMER

Warren Kanders EXECUTIVE CHAIRMAN Clarus TODAY’S PRESENTERS Mike Yates CFO Clarus Neil Fiske PRESIDENT Black Diamond Equipment
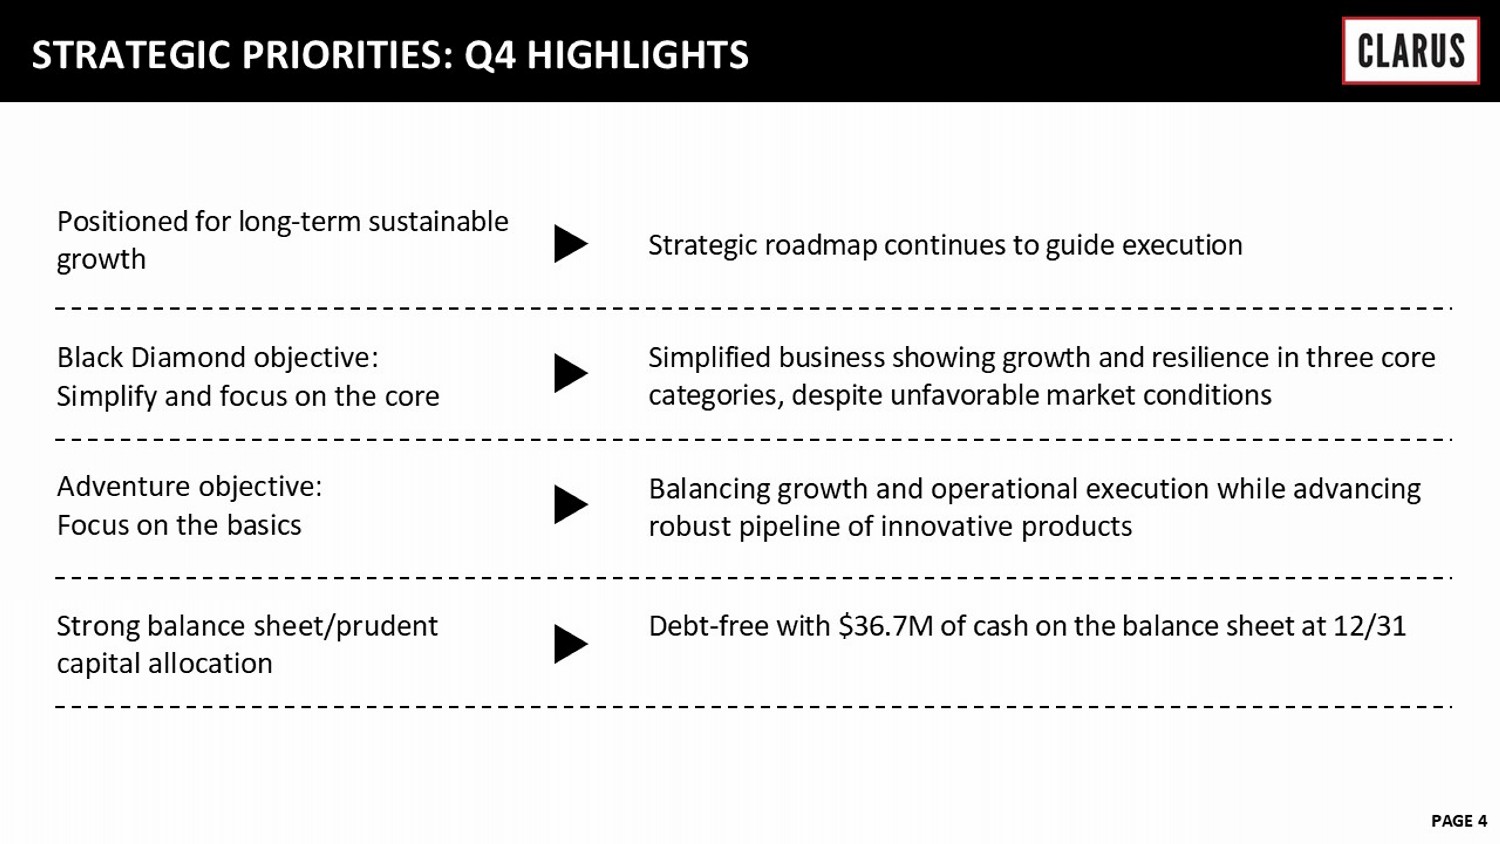
6 February 2023 PAGE 4 STRATEGIC PRIORITIES: Q4 HIGHLIGHTS Positioned for long - term sustainable growth Strategic roadmap continues to guide execution Black Diamond objective : Simplify and focus on the core Simplified business showing growth and resilience in three core categories, despite unfavorable market conditions Adventure objective: Focus on the basics Balancing growth and operational execution while advancing robust pipeline of innovative products Strong balance sheet/prudent capital allocation Debt - free with $36.7M of cash on the balance sheet at 12/31
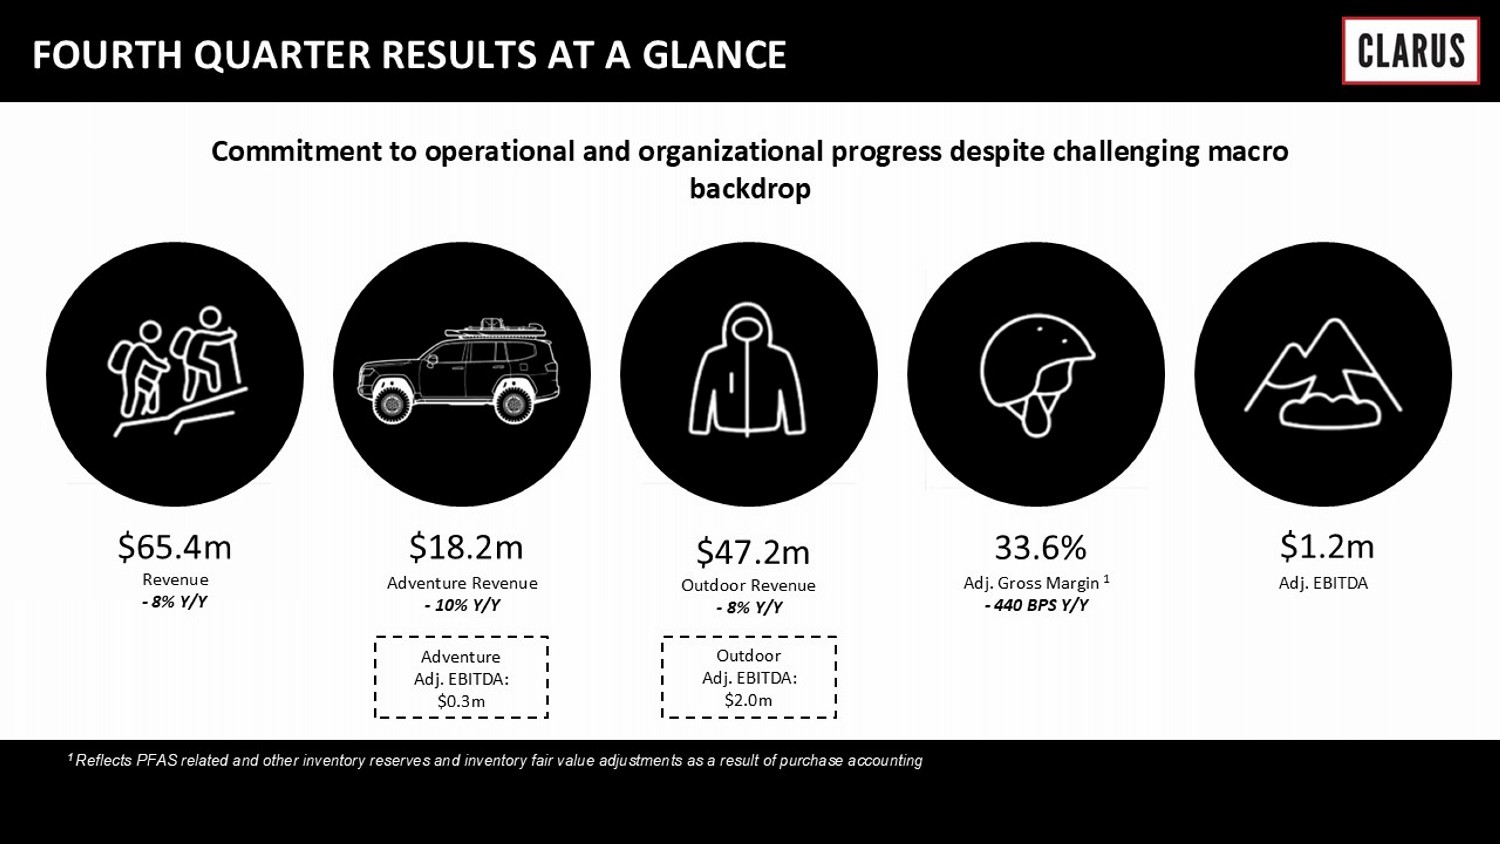
Commitment to operational and organizational progress despite challenging macro backdrop $ 65.4m $ 18.2m $47.2 m 33.6 % $ 1.2m Revenue - 8% Y/Y Adventure Revenue - 10% Y/Y Outdoor Revenue - 8% Y/Y Adj. Gross Margin 1 - 440 BPS Y/Y Adj. EBITDA FOURTH QUARTER RESULTS AT A GLANCE Adventure Adj. EBITDA: $0.3m Outdoor Adj. EBITDA: $2.0m 1 Reflects PFAS related and other inventory reserves and inventory fair value adjustments as a result of purchase accounting
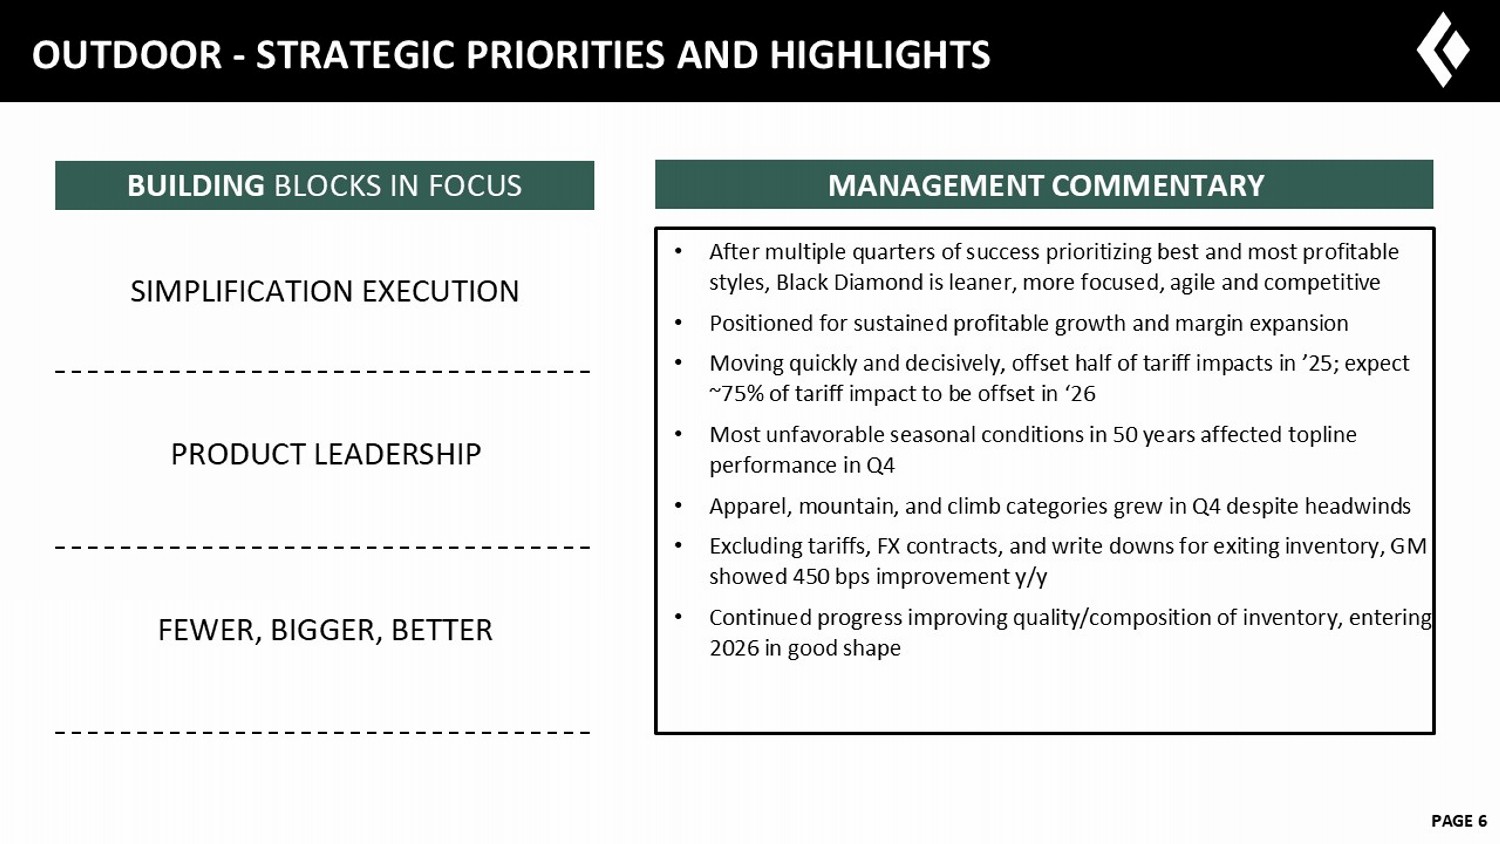
6 February 2023 PAGE 6 OUTDOOR - STRATEGIC PRIORITIES AND HIGHLIGHTS • After multiple quarters of success prioritizing best and most profitable styles, Black Diamond is leaner, more focused, agile and competitive • Positioned for sustained profitable growth and margin expansion • Moving quickly and decisively, offset half of tariff impacts in ’25; expect ~75% of tariff impact to be offset in ‘26 • Most unfavorable seasonal conditions in 50 years affected topline performance in Q4 • Apparel, mountain, and climb categories grew in Q4 despite headwinds • Excluding tariffs, FX contracts, and write downs for exiting inventory, GM showed 450 bps improvement y/y • Continued progress improving quality/composition of inventory, entering 2026 in good shape MANAGEMENT COMMENTARY BUILDING BLOCKS IN FOCUS SIMPLIFICATION EXECUTION PRODUCT LEADERSHIP FEWER, BIGGER, BETTER
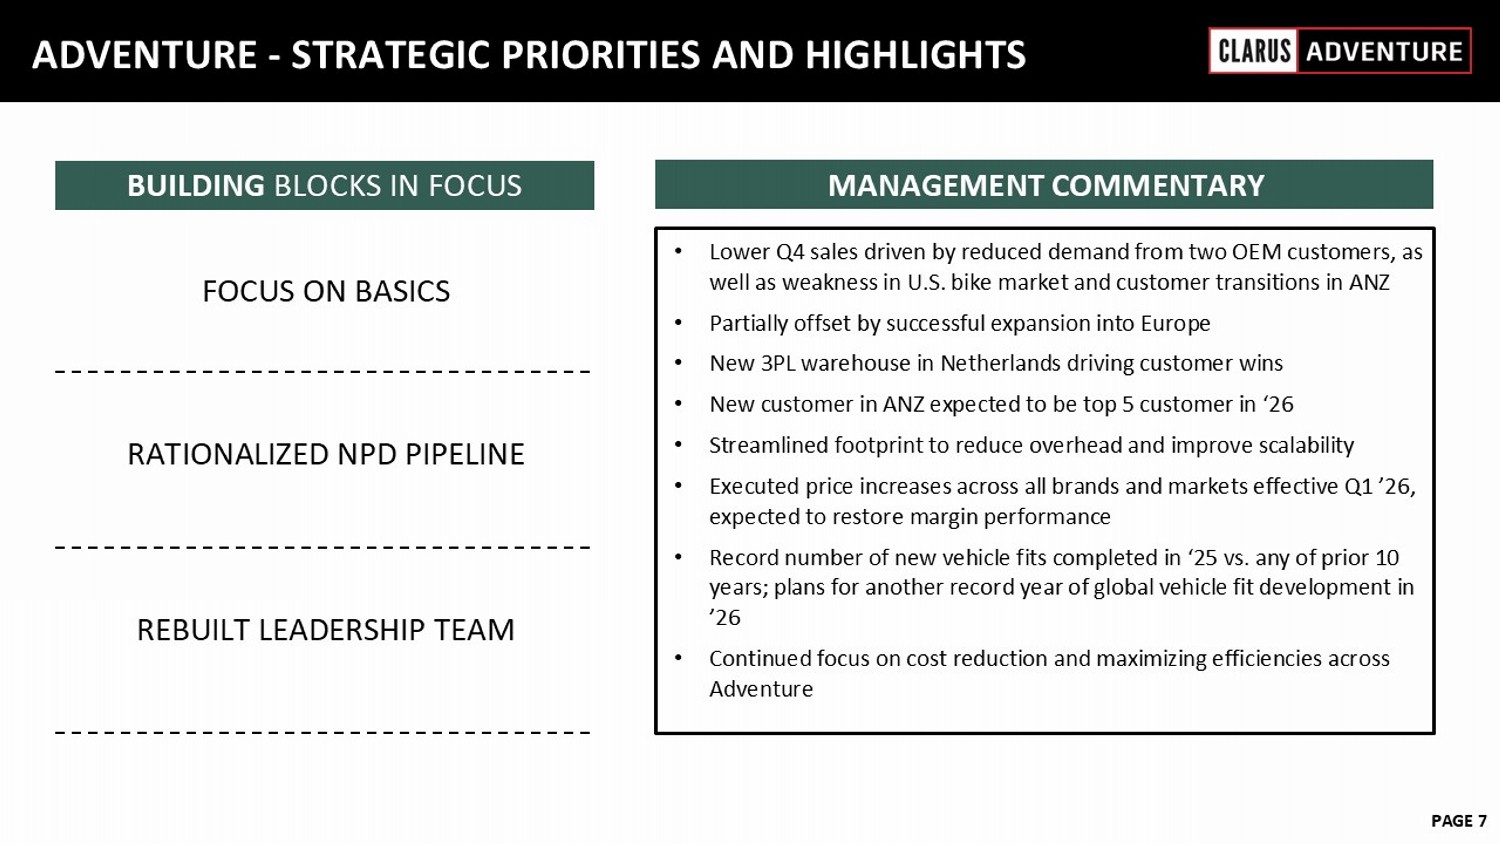
6 February 2023 PAGE 7 ADVENTURE - STRATEGIC PRIORITIES AND HIGHLIGHTS • Lower Q4 sales driven by reduced demand from two OEM customers, as well as weakness in U.S. bike market and customer transitions in ANZ • Partially offset by successful expansion into Europe • New 3PL warehouse in Netherlands driving customer wins • New customer in ANZ expected to be top 5 customer in ‘26 • Streamlined footprint to reduce overhead and improve scalability • Executed price increases across all brands and markets effective Q1 ’26, expected to restore margin performance • Record number of new vehicle fits completed in ‘25 vs. any of prior 10 years; plans for another record year of global vehicle fit development in ’26 • Continued focus on cost reduction and maximizing efficiencies across Adventure MANAGEMENT COMMENTARY BUILDING BLOCKS IN FOCUS FOCUS ON BASICS RATIONALIZED NPD PIPELINE REBUILT LEADERSHIP TEAM
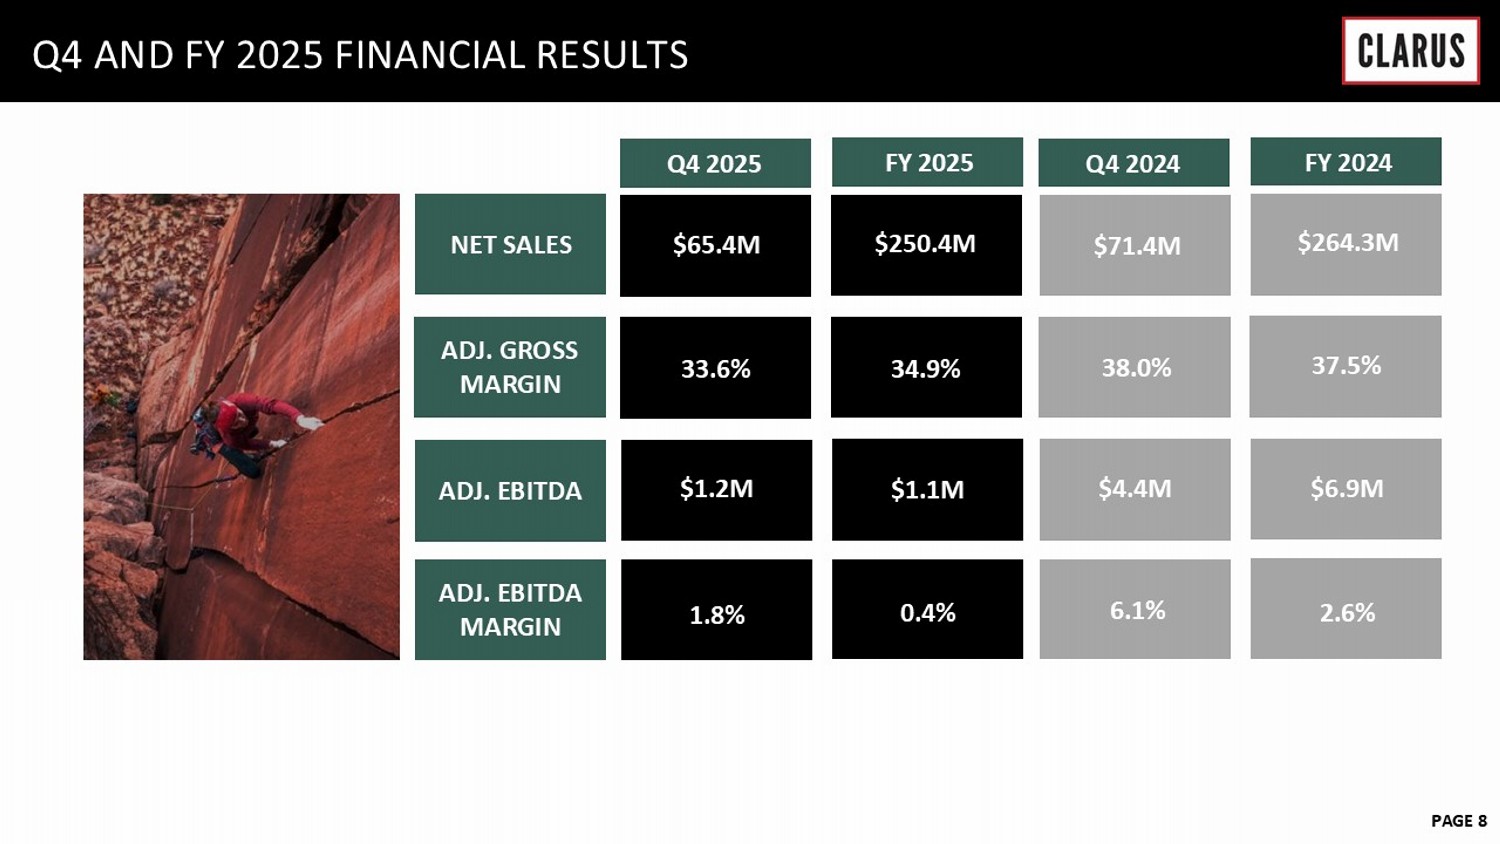
6 February 2023 PAGE 8 NET SALES Q4 AND FY 2025 FINANCIAL RESULTS Q 4 2025 ADJ. GROSS MARGIN ADJ. EBITDA ADJ. EBITDA MARGIN 1.8% $1.2M 33.6% $65.4M FY 2025 0.4% $1.1M 34.9% $ 250.4 M Q 4 202 4 6.1% $4.4M 38.0% $71.4M FY 202 4 2.6% $6.9M 37.5% $ 264.3 M
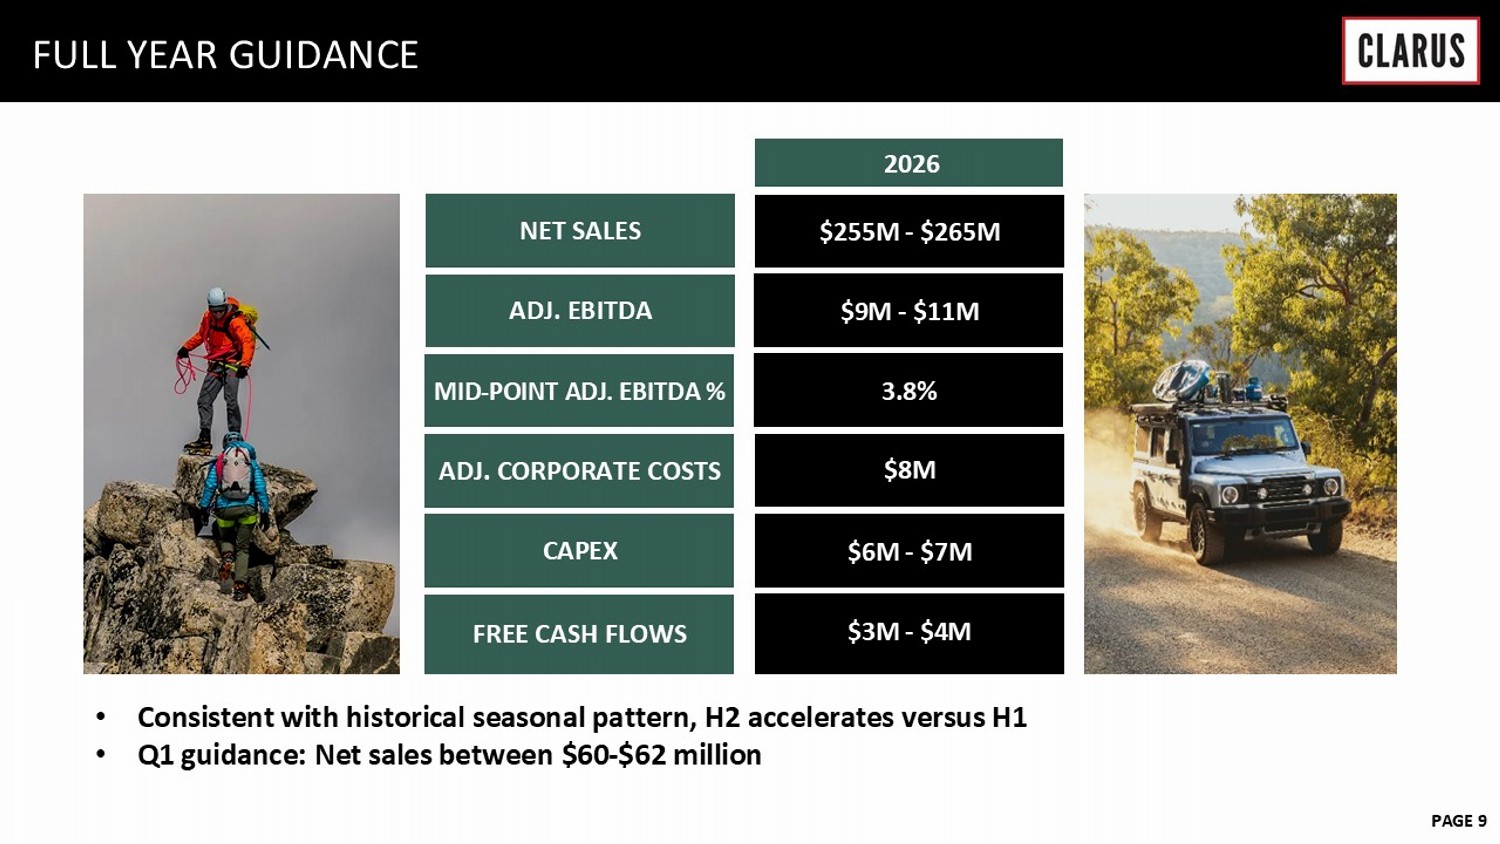
6 February 2023 PAGE 9 NET SALES FULL YEAR GUIDANCE ADJ. CORPORATE COSTS ADJ. EBITDA MID - POINT ADJ. EBITDA % CAPEX FREE CASH FLOWS $255M - $265M $6M - $7M $ 9 M - $11M 3.8 % $8M $3M - $ 4 M 2026 • Consistent with historical seasonal pattern, H 2 accelerates versus H 1 • Q 1 guidance : Net sales between $ 60 - $ 62 million

APPENDIX
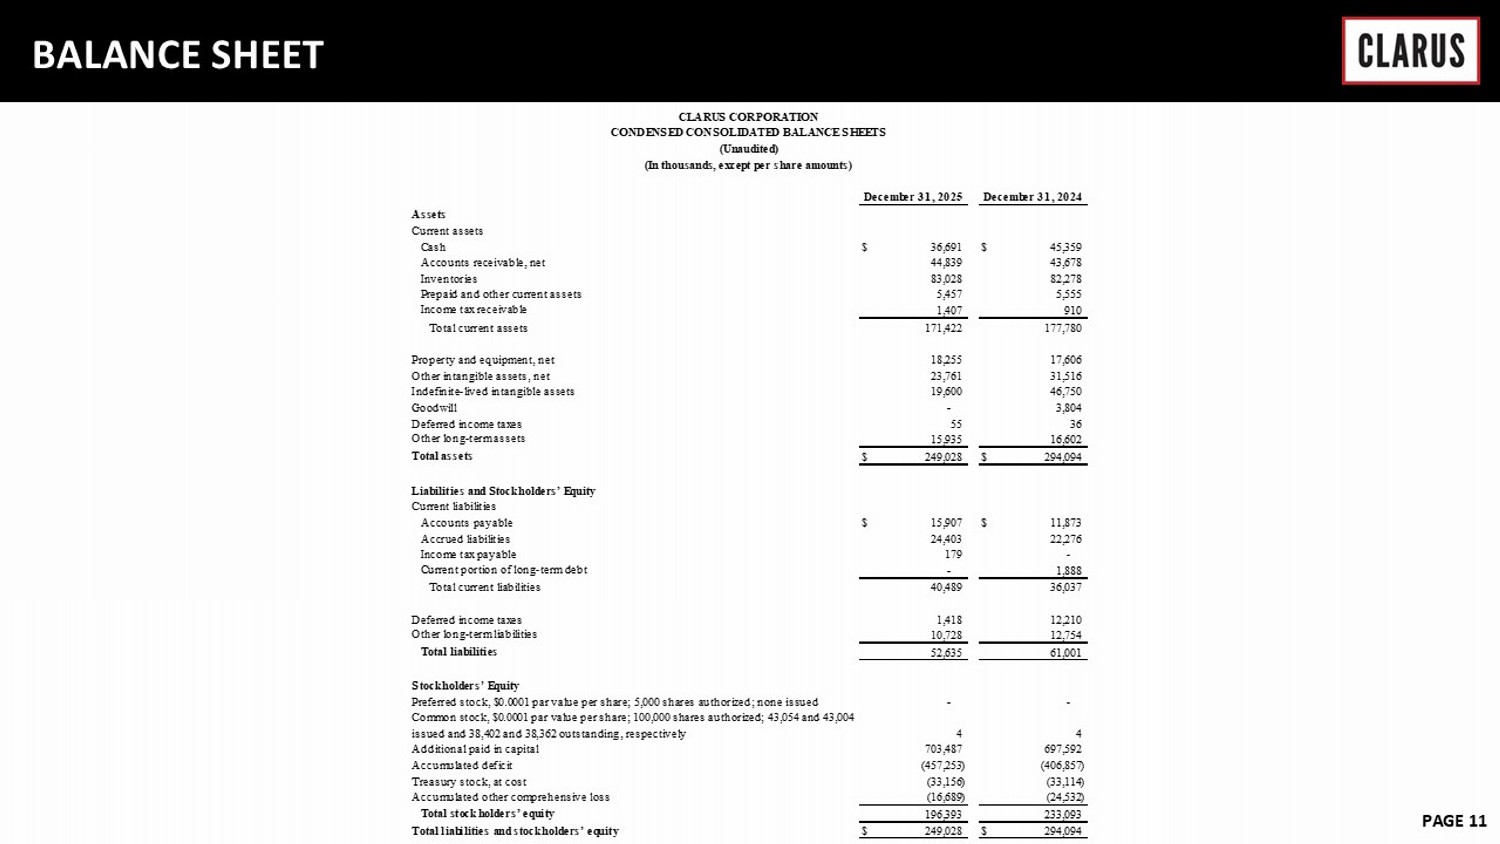
6 February 2023 PAGE 11 BALANCE SHEET Assets Current assets Cash $ 36,691 $ 45,359 Accounts receivable, net 44,839 43,678 Inventories 83,028 82,278 Prepaid and other current assets 5,457 5,555 Income tax receivable 1,407 910 Total current assets 171,422 177,780 Property and equipment, net 18,255 17,606 Other intangible assets, net 23,761 31,516 Indefinite-lived intangible assets 19,600 46,750 Goodwill - 3,804 Deferred income taxes 55 36 Other long-term assets 15,935 16,602 Total assets $ 249,028 $ 294,094 Liabilities and Stockholders’ Equity Current liabilities Accounts payable $ 15,907 $ 11,873 Accrued liabilities 24,403 22,276 Income tax payable 179 - Current portion of long-term debt - 1,888 Total current liabilities 40,489 36,037 Deferred income taxes 1,418 12,210 Other long-term liabilities 10,728 12,754 Total liabilities 52,635 61,001 Stockholders’ Equity Preferred stock, $0.0001 par value per share; 5,000 shares authorized; none issued - - Common stock, $0.0001 par value per share; 100,000 shares authorized; 43,054 and 43,004 issued and 38,402 and 38,362 outstanding, respectively 4 4 Additional paid in capital 703,487 697,592 Accumulated deficit (457,253) (406,857) Treasury stock, at cost (33,156) (33,114) Accumulated other comprehensive loss (16,689) (24,532) Total stockholders’ equity 196,393 233,093 Total liabilities and stockholders’ equity $ 249,028 $ 294,094 December 31, 2025 December 31, 2024 CLARUS CORPORATION CONDENSED CONSOLIDATED BALANCE SHEETS (Unaudited) (In thousands, except per share amounts)
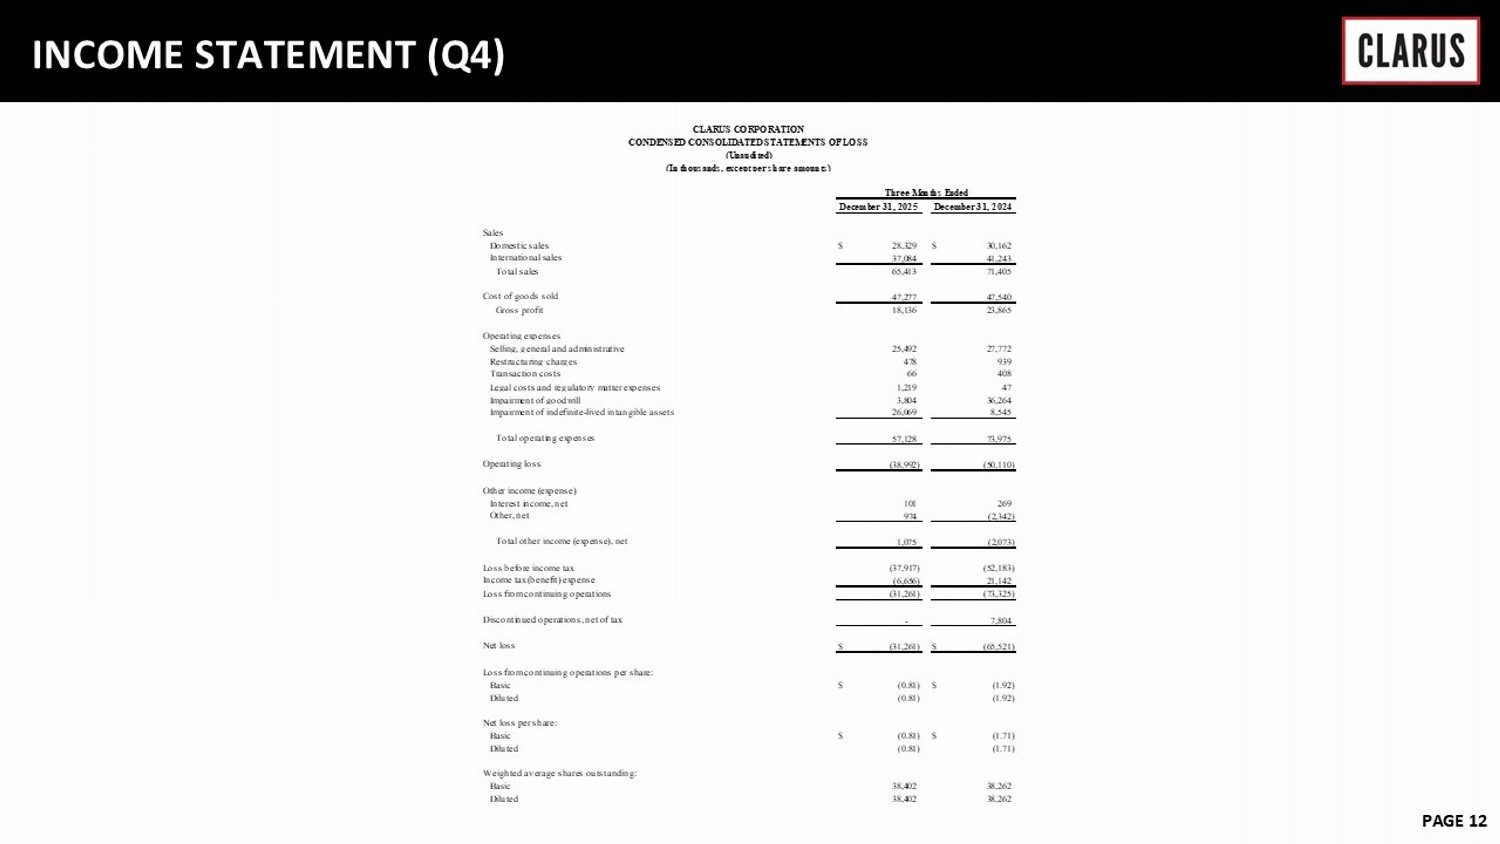
6 February 2023 PAGE 12 INCOME STATEMENT (Q4) Sales Domestic sales $ 28,329 $ 30,162 International sales 37,084 41,243 Total sales 65,413 71,405 Cost of goods sold 47,277 47,540 Gross profit 18,136 23,865 Operating expenses Selling, general and administrative 25,492 27,772 Restructuring charges 478 939 Transaction costs 66 408 Legal costs and regulatory matter expenses 1,219 47 Impairment of goodwill 3,804 36,264 Impairment of indefinite-lived intangible assets 26,069 8,545 Total operating expenses 57,128 73,975 Operating loss (38,992) (50,110) Other income (expense) Interest income, net 101 269 Other, net 974 (2,342) Total other income (expense), net 1,075 (2,073) Loss before income tax (37,917) (52,183) Income tax (benefit) expense (6,656) 21,142 Loss from continuing operations (31,261) (73,325) Discontinued operations, net of tax - 7,804 Net loss $ (31,261) $ (65,521) Loss from continuing operations per share: Basic $ (0.81) $ (1.92) Diluted (0.81) (1.92) Net loss per share: Basic $ (0.81) $ (1.71) Diluted (0.81) (1.71) Weighted average shares outstanding: Basic 38,402 38,262 Diluted 38,402 38,262 CLARUS CORPORATION CONDENSED CONSOLIDATED STATEMENTS OF LOSS (Unaudited) (In thousands, except per share amounts) Three Months Ended December 31, 2025 December 31, 2024
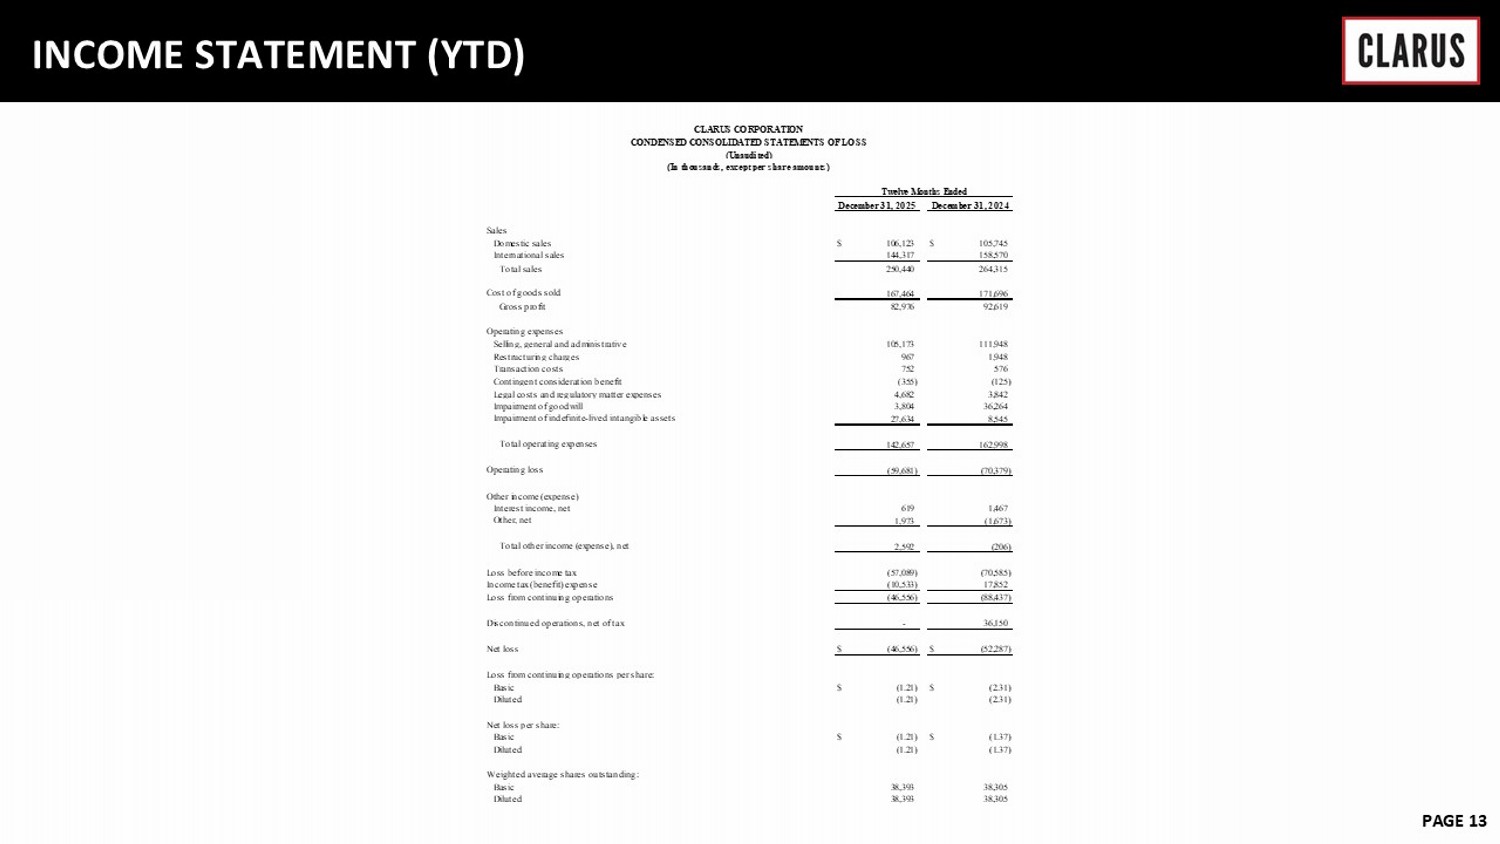
6 February 2023 PAGE 13 INCOME STATEMENT (YTD) Sales Domestic sales $ 106,123 $ 105,745 International sales 144,317 158,570 Total sales 250,440 264,315 Cost of goods sold 167,464 171,696 Gross profit 82,976 92,619 Operating expenses Selling, general and administrative 105,173 111,948 Restructuring charges 967 1,948 Transaction costs 752 576 Contingent consideration benefit (355) (125) Legal costs and regulatory matter expenses 4,682 3,842 Impairment of goodwill 3,804 36,264 Impairment of indefinite-lived intangible assets 27,634 8,545 Total operating expenses 142,657 162,998 Operating loss (59,681) (70,379) Other income (expense) Interest income, net 619 1,467 Other, net 1,973 (1,673) Total other income (expense), net 2,592 (206) Loss before income tax (57,089) (70,585) Income tax (benefit) expense (10,533) 17,852 Loss from continuing operations (46,556) (88,437) Discontinued operations, net of tax - 36,150 Net loss $ (46,556) $ (52,287) Loss from continuing operations per share: Basic $ (1.21) $ (2.31) Diluted (1.21) (2.31) Net loss per share: Basic $ (1.21) $ (1.37) Diluted (1.21) (1.37) Weighted average shares outstanding: Basic 38,393 38,305 Diluted 38,393 38,305 December 31, 2025 December 31, 2024 CLARUS CORPORATION CONDENSED CONSOLIDATED STATEMENTS OF LOSS (Unaudited) (In thousands, except per share amounts) Twelve Months Ended
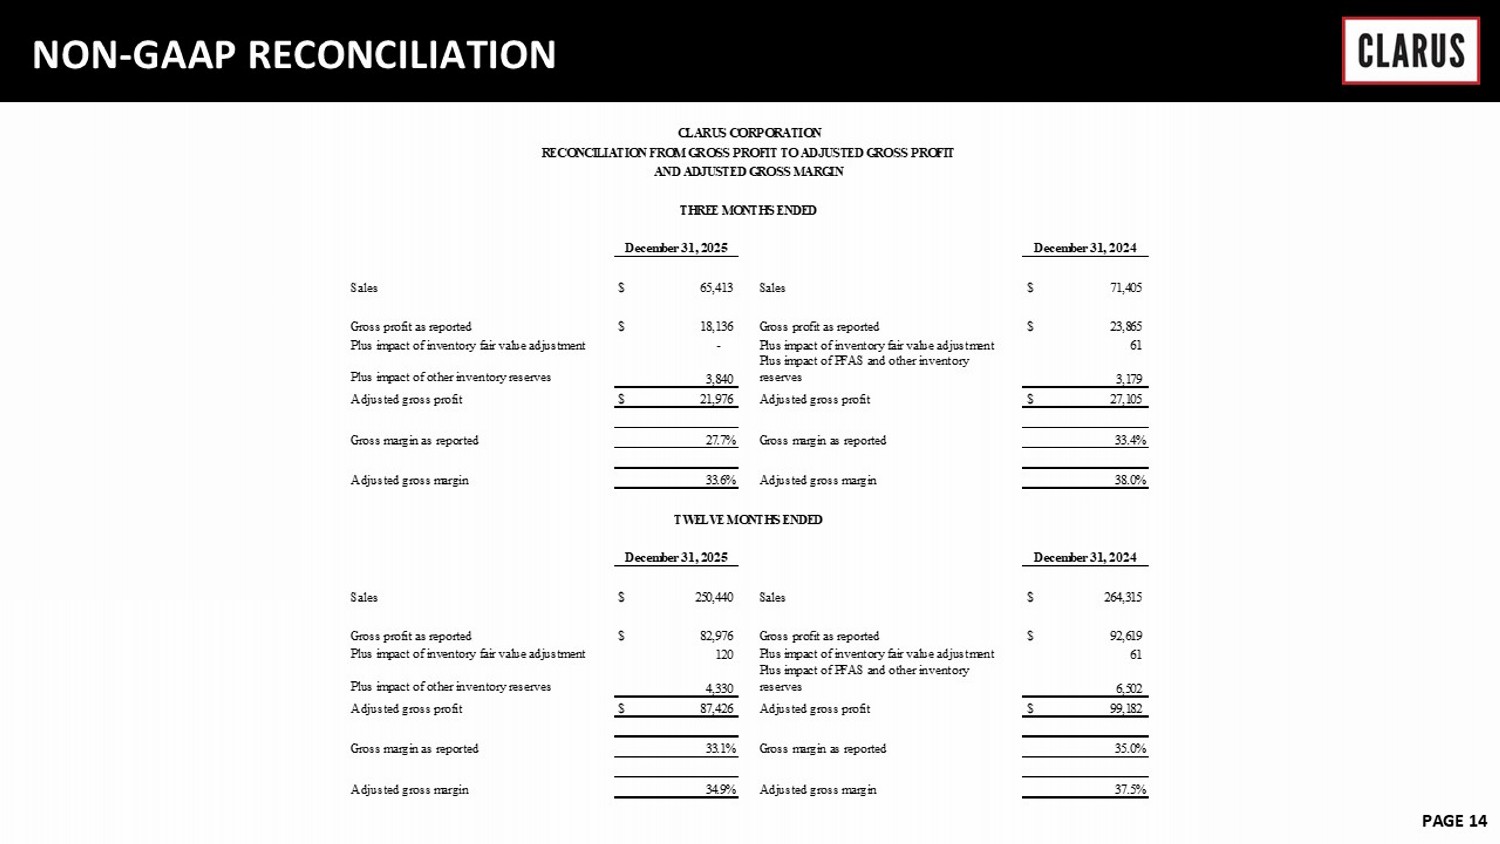
6 February 2023 PAGE 14 NON - GAAP RECONCILIATION Sales $ 65,413 Sales $ 71,405 Gross profit as reported $ 18,136 Gross profit as reported $ 23,865 Plus impact of inventory fair value adjustment - Plus impact of inventory fair value adjustment 61 Plus impact of other inventory reserves 3,840 Plus impact of PFAS and other inventory reserves 3,179 Adjusted gross profit $ 21,976 Adjusted gross profit $ 27,105 Gross margin as reported 27.7% Gross margin as reported 33.4% Adjusted gross margin 33.6% Adjusted gross margin 38.0% Sales $ 250,440 Sales $ 264,315 Gross profit as reported $ 82,976 Gross profit as reported $ 92,619 Plus impact of inventory fair value adjustment 120 Plus impact of inventory fair value adjustment 61 Plus impact of other inventory reserves 4,330 Plus impact of PFAS and other inventory reserves 6,502 Adjusted gross profit $ 87,426 Adjusted gross profit $ 99,182 Gross margin as reported 33.1% Gross margin as reported 35.0% Adjusted gross margin 34.9% Adjusted gross margin 37.5% TWELVE MONTHS ENDED December 31, 2025 December 31, 2024 CLARUS CORPORATION RECONCILIATION FROM GROSS PROFIT TO ADJUSTED GROSS PROFIT AND ADJUSTED GROSS MARGIN THREE MONTHS ENDED December 31, 2025 December 31, 2024

6 February 2023 PAGE 15 NON - GAAP RECONCILIATION (Q4) As reported $ 65,413 $ 18,136 $ 57,128 $ (6,656) (17.6) % $ (31,261) $ (0.81) Amortization of intangibles - - (2,154) 122 2,032 Impairment of goodwill - - (3,804) 576 3,228 Impairment of indefinite-lived intangible assets - - (26,069) 8,181 17,888 Disposal of internally developed software - - (222) - 222 Restructuring charges - - (478) 55 423 Transaction costs - - (66) 163 (97) Other inventory reserves - 3,840 - 1,072 2,768 Legal costs and regulatory matter expenses - - (1,219) 986 233 Stock-based compensation - - (1,327) 392 935 Valuation allowance - - - (7,292) 7,292 As adjusted $ 65,413 $ 21,976 $ 21,789 $ (2,376) (188.3) % $ 3,638 $ 0.09 As reported $ 71,405 $ 23,865 $ 73,975 $ 21,142 40.5 % $ (73,325) $ (1.92) Amortization of intangibles - - (2,468) 1,240 1,228 Impairment of goodwill - - (36,264) - 36,264 Impairment of indefinite-lived intangible assets - - (8,545) 2,564 5,981 Restructuring charges - - (939) 251 688 Transaction costs - - (408) 87 321 Inventory fair value of purchase accounting - 61 - 13 48 PFAS and other inventory reserves - 3,179 - 766 2,413 Legal costs and regulatory matter expenses - - (47) 23 24 Stock-based compensation - - (1,570) (588) 2,158 Valuation allowance - - - (21,038) 21,038 As adjusted $ 71,405 $ 27,105 $ 23,734 $ 4,460 343.6 % $ (3,162) $ (0.08) CLARUS CORPORATION RECONCILIATION FROM LOSS FROM CONTINUING OPERATIONS TO ADJUSTED INCOME (LOSS) FROM CONTINUING OPERATIONS AND RELATED EARNINGS PER DILUTED SHARE (In thousands, except per share amounts) Three Months Ended December 31, 2025 Total Gross Operating Income tax Tax (Loss) income from Diluted sales profit expenses (benefit) expense rate continuing operations EPS (1) (1) Potentially dilutive securities are excluded from the computation of diluted earnings (loss) per share if their effect is anti-dilutive to the loss from continuing operations. Reported loss from continuing operations per share is calculated based on 38,402 basic and diluted weighted average shares of common stock. Adjusted income from continuing operations per share is calculated based on 38,452 diluted shares of common stock. Three Months Ended December 31, 2024 Total Gross Operating Income tax continuing operations EPS (1) (1) Potentially dilutive securities are excluded from the computation of diluted earnings (loss) per share if their effect is anti-dilutive to the loss from continuing operations. Reported loss from continuing operations per share and adjusted loss from continuing operations per share are both calculated based on 38,262 basic and diluted weighted average shares of common stock. Tax (Loss) income from Diluted sales profit expenses (benefit) expense rate
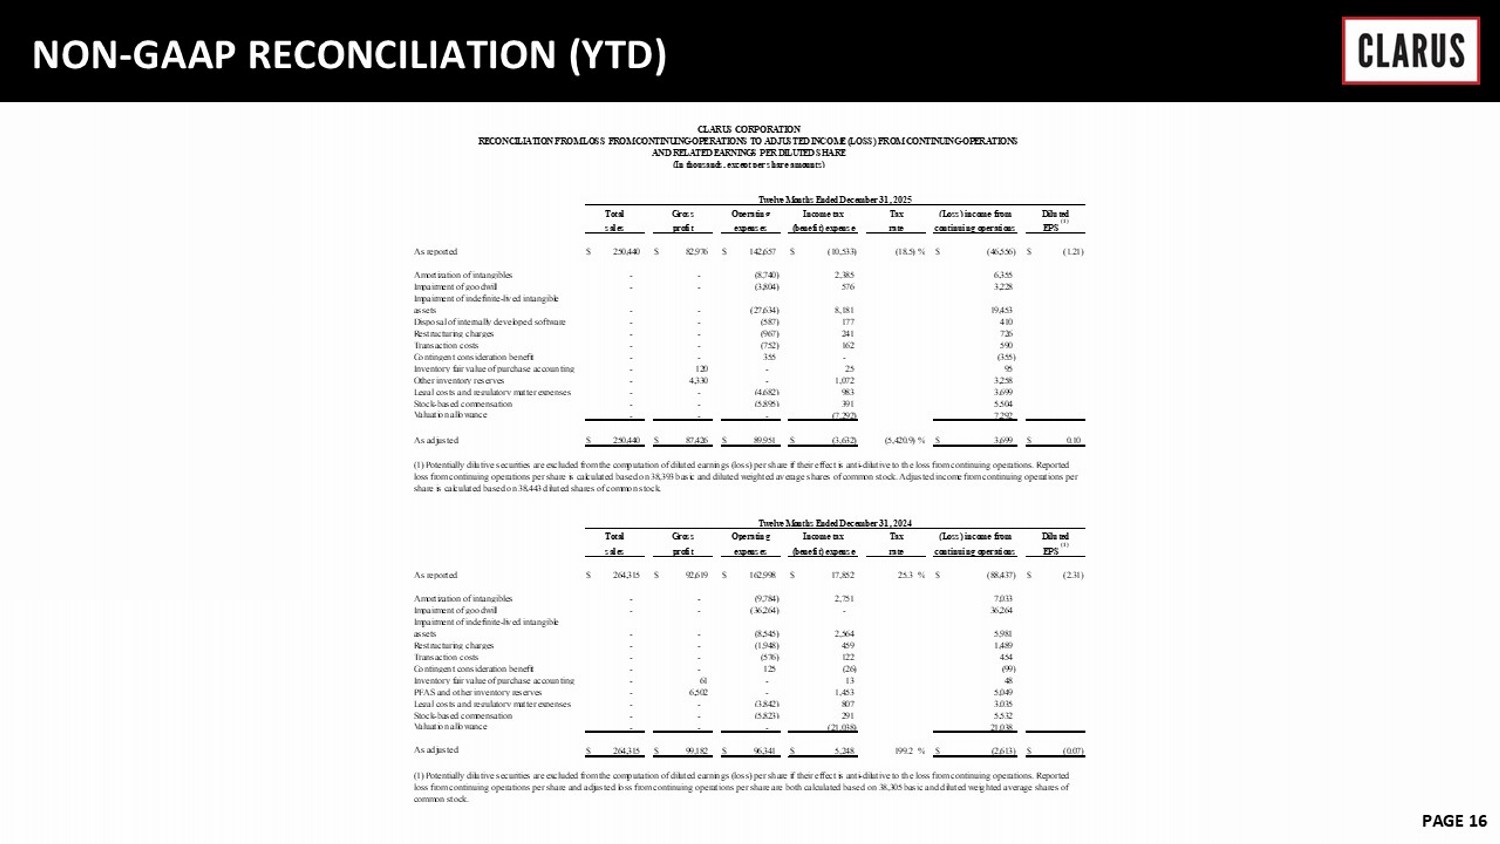
6 February 2023 PAGE 16 NON - GAAP RECONCILIATION (YTD) As reported $ 250,440 $ 82,976 $ 142,657 $ (10,533) (18.5) % $ (46,556) $ (1.21) Amortization of intangibles - - (8,740) 2,385 6,355 Impairment of goodwill - - (3,804) 576 3,228 Impairment of indefinite-lived intangible assets - - (27,634) 8,181 19,453 Disposal of internally developed software - - (587) 177 410 Restructuring charges - - (967) 241 726 Transaction costs - - (752) 162 590 Contingent consideration benefit - - 355 - (355) Inventory fair value of purchase accounting - 120 - 25 95 Other inventory reserves - 4,330 - 1,072 3,258 Legal costs and regulatory matter expenses - - (4,682) 983 3,699 Stock-based compensation - - (5,895) 391 5,504 Valuation allowance - - - (7,292) 7,292 As adjusted $ 250,440 $ 87,426 $ 89,951 $ (3,632) (5,420.9) % $ 3,699 $ 0.10 As reported $ 264,315 $ 92,619 $ 162,998 $ 17,852 25.3 % $ (88,437) $ (2.31) Amortization of intangibles - - (9,784) 2,751 7,033 Impairment of goodwill - - (36,264) - 36,264 Impairment of indefinite-lived intangible assets - - (8,545) 2,564 5,981 Restructuring charges - - (1,948) 459 1,489 Transaction costs - - (576) 122 454 Contingent consideration benefit - - 125 (26) (99) Inventory fair value of purchase accounting - 61 - 13 48 PFAS and other inventory reserves - 6,502 - 1,453 5,049 Legal costs and regulatory matter expenses - - (3,842) 807 3,035 Stock-based compensation - - (5,823) 291 5,532 Valuation allowance - - - (21,038) 21,038 As adjusted $ 264,315 $ 99,182 $ 96,341 $ 5,248 199.2 % $ (2,613) $ (0.07) CLARUS CORPORATION RECONCILIATION FROM LOSS FROM CONTINUING OPERATIONS TO ADJUSTED INCOME (LOSS) FROM CONTINUING OPERATIONS AND RELATED EARNINGS PER DILUTED SHARE (In thousands, except per share amounts) Twelve Months Ended December 31, 2025 Total Gross Operating Income tax Tax (Loss) income from Diluted sales profit expenses (benefit) expense rate continuing operations EPS (1) (1) Potentially dilutive securities are excluded from the computation of diluted earnings (loss) per share if their effect is anti-dilutive to the loss from continuing operations. Reported loss from continuing operations per share is calculated based on 38,393 basic and diluted weighted average shares of common stock. Adjusted income from continuing operations per share is calculated based on 38,443 diluted shares of common stock. Twelve Months Ended December 31, 2024 Total Gross Operating Income tax continuing operations EPS (1) (1) Potentially dilutive securities are excluded from the computation of diluted earnings (loss) per share if their effect is anti-dilutive to the loss from continuing operations. Reported loss from continuing operations per share and adjusted loss from continuing operations per share are both calculated based on 38,305 basic and diluted weighted average shares of common stock. Tax (Loss) income from Diluted sales profit expenses (benefit) expense rate
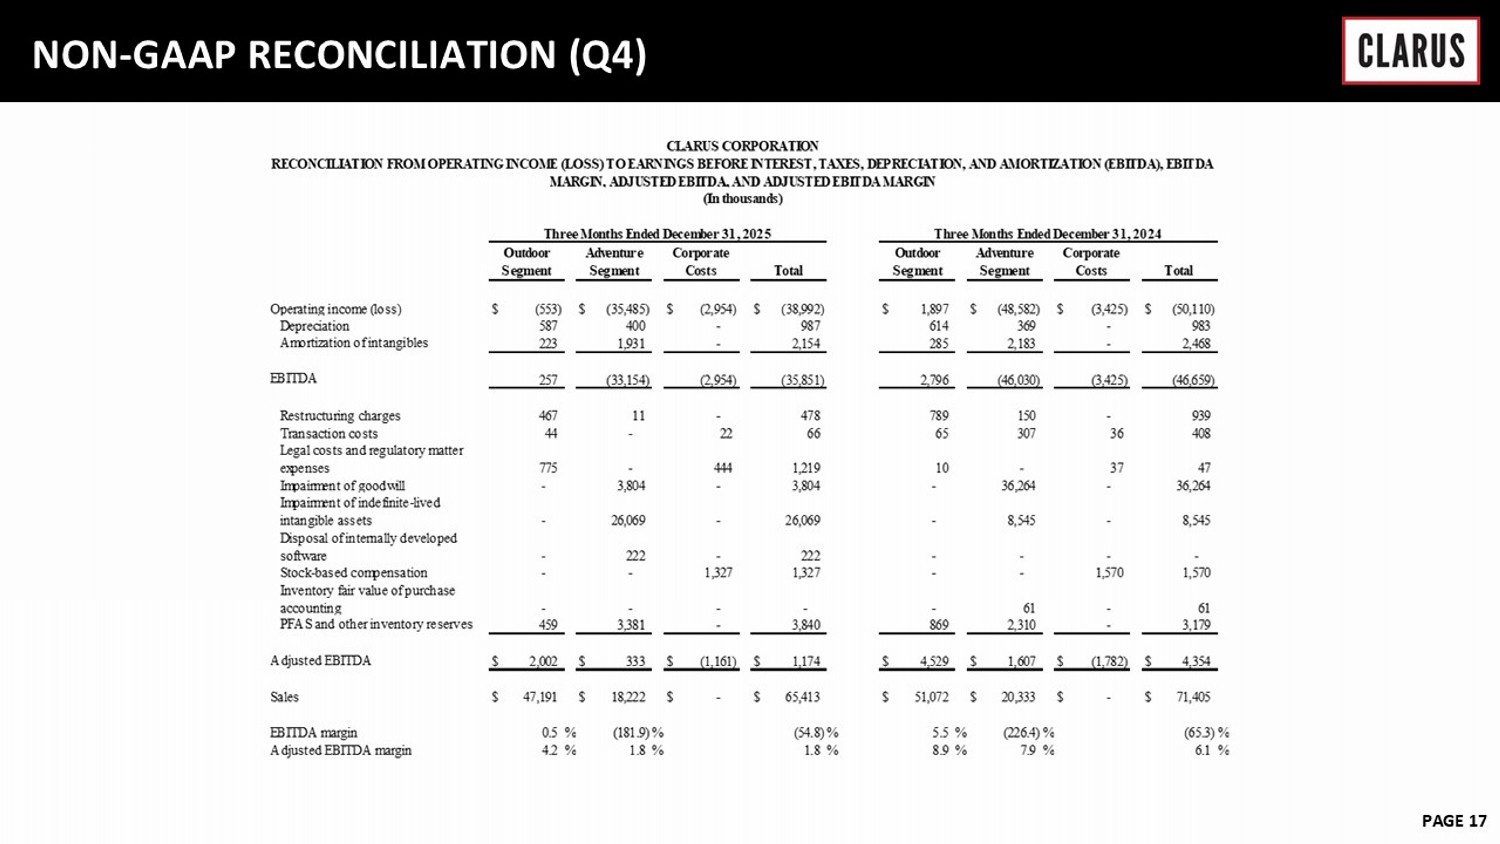
6 February 2023 PAGE 17 NON - GAAP RECONCILIATION (Q4)
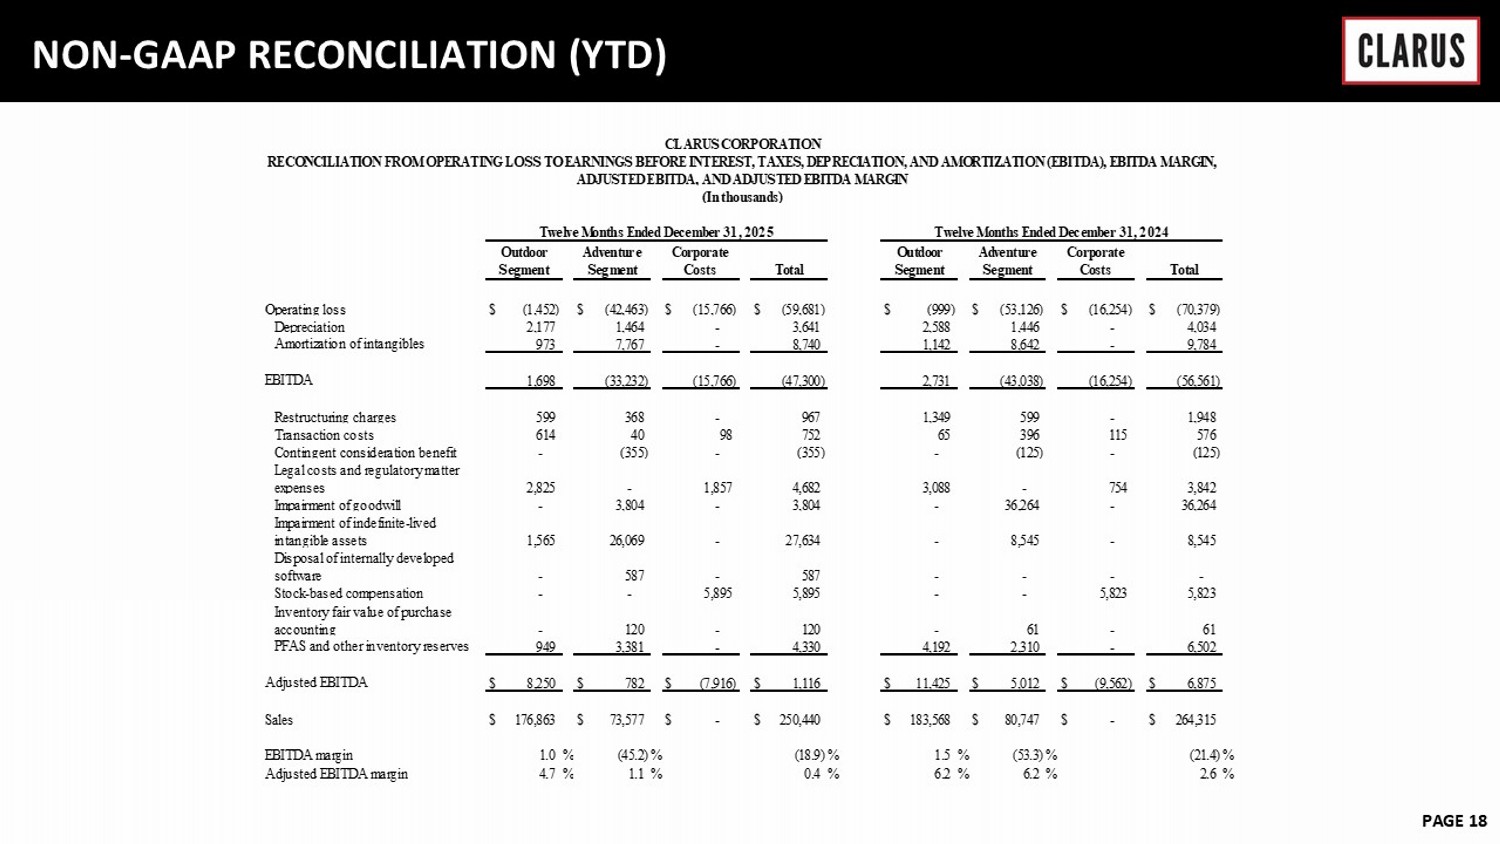
6 February 2023 PAGE 18 NON - GAAP RECONCILIATION (YTD) Operating loss $ (1,452) $ (42,463) $ (15,766) $ (59,681) $ (999) $ (53,126) $ (16,254) $ (70,379) Depreciation 2,177 1,464 - 3,641 2,588 1,446 - 4,034 Amortization of intangibles 973 7,767 - 8,740 1,142 8,642 - 9,784 EBITDA 1,698 (33,232) (15,766) (47,300) 2,731 (43,038) (16,254) (56,561) Restructuring charges 599 368 - 967 1,349 599 - 1,948 Transaction costs 614 40 98 752 65 396 115 576 Contingent consideration benefit - (355) - (355) - (125) - (125) Legal costs and regulatory matter expenses 2,825 - 1,857 4,682 3,088 - 754 3,842 Impairment of goodwill - 3,804 - 3,804 - 36,264 - 36,264 Impairment of indefinite-lived intangible assets 1,565 26,069 - 27,634 - 8,545 - 8,545 Disposal of internally developed software - 587 - 587 - - - - Stock-based compensation - - 5,895 5,895 - - 5,823 5,823 Inventory fair value of purchase accounting - 120 - 120 - 61 - 61 PFAS and other inventory reserves 949 3,381 - 4,330 4,192 2,310 - 6,502 Adjusted EBITDA $ 8,250 $ 782 $ (7,916) $ 1,116 $ 11,425 $ 5,012 $ (9,562) $ 6,875 Sales $ 176,863 $ 73,577 $ - $ 250,440 $ 183,568 $ 80,747 $ - $ 264,315 EBITDA margin 1.0 % (45.2) % (18.9) % 1.5 % (53.3) % (21.4) % Adjusted EBITDA margin 4.7 % 1.1 % 0.4 % 6.2 % 6.2 % 2.6 % Adventure Segment Corporate Costs Total CLARUS CORPORATION RECONCILIATION FROM OPERATING LOSS TO EARNINGS BEFORE INTEREST, TAXES, DEPRECIATION, AND AMORTIZATION (EBITDA), EBITDA MARGIN, ADJUSTED EBITDA, AND ADJUSTED EBITDA MARGIN (In thousands) Twelve Months Ended December 31, 2025 Twelve Months Ended December 31, 2024 Outdoor Segment Adventure Segment Corporate Costs Total Outdoor Segment