
Exhibit 99.2
Q1 EARNINGS PRESENTATION MAY 7, 2026
6 February 2023 PAGE 2 Forward - Looking Statements Please note that in this presentation we may use words such as “appears,” “anticipates,” “believes,” “plans,” “expects,” “int end s,” “future,” and similar expressions which constitute forward - looking statements within the meaning of the safe harbor provisions of the Private Securities Litigation Reform Act of 1995. Forward - looking statem ents are made based on our expectations and beliefs concerning future events impacting the Company and therefore involve a number of risks and uncertainties. We caution that forward - looking statements are not guarantees and that actual results could differ materially from those expressed or implied in the forward - looking statements. Potential risks and uncertainties that could cause the actual results of operations or financial condition of the Company to differ materially from those expressed or implied by forward - looking statements in this presentation, include, but are not limited to, risks and uncertaintie s related to the Company’s review of strategic alternatives, including the timing and outcome of the review, whether the review results in any transaction or other strategic outcome, and the potential impact of the review on the Company’s business and operations, as well as those risks and uncertainties more fully described from time to time in the Company's public reports filed with the Securities and Exchange C omm ission, including under the section titled “Risk Factors” in the Company's Annual Report on Form 10 - K, and/or Quarterly Reports on Form 10 - Q, as well as in the Company’s Current Reports on Form 8 - K. All forward - looking statements included in this presentation are based upon information available to the Company as of the date of this presentation and speak only as of the date hereof. We assume no obligation to up date any forward - looking statements to reflect events or circumstances after the date of this presentation. Non - GAAP Financial Measures The Company reports its financial results in accordance with U.S. generally accepted accounting principles (“GAAP”). This pre sen tation contains the non - GAAP measures: ( i ) adjusted gross margin and adjusted gross profit, (ii) adjusted net income (loss) and related earnings (loss) per diluted share, (iii) earnings before interest, tax es, other income or expense, depreciation and amortization (“EBITDA”), EBITDA margin, adjusted EBITDA, and adjusted EBITDA margin, and (iv) free cash flow (defined as net cash provided by operating activities le ss capital expenditures). The Company believes that the presentation of certain non - GAAP measures, i.e.: ( i ) adjusted gross margin and adjusted gross profit, (ii) adjusted net income (loss) and related earnings (loss) per diluted sh are , (iii) EBITDA, EBITDA margin, adjusted EBITDA and adjusted EBITDA margin, and (iv) free cash flow, provide useful information for the understanding of its ongoing operations and enable s i nvestors to focus on period - over - period operating performance, and thereby enhances the user's overall understanding of the Company's current financial performance relative to past performance and pro vid es, along with the nearest GAAP measures, a baseline for modeling future earnings expectations. Non - GAAP measures are reconciled to comparable GAAP financial measures within this presentation. We do no t provide a reconciliation of the non - GAAP guidance measures adjusted EBITDA and/or adjusted EBITDA margin for the fiscal year 2026 to net income for the fiscal year 2026, the most comparable GAA P f inancial measure, due to the inherent difficulty of forecasting certain types of expenses and gains, without unreasonable effort, which affect net income but not adjusted EBITDA and/or adjusted EBITDA margi n. The Company cautions that non - GAAP measures should be considered in addition to, but not as a substitute for, the Company's reported GAAP results. Additionally, the Company notes that there can be no assurance that the above referenced non - GAAP financial measures are comparable to similarly titled financial measures used by other publicly traded companies. Market and Industry Data The market and industry data used throughout this presentation was obtained from various sources, including the Company’s own re search and estimates, surveys or studies conducted by third parties and industry or general publications and forecasts. Industry publications, surveys and forecasts generally state that they have o bta ined information from sources believed to be reliable, but there can be no assurance as to the accuracy and completeness of such information. While the Company believes that each of these surveys, studies, publ ica tions and forecasts is reliable, it has not independently verified such data and the Company is not making any representation as to the accuracy of such information. Similarly, the Company believes its internal re search and estimates are reliable but it has not been verified by any independent sources. In addition, while the Company believes that the industry and market information included herein is generally reliab le, such information is inherently imprecise. While the Company is not aware of any misstatements regarding the industry and market data presented herein, its estimates involve risks and uncertainties and are sub ject to change based on various factors, including those discussed under the heading “Forward - Looking Statements” above. DISCLAIMER

Warren Kanders EXECUTIVE CHAIRMAN Clarus TODAY’S PRESENTERS Mike Yates CFO Clarus Neil Fiske PRESIDENT Black Diamond Equipment
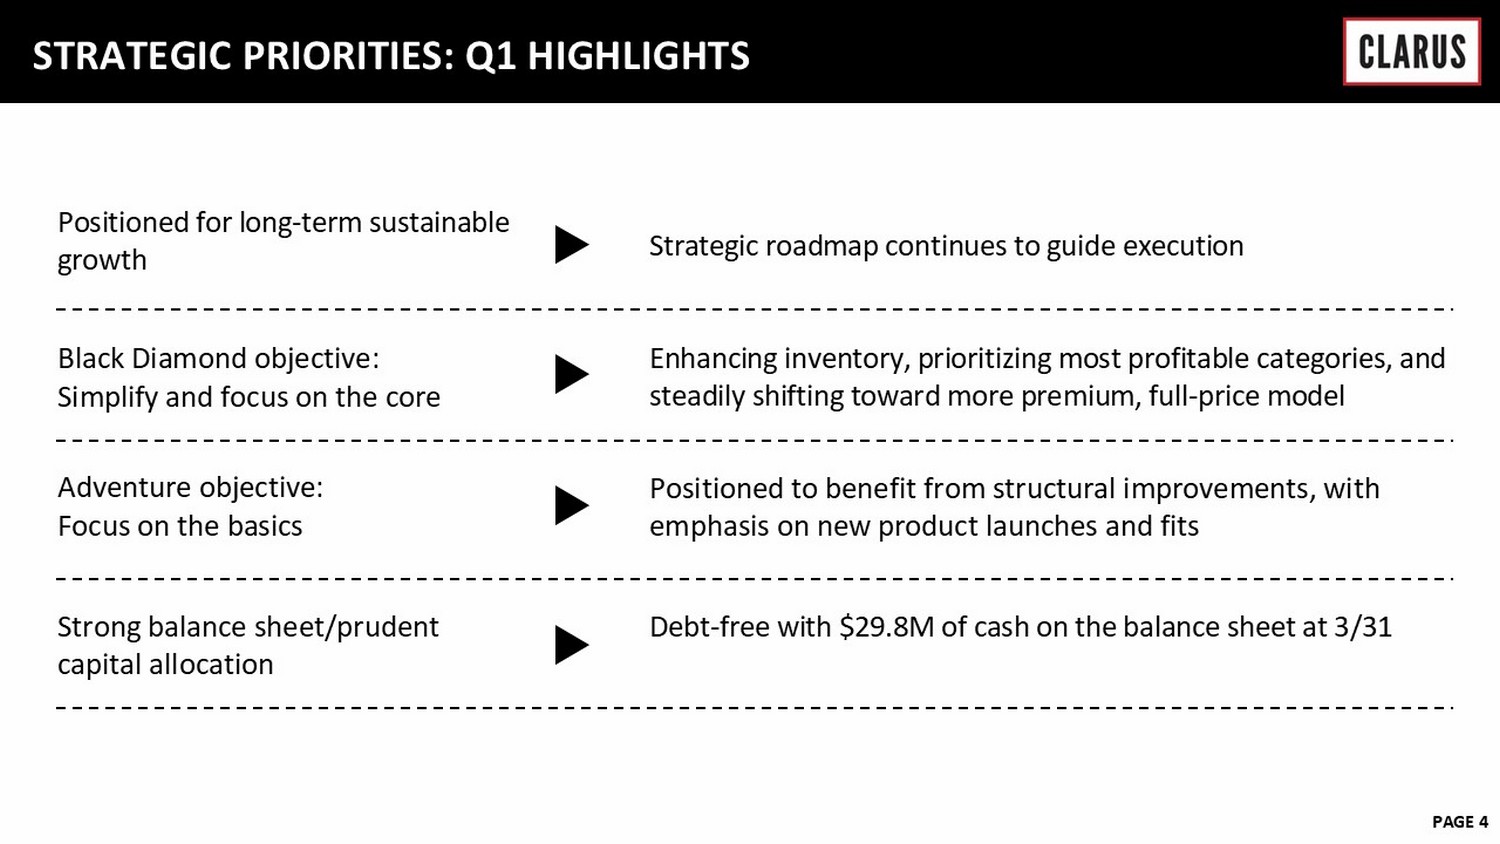
6 February 2023 PAGE 4 STRATEGIC PRIORITIES: Q1 HIGHLIGHTS Positioned for long - term sustainable growth Strategic roadmap continues to guide execution Black Diamond objective : Simplify and focus on the core Enhancing inventory, prioritizing most profitable categories, and steadily shifting toward more premium, full - price model Adventure objective: Focus on the basics Positioned to benefit from structural improvements, with emphasis on new product launches and fits Strong balance sheet/prudent capital allocation Debt - free with $29.8M of cash on the balance sheet at 3/31
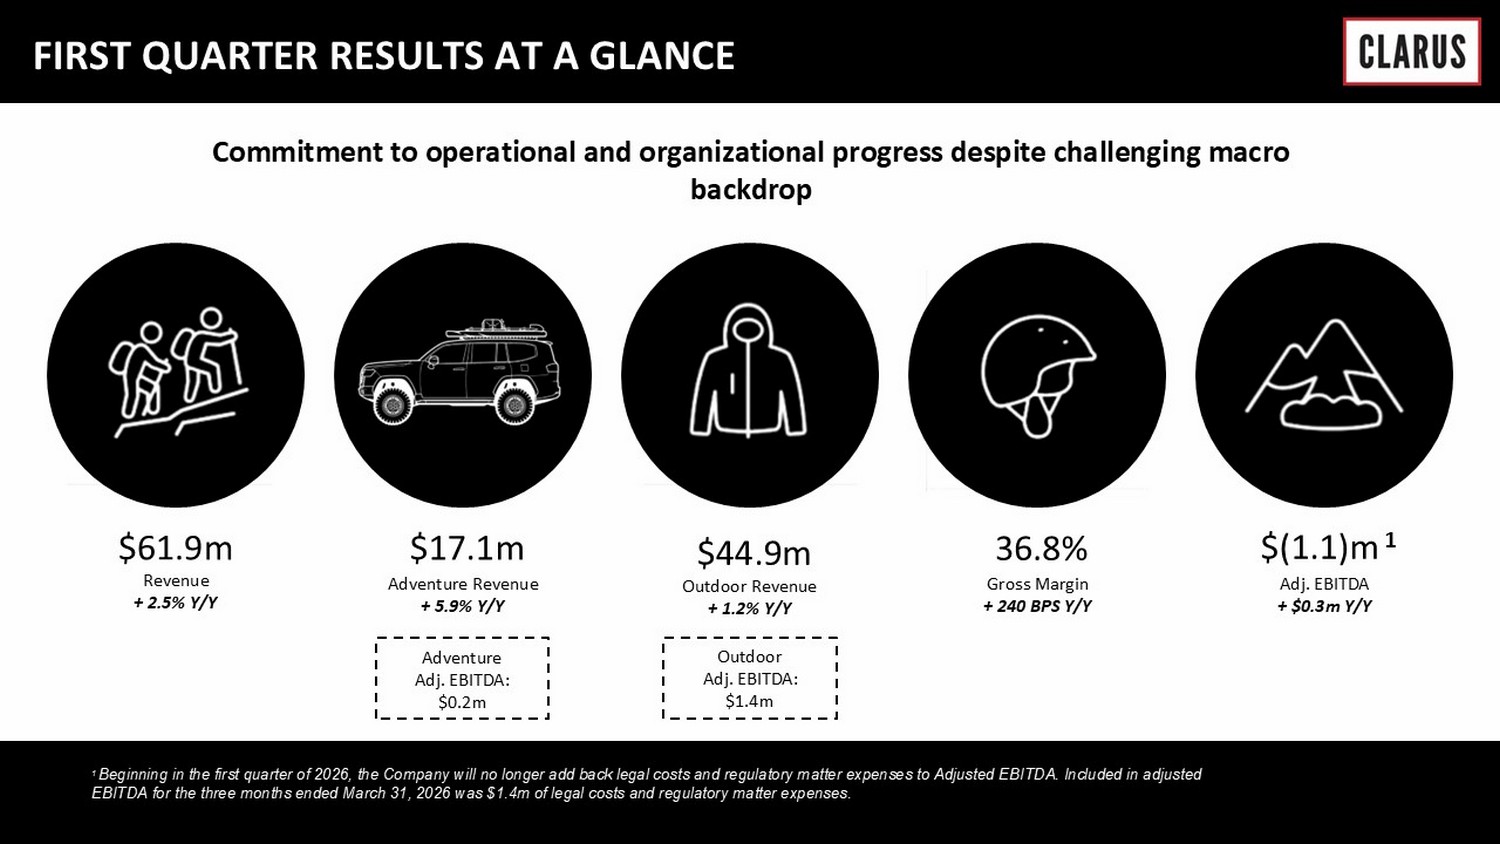
Commitment to operational and organizational progress despite challenging macro backdrop $ 61.9m $ 17.1m $44.9 m 36.8 % $ (1.1)m 1 Revenue + 2.5% Y/Y Adventure Revenue + 5.9% Y/Y Outdoor Revenue + 1.2% Y/Y Gross Margin + 240 BPS Y/Y Adj. EBITDA + $0.3m Y/Y FIRST QUARTER RESULTS AT A GLANCE Adventure Adj. EBITDA: $0.2m Outdoor Adj. EBITDA: $1.4m 1 Beginning in the first quarter of 2026, the Company will no longer add back legal costs and regulatory matter expenses to Adj ust ed EBITDA. Included in adjusted EBITDA for the three months ended March 31, 2026 was $1.4m of legal costs and regulatory matter expenses.
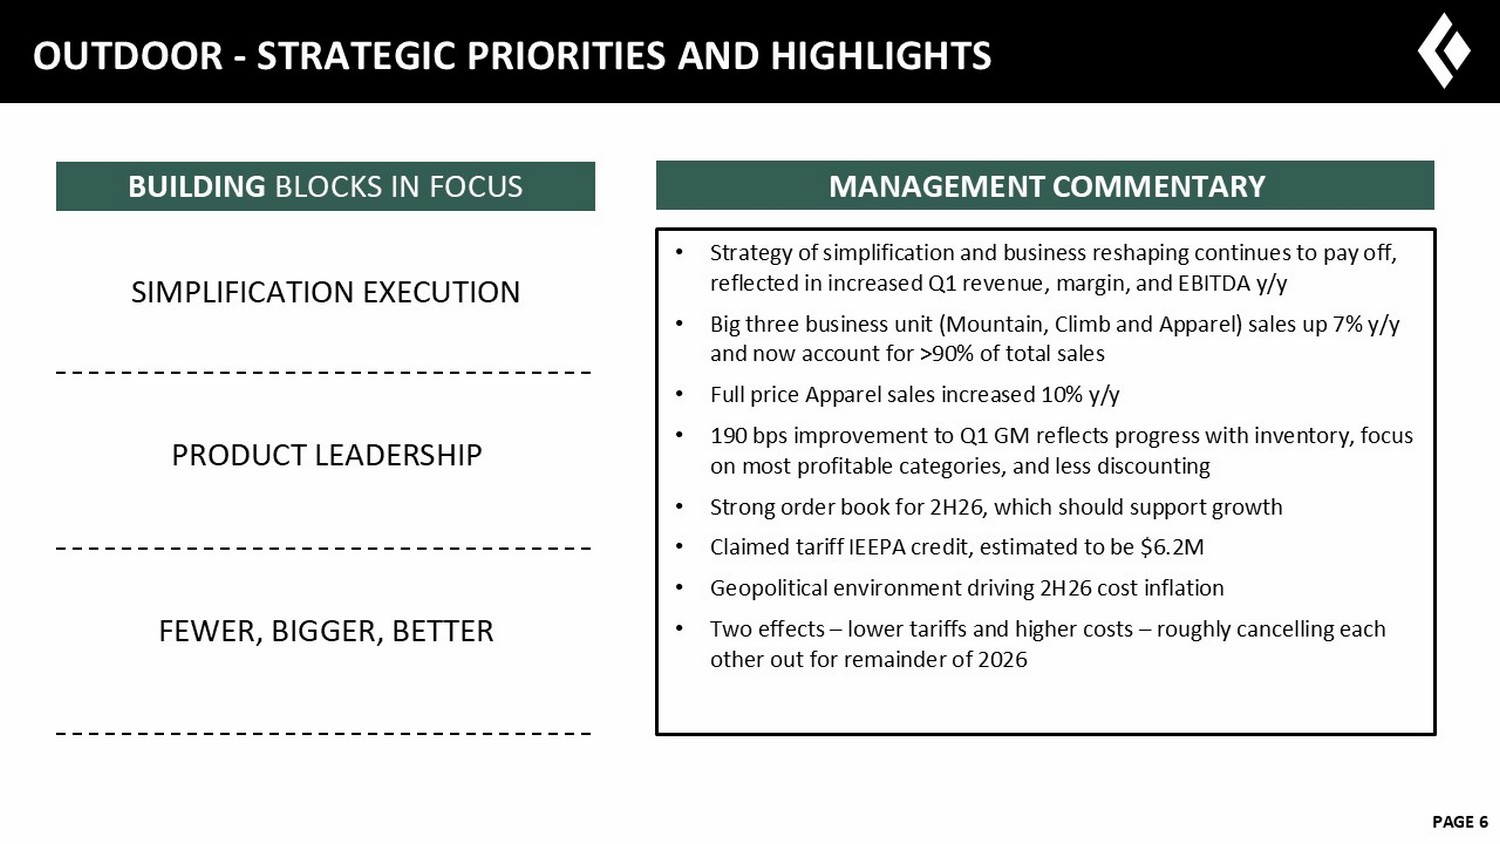
6 February 2023 PAGE 6 OUTDOOR - STRATEGIC PRIORITIES AND HIGHLIGHTS • Strategy of simplification and business reshaping continues to pay off, reflected in increased Q1 revenue, margin, and EBITDA y/y • Big three business unit (Mountain, Climb and Apparel) sales up 7% y/y and now account for >90% of total sales • Full price Apparel sales increased 10% y/y • 190 bps improvement to Q1 GM reflects progress with inventory, focus on most profitable categories, and less discounting • Strong order book for 2H26, which should support growth • Claimed tariff IEEPA credit, estimated to be $6.2M • Geopolitical environment driving 2H26 cost inflation • Two effects – lower tariffs and higher costs – roughly cancelling each other out for remainder of 2026 MANAGEMENT COMMENTARY BUILDING BLOCKS IN FOCUS SIMPLIFICATION EXECUTION PRODUCT LEADERSHIP FEWER, BIGGER, BETTER
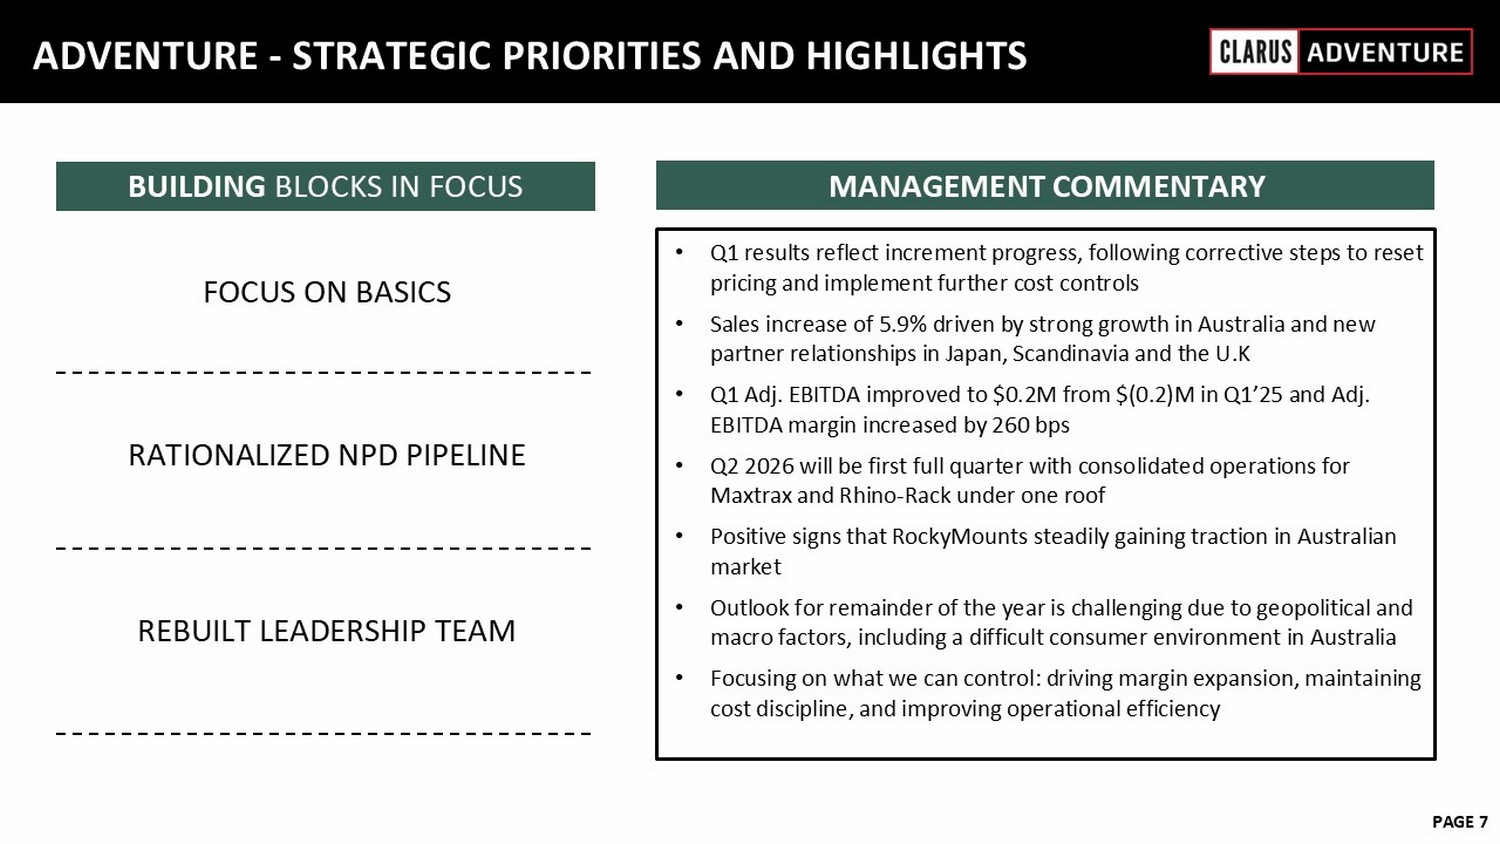
6 February 2023 PAGE 7 ADVENTURE - STRATEGIC PRIORITIES AND HIGHLIGHTS • Q1 results reflect increment progress, following corrective steps to reset pricing and implement further cost controls • Sales increase of 5.9% driven by strong growth in Australia and new partner relationships in Japan, Scandinavia and the U.K • Q1 Adj. EBITDA improved to $0.2M from $(0.2)M in Q1’25 and Adj. EBITDA margin increased by 260 bps • Q2 2026 will be first full quarter with consolidated operations for Maxtrax and Rhino - Rack under one roof • Positive signs that RockyMounts steadily gaining traction in Australian market • Outlook for remainder of the year is challenging due to geopolitical and macro factors, including a difficult consumer environment in Australia • Focusing on what we can control: driving margin expansion, maintaining cost discipline, and improving operational efficiency MANAGEMENT COMMENTARY BUILDING BLOCKS IN FOCUS FOCUS ON BASICS RATIONALIZED NPD PIPELINE REBUILT LEADERSHIP TEAM
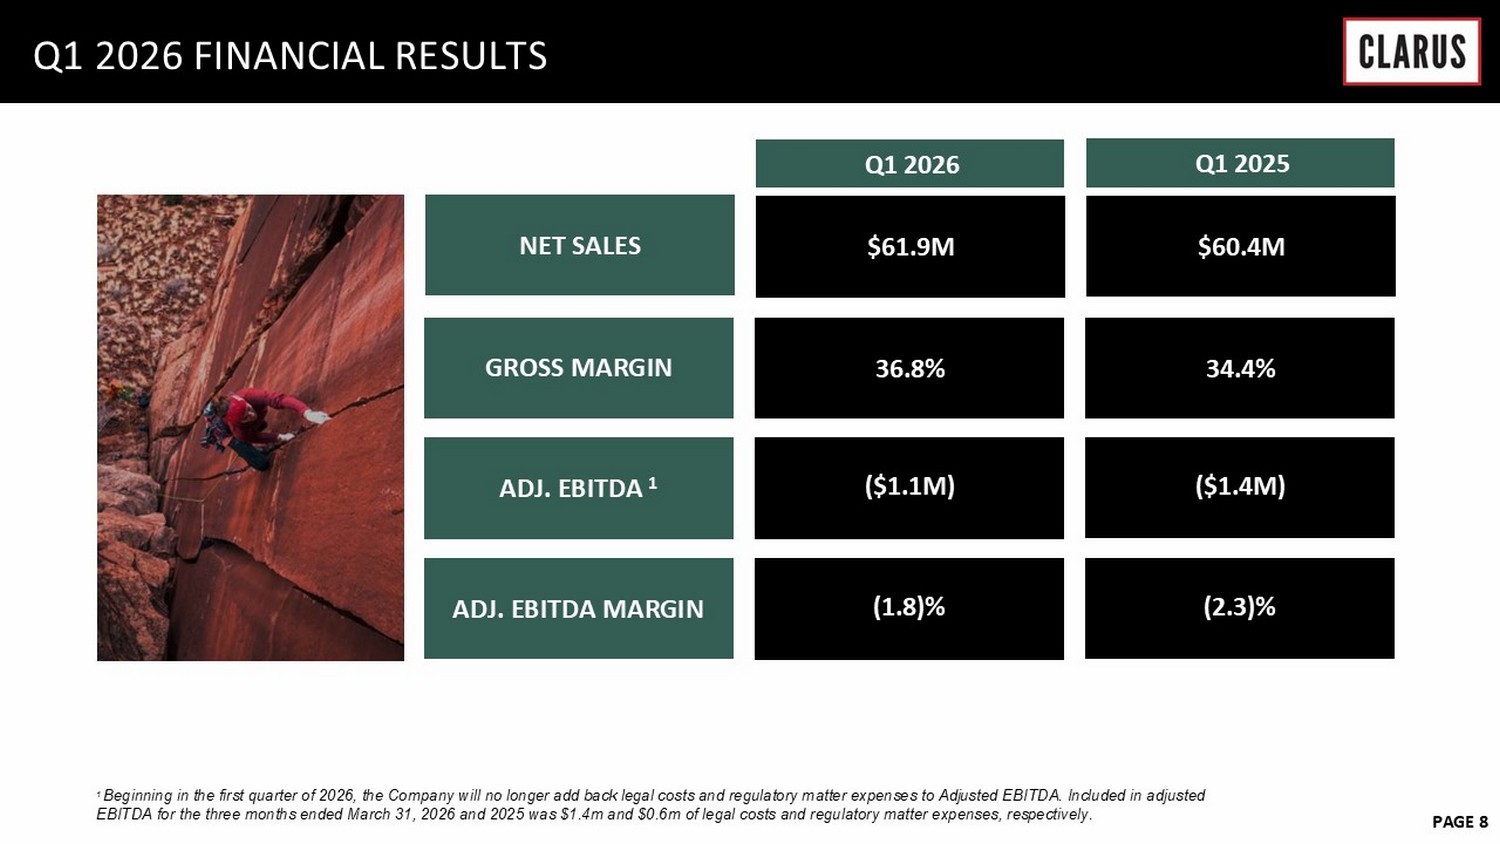
6 February 2023 PAGE 8 NET SALES Q1 2026 FINANCIAL RESULTS Q1 2026 GROSS MARGIN ADJ. EBITDA 1 ADJ. EBITDA MARGIN (1.8)% ($1.1M) 36.8% $61.9M Q1 2025 (2.3)% ($1.4M) 34. 4 % $60.4M 1 Beginning in the first quarter of 2026, the Company will no longer add back legal costs and regulatory matter expenses to Adj ust ed EBITDA. Included in adjusted EBITDA for the three months ended March 31, 2026 and 2025 was $1.4m and $0.6m of legal costs and regulatory matter expenses, res pectively.
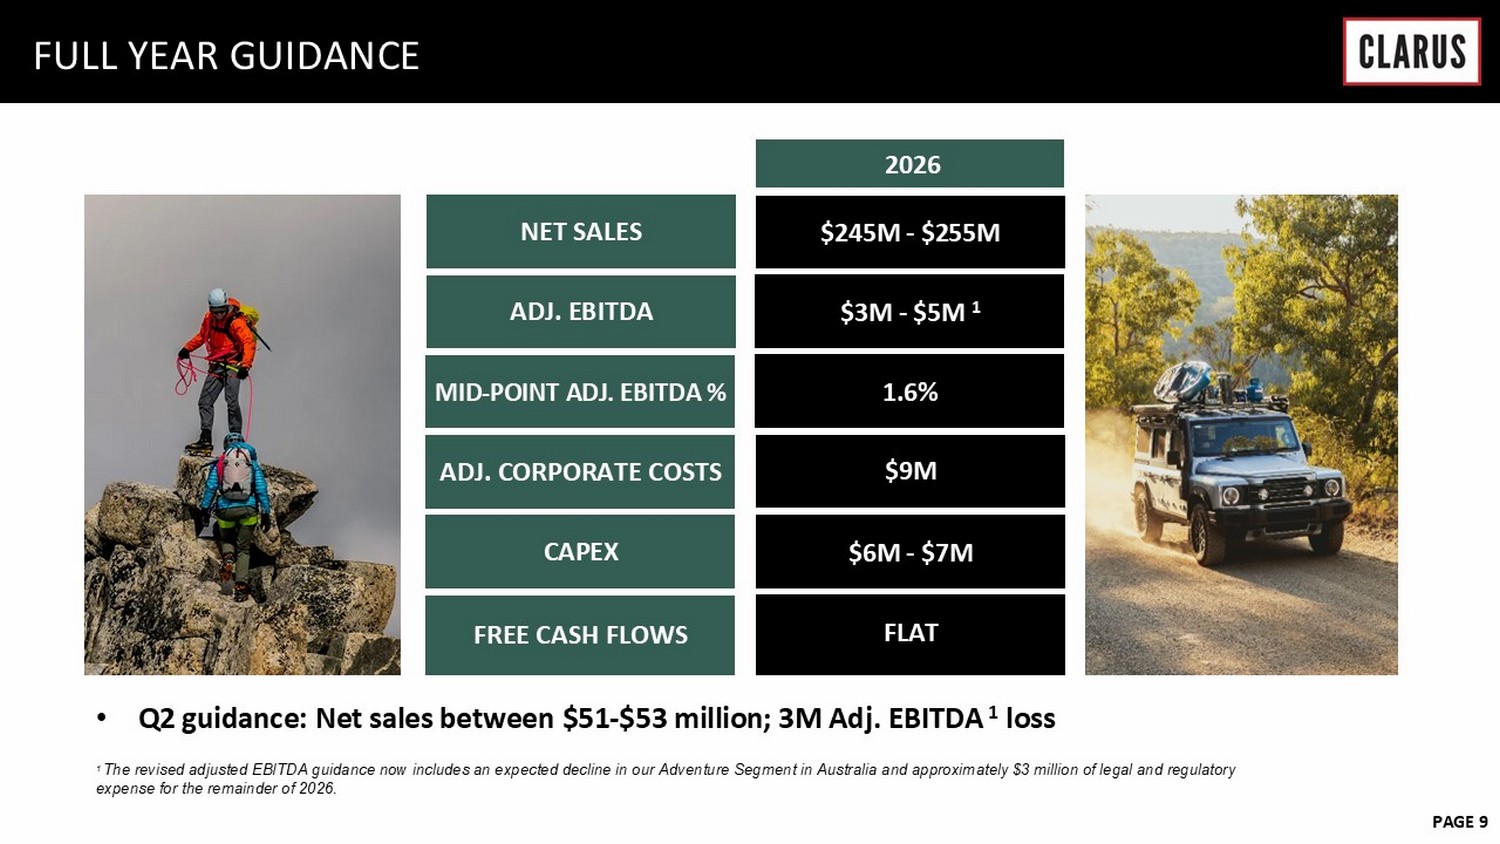
6 February 2023 PAGE 9 NET SALES FULL YEAR GUIDANCE ADJ. CORPORATE COSTS ADJ. EBITDA MID - POINT ADJ. EBITDA % CAPEX FREE CASH FLOWS $245M - $2 5 5M $6M - $7M $3M - $ 5 M 1 1.6% $9M FLAT 2026 • Q 2 guidance : Net sales between $ 51 - $ 53 million ; 3 M Adj . EBITDA 1 loss 1 The revised adjusted EBITDA guidance now includes an expected decline in our Adventure Segment in Australia and approximately $3 million of legal and regulatory expense for the remainder of 2026.

APPENDIX
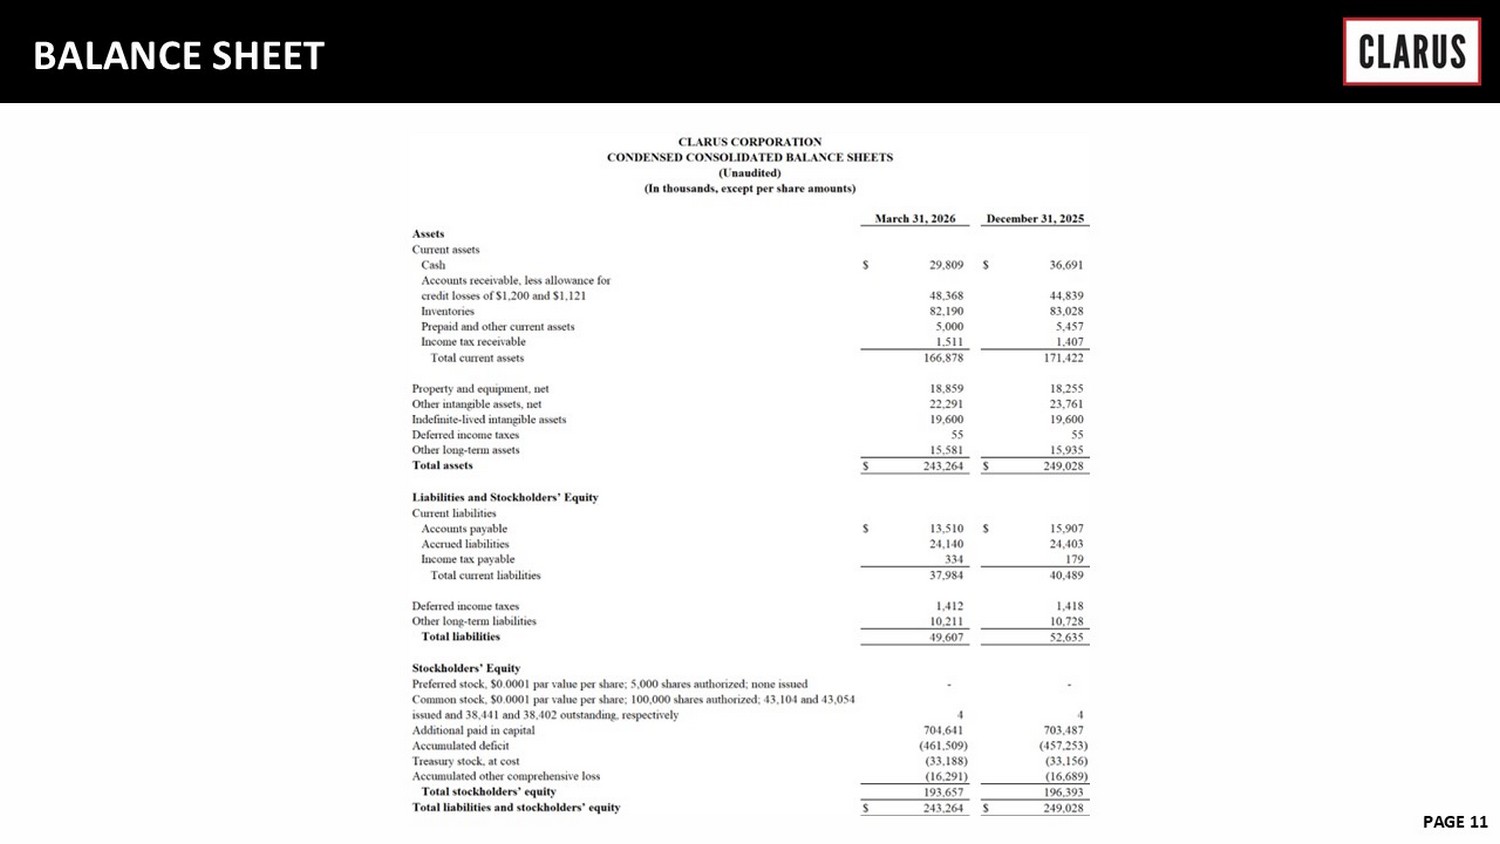
6 February 2023 PAGE 11 BALANCE SHEET
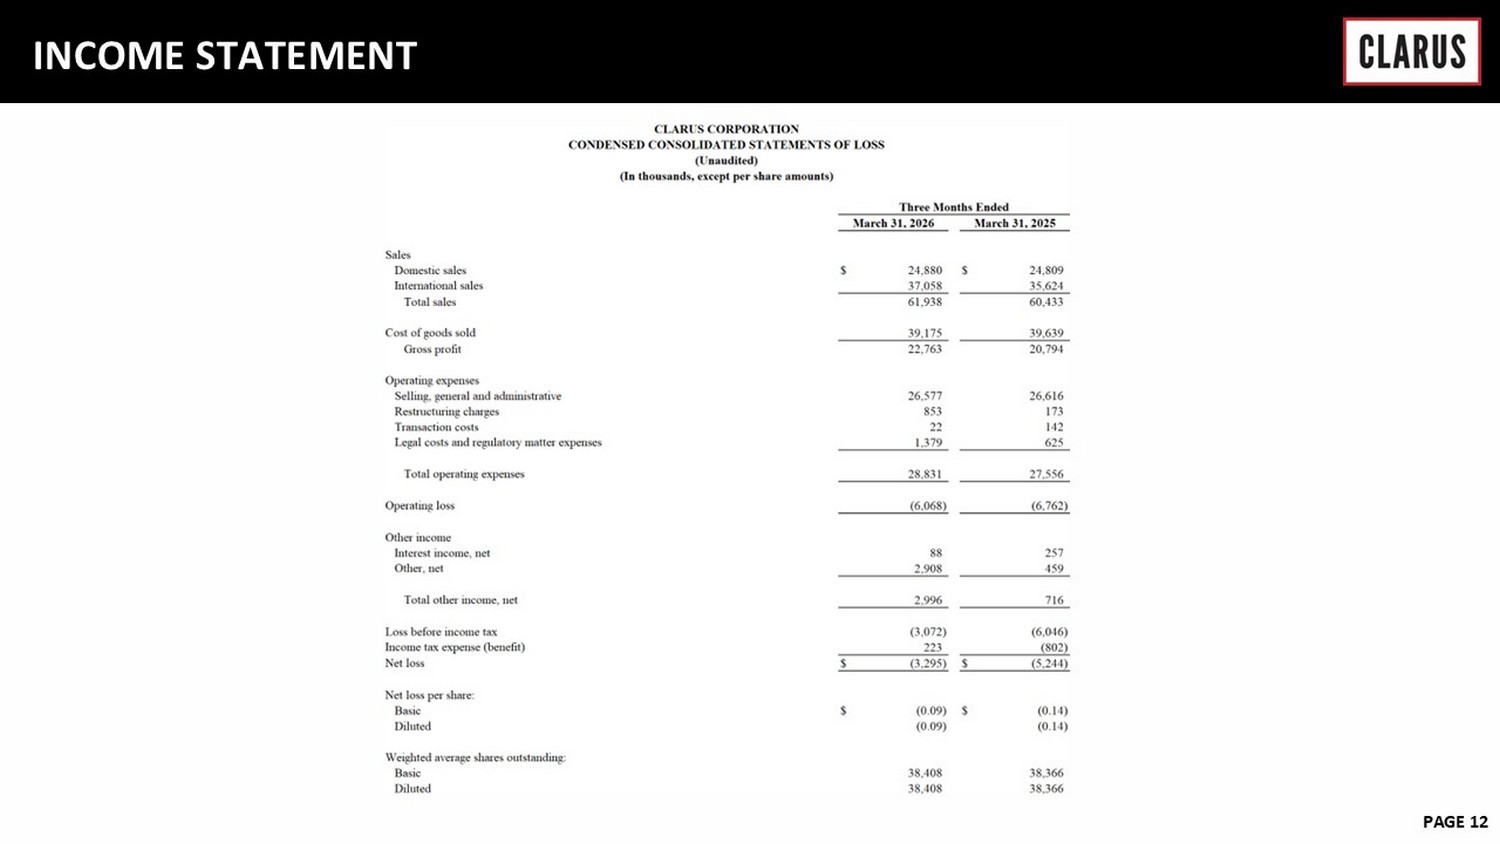
6 February 2023 PAGE 12 INCOME STATEMENT
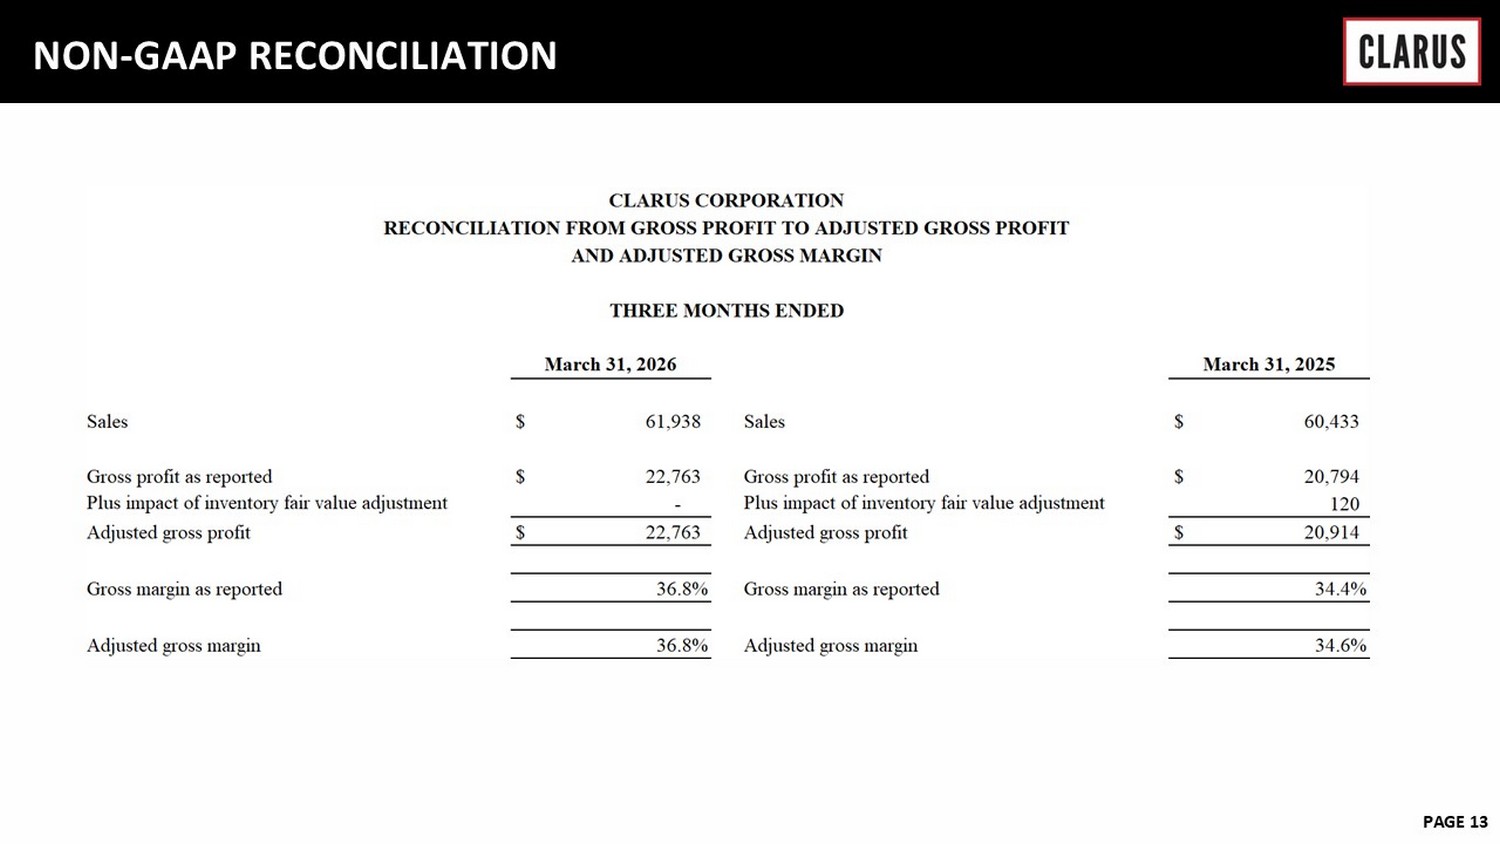
6 February 2023 PAGE 13 NON - GAAP RECONCILIATION
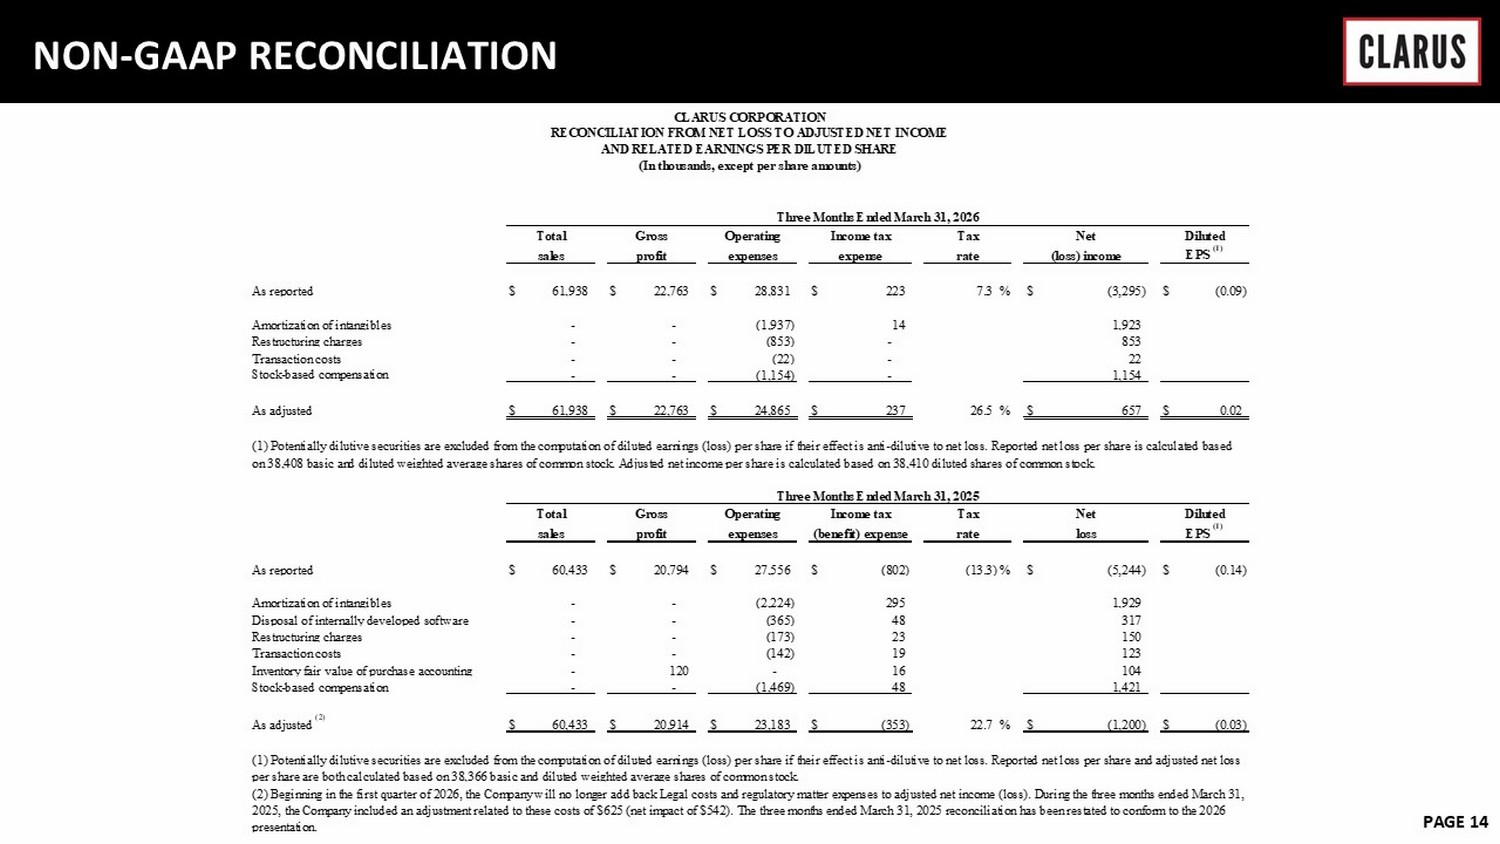
6 February 2023 PAGE 14 NON - GAAP RECONCILIATION As reported $ 61,938 $ 22,763 $ 28,831 $ 223 7.3 % $ (3,295) $ (0.09) Amortization of intangibles - - (1,937) 14 1,923 Restructuring charges - - (853) - 853 Transaction costs - - (22) - 22 Stock-based compensation - - (1,154) - 1,154 As adjusted $ 61,938 $ 22,763 $ 24,865 $ 237 26.5 % $ 657 $ 0.02 As reported $ 60,433 $ 20,794 $ 27,556 $ (802) (13.3) % $ (5,244) $ (0.14) Amortization of intangibles - - (2,224) 295 1,929 Disposal of internally developed software - - (365) 48 317 Restructuring charges - - (173) 23 150 Transaction costs - - (142) 19 123 Inventory fair value of purchase accounting - 120 - 16 104 Stock-based compensation - - (1,469) 48 1,421 As adjusted (2) $ 60,433 $ 20,914 $ 23,183 $ (353) 22.7 % $ (1,200) $ (0.03) (2) Beginning in the first quarter of 2026, the Company will no longer add back Legal costs and regulatory matter expenses to adjusted net income (loss). During the three months ended March 31, 2025, the Company included an adjustment related to these costs of $625 (net impact of $542). The three months ended March 31, 2025 reconciliation has been restated to conform to the 2026 presentation. loss EPS (1) (1) Potentially dilutive securities are excluded from the computation of diluted earnings (loss) per share if their effect is anti-dilutive to net loss. Reported net loss per share and adjusted net loss per share are both calculated based on 38,366 basic and diluted weighted average shares of common stock. Tax Net Diluted sales profit expenses (benefit) expense rate Three Months Ended March 31, 2025 Total Gross Operating Income tax expense rate (loss) income EPS (1) (1) Potentially dilutive securities are excluded from the computation of diluted earnings (loss) per share if their effect is anti-dilutive to net loss. Reported net loss per share is calculated based on 38,408 basic and diluted weighted average shares of common stock. Adjusted net income per share is calculated based on 38,410 diluted shares of common stock. sales profit expenses CLARUS CORPORATION RECONCILIATION FROM NET LOSS TO ADJUSTED NET INCOME AND RELATED EARNINGS PER DILUTED SHARE (In thousands, except per share amounts) Three Months Ended March 31, 2026 Total Gross Operating Income tax Tax Net Diluted
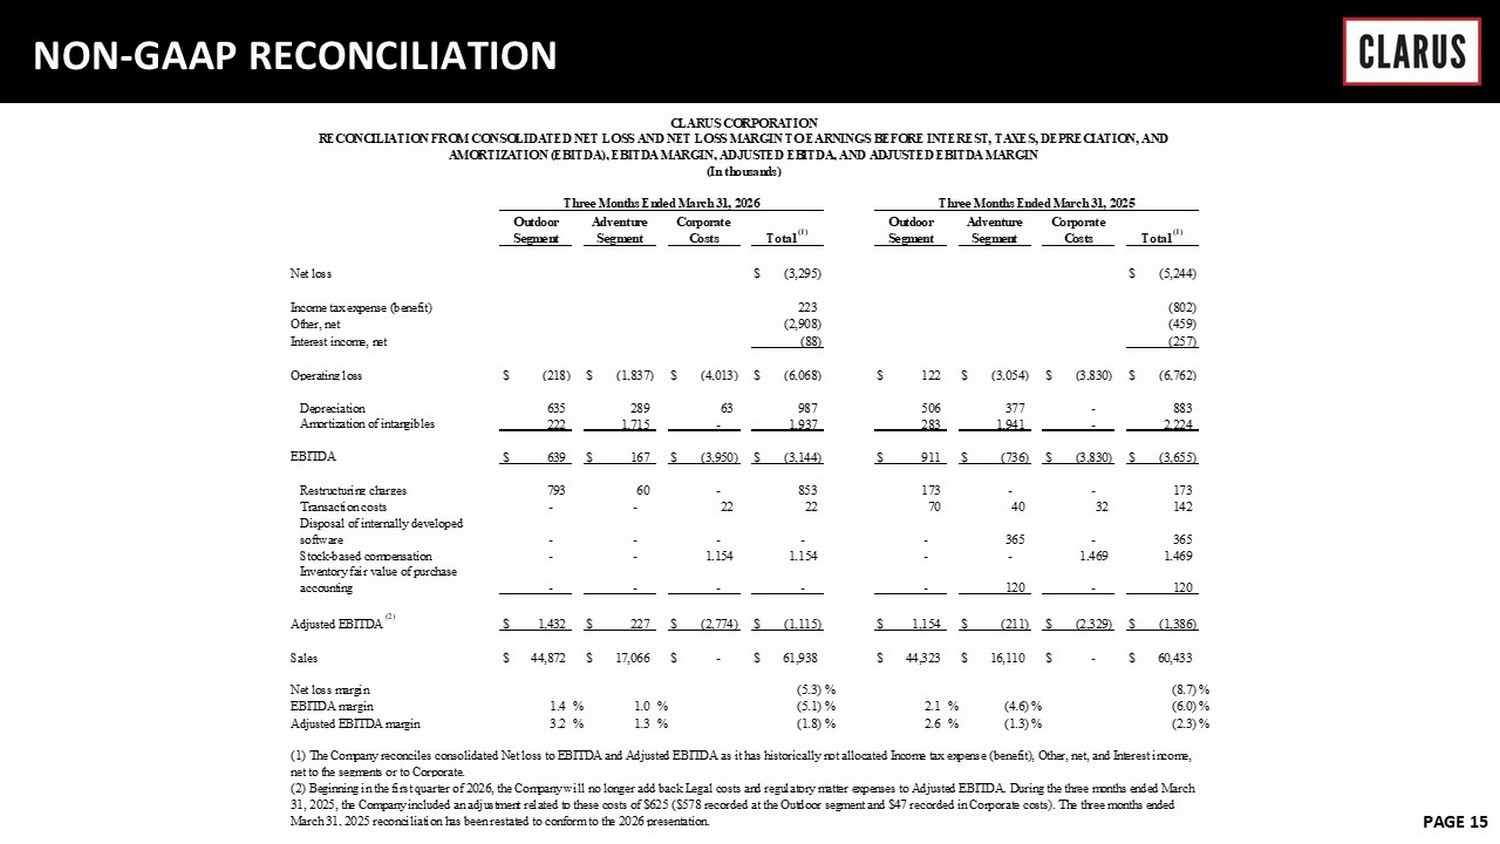
6 February 2023 PAGE 15 NON - GAAP RECONCILIATION Net loss $ (3,295) $ (5,244) Income tax expense (benefit) 223 (802) Other, net (2,908) (459) Interest income, net (88) (257) Operating loss $ (218) $ (1,837) $ (4,013) $ (6,068) $ 122 $ (3,054) $ (3,830) $ (6,762) Depreciation 635 289 63 987 506 377 - 883 Amortization of intangibles 222 1,715 - 1,937 283 1,941 - 2,224 EBITDA $ 639 $ 167 $ (3,950) $ (3,144) $ 911 $ (736) $ (3,830) $ (3,655) Restructuring charges 793 60 - 853 173 - - 173 Transaction costs - - 22 22 70 40 32 142 Disposal of internally developed software - - - - - 365 - 365 Stock-based compensation - - 1,154 1,154 - - 1,469 1,469 Inventory fair value of purchase accounting - - - - - 120 - 120 Adjusted EBITDA (2) $ 1,432 $ 227 $ (2,774) $ (1,115) $ 1,154 $ (211) $ (2,329) $ (1,386) Sales $ 44,872 $ 17,066 $ - $ 61,938 $ 44,323 $ 16,110 $ - $ 60,433 Net loss margin (5.3) % (8.7) % EBITDA margin 1.4 % 1.0 % (5.1) % 2.1 % (4.6) % (6.0) % Adjusted EBITDA margin 3.2 % 1.3 % (1.8) % 2.6 % (1.3) % (2.3) % (2) Beginning in the first quarter of 2026, the Company will no longer add back Legal costs and regulatory matter expenses to Adjusted EBITDA. During the three months ended March 31, 2025, the Company included an adjustment related to these costs of $625 ($578 recorded at the Outdoor segment and $47 recorded in Corporate costs). The three months ended March 31, 2025 reconciliation has been restated to conform to the 2026 presentation. (1) The Company reconciles consolidated Net loss to EBITDA and Adjusted EBITDA as it has historically not allocated Income tax expense (benefit), Other, net, and Interest income, net to the segments or to Corporate. Outdoor Segment Adventure Segment Corporate Costs Total (1) Outdoor Segment Adventure Segment Corporate Costs Total (1) CLARUS CORPORATION RECONCILIATION FROM CONSOLIDATED NET LOSS AND NET LOSS MARGIN TO EARNINGS BEFORE INTEREST, TAXES, DEPRECIATION, AND AMORTIZATION (EBITDA), EBITDA MARGIN, ADJUSTED EBITDA, AND ADJUSTED EBITDA MARGIN (In thousands) Three Months Ended March 31, 2026 Three Months Ended March 31, 2025