UNITED STATES
SECURITIES AND EXCHANGE COMMISSION
Washington, D.C. 20549
FORM 10-K
(Mark One) | |
ANNUAL REPORT PURSUANT TO SECTION 13 OR 15(d) OF THE SECURITIES EXCHANGE ACT OF 1934 | |
For the fiscal year ended February 1, 2020
or
TRANSITION REPORT PURSUANT TO SECTION 13 OR 15(d) OF THE SECURITIES EXCHANGE ACT OF 1934 For the transition period from ______________ to ________________ | |
Commission File Number: 1-15274

(Exact name of registrant as specified in its charter)
(State or other jurisdiction of incorporation or organization) | (I.R.S. Employer Identification No.) | |||
(Address of principal executive offices) | (Zip Code) | |||
(972 ) 431-1000
(Registrant’s telephone number, including area code)
Securities registered pursuant to Section 12(b) of the Act: | ||
Title of each class | Trading Symbol(s) | Name of each exchange on which registered |
Securities registered pursuant to Section 12(g) of the Act: | ||
(Title of class) | ||
Indicate by check mark if the registrant is a well-known seasoned issuer, as defined in Rule 405 of the Securities Act. Yes ☐ No ☒
Indicate by check mark if the registrant is not required to file reports pursuant to Section 13 or 15(d) of the Act. Yes ☐ No ☒
Indicate by check mark whether the registrant (1) has filed all reports required to be filed by Section 13 or 15(d) of the Securities Exchange Act of 1934 during the preceding 12 months (or for such shorter period that the registrant was required to file such reports), and (2) has been subject to such filing requirements for the past 90 days. Yes ☒ No ☐
Indicate by check mark whether the registrant has submitted electronically every Interactive Data File required to be submitted pursuant to Rule 405 of Regulation S-T (§ 232.405 of this chapter) during the preceding 12 months (or for such shorter period that the registrant was required to submit such files). Yes ☒ No ☐
Indicate by check mark whether the registrant is a large accelerated filer, an accelerated filer, a non-accelerated filer, a smaller reporting company, or emerging growth company. See the definitions of “large accelerated filer,” “accelerated filer,” “smaller reporting company,” and “emerging growth company” in Rule 12b-2 of the Exchange Act.
Large accelerated filer | ☐ | ☒ | |||
Non-accelerated filer | ☐ | Smaller reporting company | |||
Emerging growth company | |||||
If an emerging growth company, indicate by check mark if the registrant has elected not to use the extended transition period for complying with any new or revised financial accounting standards provided pursuant to Section 13(a) of the Exchange Act. ☐
Indicate by check mark whether the registrant is a shell company (as defined in Rule 12b-2 of the Exchange Act). Yes ☐ No ☒
State the aggregate market value of the voting and non-voting common equity held by non-affiliates computed by reference to the price at which the common equity was last sold, or the average bid and asked price of such common equity, as of the last business day of the registrant’s most recently completed second fiscal quarter (August 3, 2019). $227,240,130
Indicate the number of shares outstanding of each of the registrant's classes of common stock, as of the latest practicable date.
DOCUMENTS INCORPORATED BY REFERENCE
Documents from which portions are incorporated by reference Parts of the Form 10-K into which incorporated
INDEX
Page | ||
2
PART I
Item 1. Business
Business Overview
J. C. Penney Company, Inc. is a holding company whose principal operating subsidiary is J. C. Penney Corporation, Inc. (JCP). JCP was incorporated in Delaware in 1924, and J. C. Penney Company, Inc. was incorporated in Delaware in 2002, when the holding company structure was implemented. The new holding company assumed the name J. C. Penney Company, Inc. (Company). The holding company has no independent assets or operations, and no direct subsidiaries other than JCP. Common stock of the Company is publicly traded under the symbol “JCP” on the New York Stock Exchange. The Company is a co-obligor (or guarantor, as appropriate) regarding the payment of principal and interest on JCP’s outstanding debt securities. The guarantee by the Company of certain of JCP’s outstanding debt securities is full and unconditional. The holding company and its consolidated subsidiaries, including JCP, are collectively referred to in this Annual Report on Form 10-K as “we,” “us,” “our,” “ourselves,” “Company” or “JCPenney.”
Since our founding by James Cash Penney in 1902, we have grown to be a major retailer, operating 846 department stores in 49 states and Puerto Rico as of February 1, 2020. Our fiscal year ends on the Saturday closest to January 31. Unless otherwise stated, references to years in this report relate to fiscal years, rather than to calendar years. Fiscal year 2019 ended on February 1, 2020; fiscal year 2018 ended on February 2, 2019; and fiscal year 2017 ended on February 3, 2018. Fiscal years 2019 and 2018 consisted of 52 weeks and fiscal year 2017 consisted of 53 weeks.
Our business consists of selling merchandise and services to consumers through our department stores and our website at jcp.com, which utilizes fully optimized applications for desktop, mobile and tablet devices. Our department stores and website generally serve the same type of customers, our website offers virtually the same mix of merchandise as our store assortment plus other extended categories that are not offered in store, and our department stores generally accept returns from sales made in stores and via our website. We fulfill online customer purchases by direct shipment to the customer from our distribution facilities and stores or from our suppliers' warehouses and by in store customer pick up. We primarily sell family apparel and footwear, accessories, fine and fashion jewelry, beauty products through Sephora inside JCPenney, and home furnishings. In addition, our department stores provide our customers with services such as styling salon, optical, portrait photography, and custom decorating.
Based on how we categorized our divisions in 2019, our merchandise mix of total net sales over the last two years was as follows:
2019 | 2018 | |||||
Men’s apparel and accessories | 22 | % | 20 | % | ||
Women’s apparel | 21 | % | 20 | % | ||
Women’s accessories, including Sephora | 14 | % | 14 | % | ||
Home | 11 | % | 14 | % | ||
Footwear and handbags | 11 | % | 11 | % | ||
Kids', including toys | 9 | % | 9 | % | ||
Jewelry | 6 | % | 6 | % | ||
Services and other | 6 | % | 6 | % | ||
100 | % | 100 | % | |||
Competition and Seasonality
The business of selling merchandise and services is highly competitive. We are one of the largest department store and eCommerce retailers in the United States, and we have numerous competitors, as further described in Item 1A, Risk Factors. Many factors enter into the competition for the consumer’s patronage, including merchandise assortment, advertising, price, quality, service, location, shipping times and cost, online and mobile user experience, reputation, credit availability, customer loyalty, availability of in-store services such as styling salon, optical, portrait photography and custom decorating, and the ability to offer personalized customer experiences. Our annual earnings depend to a great extent on the results of operations for the last quarter of the fiscal year, which includes the holiday season, when a significant portion of our sales and profits are recorded.
3
Trademarks
The JCPenney®, JCP®, Liz Claiborne®, Claiborne®, Okie Dokie®, Worthington®, A.N.A A NEW APPROACH®, St. John’s Bay®, The Original Arizona Jean Co®, Ambrielle®, Stafford®, J. Ferrar®, Xersion®, Belle + Sky®, Total Girl®, MONET®, JCPenney Home®, Studio JCP Home™, Sleep Chic®, Home Expressions®, Adonna®, Arizona Jean Co.®, Artesia®, Bijoux Bar™, Bold Elements®, City Streets®, East 5th®, Flirtitude®, Forever Inspired™, North Pole Trading Co.™, Outdoor Oasis™, Paw & Tail™, Peyton & Parker®, Sheer Caress™, Underscore®, and Cooks JCPenney Home™ trademarks, as well as certain other trademarks, have been registered, or are the subject of pending trademark applications with the United States Patent and Trademark Office and with the registries of many foreign countries and/or are protected by common law. We consider our marks and the accompanying name recognition to be valuable to our business.
Website Availability
We maintain an Internet website at www.jcp.com and make available free of charge through this website our annual reports on Form 10-K, quarterly reports on Form 10-Q, current reports on Form 8-K and all related amendments to those reports, as soon as reasonably practicable after the materials are electronically filed with or furnished to the Securities and Exchange Commission. In addition, our website provides press releases, access to webcasts of management presentations and other materials useful in evaluating our Company.
Suppliers
We have a diversified supplier base, both domestic and foreign, and are not dependent to any significant degree on any single supplier. We purchase our merchandise from approximately 2,800 domestic and foreign suppliers, many of whom have done business with us for many years. In addition to our Plano, Texas home office, we, through our purchasing subsidiary, maintained buying and quality assurance offices in 9 foreign countries as of February 1, 2020.
Employment
The Company and its consolidated subsidiaries employed approximately 90,000 full-time and part-time employees as of February 1, 2020.
Environmental Matters
Environmental protection requirements did not have a material effect upon our operations during 2019. It is possible that compliance with such requirements (including any new requirements) would lengthen lead time in expansion or renovation plans and increase construction costs, and therefore operating costs, due in part to the expense and time required to conduct environmental and ecological studies and any required remediation.
As of February 1, 2020, we estimated our total potential environmental liabilities to be $19 million and recorded our estimate in Other liabilities in the Consolidated Balance Sheet as of that date. This estimate covered potential liabilities primarily related to underground storage tanks and remediation of environmental conditions involving our former drugstore locations. We continue to assess required remediation and the adequacy of environmental reserves as new information becomes available and known conditions are further delineated. If we were to incur losses at the estimated amount, we do not believe that such losses would have a material effect on our financial condition, results of operations or liquidity.
Information about our Executive Officers
The following is a list, as of March 16, 2020, of the names and ages of the executive officers of J. C. Penney Company, Inc. and of the offices and other positions held by each such person with the Company. These officers hold identical positions with JCP. There is no family relationship between any of the named persons.
4
Name | Offices and Other Positions Held With the Company | Age | ||
Jill Soltau | Chief Executive Officer | 53 | ||
Bill Wafford | Executive Vice President, Chief Financial Officer | 48 | ||
Brynn L. Evanson | Executive Vice President, Chief Human Resources Officer | 50 | ||
Michelle Wlazlo | Executive Vice President, Chief Merchant | 52 | ||
Therace M. Risch | Executive Vice President, Chief Information Officer | 47 | ||
Jim DePaul | Executive Vice President, Stores | 48 | ||
Steve Whaley | Senior Vice President, Principal Accounting Officer and Controller | 60 | ||
Brandy L. Treadway | Senior Vice President, General Counsel and Secretary | 45 | ||
Ms. Soltau has served as Chief Executive Officer and as a director of the Company since October 2018. Prior to joining the Company, she served as President and Chief Executive Officer of JoAnn Stores, Inc. (fabric and craft retailer) from 2015 to October 2018. From 2013 to 2015, she served as President of Shopko Stores (general merchandise retailer), with which she served in positions of increasing responsibility, including Executive Vice President, Chief Merchandising Officer from 2009 to 2013 and Senior Vice President, General Merchandise Manager, Apparel and Accessories from 2007 to 2009. Prior to that, she held positions of increasing responsibility with national and regional retailers including Sears Holdings, Kohl's Corporation and Carson Pirie Scott. Ms. Soltau currently serves as a director of Autozone, Inc. (automotive parts and accessories retailer).
Mr. Wafford has served as Executive Vice President, Chief Financial Officer of the Company since April 2019. Prior to that, he served as Executive Vice President, Chief Financial Officer of The Vitamin Shoppe (health and wellness retailer) since 2018 and as Senior Vice President, Strategy and Business Development of The Vitamin Shoppe from 2017 to 2018. Mr. Wafford served as a partner in the Advisory Practice of KPMG LLP (accounting firm) from 2015 to 2017. Prior to that, he served in positions of increasing responsibility with Walgreens Boots Alliance (retail pharmacy) from 2009 to 2014, including Divisional Vice President, Retail Finance from 2009 to 2012, Vice President, International Finance from 2012 to 2013, and Vice President and Managing Director, Well Ventures LLC from 2013 to 2014.
Ms. Evanson has served as Executive Vice President, Chief Human Resources Officer since 2013. She previously served as Vice President, Compensation, Benefits and Talent Operations from 2010 to 2013 and Director of Compensation from 2009 to 2010. Prior to joining the Company, she worked at the Dayton Hudson Corporation (retailer) from 1991 to 2009 (renamed Target Corporation in 2000). Ms. Evanson began her career with Marshall Field’s (department store retailer) where she advanced through positions in stores, finance, human resources and merchandising and moved to the Target stores division in 2000, ultimately serving as Director of Executive Compensation and Retirement Plans.
Ms. Wlazlo has served as Executive Vice President, Chief Merchant of the Company since March 2019. Prior to joining the Company, she served as Senior Vice President, Merchandising Apparel and Accessories for Target Corporation (retailer) from 2016 to 2019. From 1996 to 2015, she served in positions of increasing responsibility with GAP, Inc. (retailer), including Senior Vice President, Global Merchandising, GAP from 2013 to 2015, Senior Vice President, Merchandising, Old Navy from 2008 to 2013, and Vice President, Merchandising, GAP from 2005 to 2008.
Ms. Risch has served as Executive Vice President, Chief Information Officer of the Company since December 2019. Prior to that, she served as Executive Vice President, Chief Information Officer and Chief Digital Officer from March 2018 to December 2019 and as Executive Vice President and Chief Information Officer from 2015 to March 2018. Prior to joining the Company, she served as Executive Vice President and Chief Information Officer of Country Financial (insurance and investment services) from 2014 to 2015. Prior to that, Ms. Risch spent 10 years at Target Corporation in a variety of technology roles of increasing responsibility, including Vice President of Technology Delivery Services from 2012 to 2014 and Vice President, Business Technology Team from 2009 to 2012.
Mr. DePaul has served as Executive Vice President, Stores of the Company since August 2019. Prior to that, he served as Chief Operations Officer of Shopko Stores from 2017 to 2019, with whom he served in positions of increasing responsibility from 1998, including Chief Administration Officer from 2014 to 2017, Senior Vice President, Stores and Operation from 2010 to 2014, Vice President, Stores Operations and Finance, Facilities, Construction from 2006 to 2010, Regional Director of Sales from 2004 to 2006, and Senior Manager Process Improvement from 2002 to 2004. Prior to joining Shopko Stores, he served in Merchandising/Operations Team Leader positions of Target Corporation.
Mr. Whaley has served as Senior Vice President, Principal Accounting Officer and Controller of the Company since May 2019. Prior to that, he served as Senior Vice President and Global Controller, Principal Accounting Officer of Wal-Mart Stores, Inc.
5
(retailer) from 2007 to 2017 and Vice President and Assistant Controller from 2005 to 2007. Mr. Whaley served as Vice President and Controller of Southwest Airlines (airline) from 2001 to 2005.
Ms. Treadway has served as Senior Vice President, General Counsel and Secretary of the Company since January 2020. Prior to that, she served as Senior Vice President, General Counsel from 2017 to January 2020. She served as Vice President, interim General Counsel from June 2017 to August 2017; Vice President, Associate General Counsel from 2016 to June 2017; Assistant General Counsel from 2014 to 2016; Senior Managing Counsel from 2012 to 2014; and Senior Counsel from 2011 to 2012. Prior to joining the Company, Ms. Treadway was an associate at Weil, Gotshal & Manges, LLP (law firm) from 2002 to 2011.
Item 1A. Risk Factors
The following risk factors should be read carefully in connection with evaluating our business and the forward-looking information contained in this Annual Report on Form 10-K. Any of the following risks could materially adversely affect our business, operating results, financial condition and the actual outcome of matters as to which forward-looking statements are made in this Annual Report on Form 10-K.
The recent coronavirus outbreak could have an adverse effect on our business.
Concerns are rapidly growing about the global outbreak of a novel strain of coronavirus (COVID-19). The virus has spread rapidly across the globe, including the U.S. The pandemic is having an unprecedented impact on the U.S. economy as federal, state and local governments react to this public health crisis, which has created significant uncertainties. These uncertainties include, but are not limited to, the potential adverse effect of the pandemic on the economy, our supply chain partners, our employees and customers, customer sentiment in general, and traffic within the malls and shopping centers containing our stores. As the pandemic continues to grow, consumer fear about becoming ill with the virus and recommendations and/or mandates from federal, state and local authorities to avoid large gatherings of people or self-quarantine may continue to increase, which has already affected, and may continue to affect, traffic to our stores. The Company has announced the closing of all stores through April 1, 2020 in response to the crisis. We are unable to predict when stores will reopen after this date or if additional periods of store closures will be needed or mandated. Continued impacts of the pandemic could materially adversely affect our near-term and long-term revenues, earnings, liquidity and cash flows, and may require significant actions in response, including but not limited to, employee furloughs, reduced store hours, store closings, expense reductions or discounting of pricing of our products, all in an effort to mitigate such impacts. The extent of the impact of the pandemic on our business and financial results will depend largely on future developments, including the duration of the spread of the outbreak within the U.S., the impact on capital and financial markets and the related impact on consumer confidence and spending, all of which are highly uncertain and cannot be predicted. This situation is changing rapidly, and additional impacts may arise that we are not aware of currently.
Our ability to achieve profitable growth is subject to both the risks affecting our business generally and the inherent difficulties associated with implementing our strategic plan.
As we position the Company for long-term growth, it may take longer than expected to achieve our objectives, and actual results may be materially less than planned. Our ability to improve our operating results depends upon a significant number of factors, some of which are beyond our control, including:
• | customer response to our marketing and merchandise strategies; |
• | our ability to achieve profitable sales and to make adjustments in response to changing conditions; |
• | our ability to respond to competitive pressures in our industry; |
• | our ability to effectively manage inventory; |
• | the success of our omnichannel strategy; |
• | our ability to gather accurate and relevant data and effectively utilize that data in our strategic planning and decision making; |
• | our ability to benefit from investments in our stores; |
• | our ability to respond to any unanticipated changes in expected cash flows, liquidity and cash needs, including our ability to obtain any additional financing or other liquidity enhancing transactions, if and when needed; |
6
• | our ability to achieve positive cash flow; |
• | our ability to access an adequate and uninterrupted supply of merchandise from suppliers at expected levels and on acceptable terms; |
• | changes to the regulatory environment in which our business operates; and |
• | general economic conditions. |
There is no assurance that our marketing, merchandising and omnichannel strategies, or any future adjustments to our strategies, will improve our operating results.
We operate in a highly competitive industry, which could adversely impact our sales and profitability.
The retail industry is highly competitive, with few barriers to entry. We compete with many other local, regional and national retailers for customers, employees, locations, merchandise, services and other important aspects of our business. Those competitors include other department stores, discounters, home furnishing stores, specialty retailers, wholesale clubs, direct-to-consumer businesses, including exclusively eCommerce retailers, and other forms of retail commerce. Some competitors are larger than JCPenney, and/or have greater financial resources available to them, and, as a result, may be able to devote greater resources to sourcing, promoting, selling their products, updating their store environment and updating their technology. Competition is characterized by many factors, including merchandise assortment, advertising, price, quality, service, location, reputation, shipping times and cost, online and mobile user experience, credit availability, customer loyalty, availability of in-store services, such as styling salon, optical, portrait photography and custom decorating, and the ability to offer personalized customer experiences. We have experienced, and anticipate that we will continue to experience for at least the foreseeable future, significant competition from our competitors. The performance of competitors as well as changes in their pricing and promotional policies, marketing activities, customer loyalty programs, new strategic partnerships, availability of in-store services, new store openings, store renovations, launches of eCommerce platforms, brand launches and other merchandise and operational strategies could cause us to have lower sales, lower merchandise margin and/or higher operating expenses such as marketing costs and other selling, general and administrative expenses, which in turn could have an adverse impact on our profitability.
Our sales and operating results depend on our ability to develop merchandise offerings that resonate with our existing customers and help to attract new customers.
Our sales and operating results depend in part on our ability to predict and respond to changes in fashion trends and customer preferences in a timely manner by consistently offering stylish, quality merchandise assortments at competitive prices. We continuously assess emerging styles and trends and focus on developing a merchandise assortment to meet customer preferences. There is no assurance that these efforts will be successful or that we will be able to satisfy constantly changing customer demands. To the extent our decisions regarding our merchandise differ from our customers’ preferences, we may be faced with reduced sales and excess inventories for some products and/or missed opportunities for others. Any sustained failure to identify and respond to emerging trends in lifestyle and customer preferences and buying trends could have an adverse impact on our business. In addition, merchandise misjudgments may adversely impact the perception or reputation of our Company, which could result in declines in customer loyalty and vendor relationship issues, and ultimately have a material adverse effect on our business, financial condition and results of operations.
We may also seek to expand into new lines of business from time to time. There is no assurance that these efforts will be successful. As we devote time and resources to new lines of business, management’s attention and resources may be diverted from existing business activities. Further, if new lines of business are not as successful as we planned, then we risk damaging our overall business results. In addition, we may seek to expand our merchandise offerings into new product categories. Moving into new lines of business and expanding our merchandise offerings may carry new or additional risks beyond those typically associated with our traditional apparel and home furnishings businesses, including potential reputational harm resulting from actions by unaffiliated third-parties that we may use to assist us in providing goods or services. We may not be able to develop new lines of business in a manner that improves our operating results or address or mitigate the risks associated with new product categories and new lines of business, and may therefore be forced to close the new lines of business or reduce our expanded merchandise offerings, which may damage our reputation and negatively impact our operating results.
Our results may be negatively impacted if customers do not maintain their favorable perception of our Company and our private brand merchandise.
Maintaining and continually enhancing the value of our Company and our private brand merchandise is important to the success of our business. The value of our private brands is based in large part on the degree to which customers perceive and
7
react to them. The value of our private brands could diminish significantly due to a number of factors, including customer perception that we have acted in an irresponsible manner in sourcing our private brand merchandise, adverse publicity about our private brand merchandise, our failure to maintain the quality of our private brand products, the failure of our private brand merchandise to deliver consistently good value to the customer, or the failure to protect the image associated with our private brands. The growing use of social and digital media by customers, us, and third parties increases the speed and extent that information or misinformation and opinions can be shared. Negative posts or comments about us, our private brands, or any of our merchandise on social or digital media could seriously damage our reputation. If we do not maintain the favorable perception of our Company and our private brand merchandise or we experience a reduction in the level of private brand sales, our business results could be negatively impacted.
Our ability to increase sales and store productivity is largely dependent upon our ability to increase customer traffic and conversion.
Customer traffic depends upon our ability to successfully market compelling merchandise assortments, present an appealing shopping environment and experience to customers, and attract customers to our stores through omnichannel initiatives such as buy-online-pickup-in-store programs. Our strategies focus on increasing customer traffic and improving conversion in our stores and online; however, there can be no assurance that our efforts will be successful or will result in increased sales or margins. Further, costs to drive online traffic may be higher than anticipated, which could result in lower margins, and actions to drive online traffic may not deliver anticipated results. In addition, external events outside of our control, including store closings by our competitors, pandemics, terrorist threats, domestic conflicts and civil unrest, may influence customers' decisions to visit malls or might otherwise cause customers to avoid public places. There is no assurance that we will be able to reverse any decline in traffic or that increases in eCommerce sales will offset any decline in store traffic. We may need to respond to any declines in customer traffic or conversion rates by increasing markdowns or promotions to attract customers, which could adversely impact our operating results and cash flows from operating activities. In addition, the challenge of declining store traffic along with the growth of digital shopping channels and its diversion of sales from brick-and-mortar stores could lead to store closures and/or asset impairment charges, which could adversely impact our operating results, financial position and cash flows.
If we are unable to manage our inventory effectively, our merchandise margins could be adversely affected.
Our profitability depends upon our ability to manage appropriate inventory levels and respond quickly to shifts in consumer demand patterns. We must properly execute our inventory management strategies by appropriately allocating merchandise among our stores and online, timely and efficiently distributing inventory to stores, maintaining an appropriate mix and level of inventory in stores and online, adjusting our merchandise mix between our private and exclusive brands and national brands, appropriately changing the allocation of floor space of stores among product categories to respond to customer demand and effectively managing pricing and markdowns. If we overestimate customer demand for our merchandise, we will likely need to record inventory markdowns and sell the excess inventory at clearance prices which would negatively impact our merchandise margins and operating results. If we underestimate customer demand for our merchandise, we may experience inventory shortages which may result in missed sales opportunities and have a negative impact on customer loyalty. In addition, although we have various processes and systems to help protect against loss or theft of our inventory, higher than expected levels of lost or stolen inventory (called “shrinkage”) could result in write-offs and lost sales, which could adversely impact our profitability.
We must protect against security breaches or other unauthorized disclosures of confidential data about our customers as well as about our employees and other third parties.
As part of our normal operations, we and third-party service providers with whom we contract receive and maintain information about our customers (including credit/debit card information), our employees and other third parties. Confidential data must at all times be protected against security breaches or other unauthorized disclosure. We have, and require our third-party service providers to have, administrative, physical and technical safeguards and procedures in place to protect the security, confidentiality, integrity and availability of such information and to protect such information against unauthorized access, disclosure or acquisition. Despite our safeguards and security processes and procedures, our systems and processes, and those of our third-party service providers, are not free from vulnerability to security breaches, inadvertent data disclosure or acquisition by third parties. Further, because the methods used to obtain unauthorized access change frequently and may not be immediately detected, we may be unable to anticipate these methods or promptly implement safeguards.
Additionally, as the regulatory environment related to information security, data collection, and use and privacy becomes increasingly rigorous, with new and constantly changing requirements applicable to our business, compliance with those requirements could also result in additional costs. For example, California passed the California Consumer Privacy Act of 2018 (the “CCPA”), which went into effect in January 2020 and provides broad rights to California consumers with respect to the collection and use of their information by businesses. The CCPA expands the privacy rights of California citizens and as a
8
result, we may need to process enhancements and commit resources in support of compliance with California’s regulatory requirements. Any failure to adhere to the requirements of the CCPA and other evolving laws and regulations in this area, or to protect confidential data about our business or our customers, employees or other third parties, could result in financial penalties and legal liability and could materially damage our brand and reputation, as well as result in significant expenses and disruptions to our operations, and loss of customer confidence, any of which could have a material adverse impact on our business and results of operations. We could also be subject to government enforcement actions and private litigation as a result of any such failure.
The failure to retain, attract and motivate our employees, including employees in key positions, could have an adverse impact on our results of operations.
Our results depend on the contributions of our employees, including our senior management team and other key employees. This depends to a great extent on our ability to retain, attract and motivate talented employees throughout the organization, many of whom, particularly in the stores, are in entry level or part-time positions, which have historically had high rates of turnover. We currently operate with significantly fewer individuals than we have in the past who have assumed additional duties and responsibilities, which could have an adverse impact on our operating performance and efficiency. Negative media reports regarding the Company or the retail industry in general, as well as uncertainty due to store closings or future Company performance, could also have an adverse impact on our ability to attract, retain and motivate our employees. If we are unable to retain, attract and motivate talented employees with the appropriate skill sets, we may not achieve our objectives and our results of operations could be adversely impacted. Our ability to meet our changing labor needs while controlling our costs is also subject to external factors such as unemployment levels, competing wages, potential union organizing efforts and government regulation. An inability to provide wages and/or benefits that are competitive within the markets in which we operate could adversely affect our ability to retain and attract employees. In addition, the loss of one or more of our key personnel or the inability to effectively identify a suitable successor to a key role in our senior management could have a material adverse effect on our business.
If we are unable to successfully develop and maintain a relevant and reliable omnichannel experience for our customers, our sales, results of operations and reputation could be adversely affected.
We believe it is critical that we deliver a superior omnichannel shopping experience for our customers through the integration of our store and digital shopping channels. Omnichannel retailing is rapidly evolving and we must anticipate and meet changing customer expectations. Our omnichannel strategies include our ship-from-store and buy-online-pickup-in-store programs. In addition, we continue to explore ways to enhance our customers’ omnichannel shopping experience, including through investments in IT systems, operational changes and developing a more customer-friendly user experience. Our competitors are also investing in omnichannel initiatives, some of which may be more successful than our initiatives. For example, eCommerce competitors have placed an emphasis on delivery services, with customers increasingly seeking faster, guaranteed delivery times and low-price or free shipping. There is no assurance that we will be able to compete successfully on delivery times and delivery costs, which is dependent on many factors. If the implementation of our omnichannel strategies is not successful or does not meet customer expectations, or we do not realize a return on our omnichannel investments, our reputation and operating results may be adversely affected.
Disruptions in our eCommerce platforms, or our inability to successfully execute our eCommerce or omnichannel strategies, could have an adverse impact on our sales and results of operations.
We sell merchandise over the Internet through our website, www.jcp.com, and through mobile applications for smart phones and tablets. Our Internet operations are subject to numerous risks, including rapid technological change and the implementation of new systems and platforms; liability for online and mobile content; violations of state or federal laws, including those relating to online and mobile privacy and intellectual property rights; credit card fraud; problems associated with the operation, security and availability of our website, mobile applications and related support systems; computer malware; telecommunications failures; electronic break-ins and similar disruptions; and the allocation of inventory between our online operations and department stores. The failure of our website or mobile applications to perform as expected could result in disruptions and costs to our operations and make it more difficult for customers to purchase merchandise online. In addition, our inability to successfully develop and maintain the necessary technological interfaces for our customers to purchase merchandise through our website and mobile applications, including user friendly software applications for smart phones and tablets, could result in the loss of Internet sales and have an adverse impact on our results of operations.
9
Our operations are dependent on information technology systems; disruptions in those systems or increased costs relating to their implementation could have an adverse impact on our results of operations.
Our operations are dependent upon the integrity, security and consistent operation of various systems and data centers, including the point-of-sale systems in the stores, our eCommerce platforms, data centers that process transactions, communication systems and various software applications used throughout our Company to source merchandise, track inventory flow, process transactions, generate performance and financial reports and administer payroll and benefit plans.
We have implemented several applications and systems from third party vendors, providers and licensors to simplify our processes and reduce our use of customized existing legacy systems and expect to place additional applications and systems into operation in the future. Any continued reliance on existing legacy systems may result in extended system outages due to the difficulty in recovering those systems as well as inefficiencies in our business workflow due to the complexity and high levels of customization inherent in such systems. Implementing new applications and systems carries substantial risk, including implementation delays, cost overruns, disruption of operations, potential loss of data or information, lower customer satisfaction resulting in lost customers or sales, inability to deliver merchandise to our stores or our customers, the potential inability to meet reporting requirements and unintentional security vulnerabilities. There can be no assurances that we will successfully launch the new applications and systems as planned, that the new applications and systems will perform as expected or that the new applications and systems will be implemented without disruptions to our operations, any of which may cause critical information upon which we rely to be delayed, unreliable, corrupted, insufficient or inaccessible.
We also outsource various information technology functions to third party service providers and may outsource other functions in the future. We rely on those third party service providers to provide services on a timely and effective basis and their failure to perform as expected or as required by contract could result in disruptions and costs to our operations.
Our vendors are also highly dependent on the use of information technology systems. Major disruptions in their information technology systems could result in their inability to communicate with us or otherwise to process our transactions or information, their inability to perform required functions, or in the loss or corruption of our information, any and all of which could result in disruptions to our operations. Our vendors are responsible for having safeguards and procedures in place to protect the confidentiality, integrity and security of our information, and to protect our information and systems against unauthorized access, disclosure or acquisition. Any failure in their systems to operate or in their ability to protect our information or systems could have a material adverse impact on our business and results of operations.
We have insourced, and may continue to insource, certain business functions from third party vendors and may seek to relocate certain business functions to international locations in an attempt to achieve additional efficiencies, both of which subject us to risks, including disruptions in our business.
We have insourced certain business functions and may also need to continue to insource other aspects of our business in the future in order to effectively manage our costs and stay competitive. We may also seek from time to time to relocate certain business functions to countries other than the United States to access highly skilled labor markets and further control costs. There is no assurance that these efforts will be successful. In addition, future regulatory developments could hinder our ability to fully realize the anticipated benefits of these actions. These actions may also cause disruptions that negatively impact our business. If we are ultimately unable to perform insourced functions better than, or at least as well as, third party providers, or otherwise fully realize the anticipated benefits of these actions, our operating results could be adversely impacted.
Changes in our credit ratings may limit our access to capital markets and adversely affect our liquidity.
The credit rating agencies periodically review our capital structure and the quality and stability of our earnings. Any downgrades to our long-term credit ratings could result in reduced access to the credit and capital markets and higher interest costs on future financings. The future availability of financing will depend on a variety of factors such as economic and market conditions, the availability of credit and our credit ratings, as well as the possibility that lenders could develop a negative perception of us. There is no assurance that we will be able to obtain additional financing on favorable terms or at all.
Our profitability depends on our ability to source merchandise and deliver it to our customers in a timely and cost-effective manner.
Our merchandise is sourced from a wide variety of suppliers, and our business depends on being able to find qualified suppliers and access products in a timely and efficient manner. Inflationary pressures on commodity prices and other input costs could increase our cost of goods, and an inability to pass such cost increases on to our customers or a change in our merchandise mix as a result of such cost increases could have an adverse impact on our profitability. Additionally, the impact of economic conditions on our suppliers cannot be predicted and our suppliers may be unable to access financing or become insolvent and
10
thus become unable to supply us with products. Developments in tax policy, such as the imposition of tariffs on imported merchandise, or changes to U.S. trade legislation could further have a material adverse effect on our results of operations and liquidity.
Our arrangements with our suppliers and vendors may be impacted by our financial results or financial position.
Substantially all of our merchandise suppliers and vendors sell to us on open account purchase terms. There is a risk that our key suppliers and vendors could respond to any actual or apparent decrease in or any concern with our financial results or liquidity by requiring or conditioning their sale of merchandise to us on more stringent or more costly payment terms, such as by requiring standby letters of credit, earlier or advance payment of invoices, payment upon delivery or other assurances or credit support or by choosing not to sell merchandise to us on a timely basis or at all. Our arrangements with our suppliers and vendors may also be impacted by media reports regarding our financial position. Our need for additional liquidity could significantly increase and our supply of merchandise could be materially disrupted if a significant portion of our key suppliers and vendors took one or more of the actions described above, which could have a material adverse effect on our sales, customer satisfaction, cash flows, liquidity and financial position.
Our senior secured real estate term loan credit facility and senior secured notes are secured by certain of our real property and, together with our senior secured second priority notes, substantially all of our personal property, and such property may be subject to foreclosure or other remedies in the event of our default. In addition, the real estate term loan credit facility and the indentures governing the senior secured notes and senior secured second priority notes contain provisions that could restrict our operations and our ability to obtain additional financing.
We are (i) party to a $1.688 billion senior secured term loan credit facility and (ii) the issuer of $500 million aggregate principal amount of senior secured notes. We have also issued $400 million aggregate principal amount of senior secured second priority notes. The senior secured term loan credit facility and the senior secured notes are secured by mortgages on certain real property of the Company and, together with the senior secured second priority notes, liens on substantially all personal property of the Company, subject to certain exclusions set forth in the security documents relating to the term loan credit facility, the senior secured notes and the senior secured second priority notes. The real property subject to mortgages under the term loan credit facility and the indenture governing the senior secured notes includes our distribution centers and certain of our stores.
The credit and guaranty agreement governing the term loan credit facility and the indentures governing the senior secured notes and the senior secured second-priority notes contain operating restrictions which may impact our future alternatives by limiting, without lender consent, our ability to borrow additional funds, execute certain equity financings or enter into dispositions or other liquidity enhancing or strategic transactions regarding certain of our assets, including our real property. Our ability to obtain additional or other financing or to dispose of certain assets could also be negatively impacted because a substantial portion of our assets have been restricted or pledged as collateral for repayment of our indebtedness under the term loan credit facility, the senior secured notes and the senior secured second-priority notes.
If an event of default occurs and is continuing, our outstanding obligations under the term loan credit facility, the senior secured notes and the senior secured second-priority notes could be declared immediately due and payable or the lenders could foreclose on or exercise other remedies with respect to the assets securing the term loan credit facility, the senior secured notes and the senior secured second-priority notes, including, with respect to the term loan credit facility and senior secured notes, our distribution centers and certain of our stores. If an event of default occurs, there is no assurance that we would have the cash resources available to repay such accelerated obligations or refinance such indebtedness on commercially reasonable terms, or at all. The occurrence of any one of these events could have a material adverse effect on our business, financial condition, results of operations and liquidity.
Our senior secured asset-based revolving credit facility limits our borrowing capacity to the value of certain of our assets. In addition, our senior secured asset-based revolving credit facility is secured by certain of our personal property, and lenders may exercise remedies against the collateral in the event of our default.
We are party to a $2.35 billion senior secured asset-based revolving credit facility. Our borrowing capacity under our revolving credit facility varies according to the Company’s inventory levels, accounts receivable and credit card receivables, net of certain reserves. In the event of any material decrease in the amount of or appraised value of these assets, our borrowing capacity would similarly decrease, which could adversely impact our business and liquidity.
Our revolving credit facility contains customary affirmative and negative covenants and certain restrictions on operations become applicable if our availability falls below certain thresholds. These covenants could impose significant operating and financial limitations and restrictions on us, including restrictions on our ability to enter into particular transactions and to engage in other actions that we may believe are advisable or necessary for our business.
11
Our obligations under the revolving credit facility are secured by liens with respect to inventory, accounts receivable, deposit accounts and certain related collateral. In the event of a default that is not cured or waived within any applicable cure periods, the lenders’ commitment to extend further credit under our revolving credit facility could be terminated, our outstanding obligations could become immediately due and payable, outstanding letters of credit may be required to be cash collateralized and remedies may be exercised against the collateral, which generally consists of the Company’s inventory, accounts receivable and deposit accounts and cash credited thereto. If we are unable to borrow under our revolving credit facility, we may not have the necessary cash resources for our operations and, if any event of default occurs, there is no assurance that we would have the cash resources available to repay such accelerated obligations, refinance such indebtedness on commercially reasonable terms, or at all, or cash collateralize our letters of credit, which would have a material adverse effect on our business, financial condition, results of operations and liquidity.
Our level of indebtedness may adversely affect our business and results of operations and may require the use of our available cash resources to meet repayment obligations, which could reduce the cash available for other purposes.
As of February 1, 2020, we have $3.721 billion in total indebtedness and we are highly leveraged. Our level of indebtedness may limit our ability to obtain additional financing, if needed, to fund additional projects, working capital requirements, capital expenditures, debt service, and other general corporate or other obligations, as well as increase the risks to our business associated with general adverse economic and industry conditions. Our level of indebtedness may also place us at a competitive disadvantage to our competitors that are not as highly leveraged. In addition, the future limitations on tax deductions for interest paid on outstanding indebtedness as a result of the Tax Cuts and Jobs Act enacted in December 2017 (the “Tax Act”) could have a material adverse effect on our results of operations and liquidity.
We are required to make quarterly repayments in a principal amount equal to $10.55 million during the seven-year term of the real estate term loan credit facility, subject to certain reductions for mandatory and optional prepayments. In addition, we are required to make prepayments of the real estate term loan credit facility with the proceeds of certain asset sales, insurance proceeds and excess cash flow, which could reduce the cash available for other purposes, including capital expenditures for store improvements, and could impact our ability to reinvest in other areas of our business.
There is no assurance that our internal and external sources of liquidity will at all times be sufficient for our cash requirements.
We must have sufficient sources of liquidity to fund our working capital requirements, capital improvement plans, service our outstanding indebtedness and finance investment opportunities. The principal sources of our liquidity are funds generated from operating activities, available cash and cash equivalents, borrowings under our credit facilities, other debt financings, equity financings and sales of non-operating assets. We expect our ability to generate cash through the sale of non-operating assets to diminish as our portfolio of non-operating assets decreases. In addition, our recent operating losses have limited our capital resources. Our ability to achieve our business and cash flow plans is based on a number of assumptions which involve significant judgments and estimates of future performance, borrowing capacity and credit availability, which cannot at all times be assured. Accordingly, there is no assurance that cash flows from operations and other internal and external sources of liquidity will at all times be sufficient for our cash requirements. If necessary, we may need to consider actions and steps to improve our cash position and mitigate any potential liquidity shortfall, such as modifying our business plan, pursuing additional financing to the extent available, reducing capital expenditures, pursuing and evaluating other alternatives and opportunities to obtain additional sources of liquidity and other potential actions to reduce costs. There can be no assurance that any of these actions would be successful, sufficient or available on favorable terms. Any inability to generate or obtain sufficient levels of liquidity to meet our cash requirements at the level and times needed could have a material adverse impact on our business and financial position.
Our ability to obtain any additional financing or any refinancing of our debt, if needed at any time, depends upon many factors, including our existing level of indebtedness and restrictions in our debt facilities, historical business performance, financial projections, the value and sufficiency of collateral, prospects and creditworthiness, external economic conditions and general liquidity in the credit and capital markets. Any additional debt, equity or equity-linked financing may require modification of our existing debt agreements, which there is no assurance would be obtainable. Any additional financing or refinancing could also be extended only at higher costs and require us to satisfy more restrictive covenants, which could further limit or restrict our business and results of operations, or be dilutive to our stockholders.
Our use of interest rate hedging transactions could expose us to risks and financial losses that may adversely affect our financial condition, liquidity and results of operations.
To reduce our exposure to interest rate fluctuations, we have entered into, and in the future may enter into, interest rate swaps with various financial counterparties. The interest rate swap agreements effectively convert a portion of our variable rate
12
interest payments to a fixed price. There can be no assurances, however, that our hedging activity will be effective in insulating us from the risks associated with changes in interest rates. In addition, our hedging transactions may expose us to certain risks and financial losses, including, among other things:
• | counterparty credit risk; |
• | the risk that the duration or amount of the hedge may not match the duration or amount of the related liability; |
• | the hedging transactions may be adjusted from time to time in accordance with accounting rules to reflect changes in fair values, downward adjustments or “mark-to-market losses,” which would affect our stockholders’ equity; and |
• | the risk that we may not be able to meet the terms and conditions of the hedging instruments, in which case we may be required to settle the instruments prior to maturity with cash payments that could significantly affect our liquidity. |
Further, we have designated the swaps as cash flow hedges in accordance with Accounting Standards Codification Topic 815, Derivatives and Hedging. However, in the future, we may fail to qualify for hedge accounting treatment under these standards for a number of reasons, including if we fail to satisfy hedge documentation and hedge effectiveness assessment requirements or if the swaps are not highly effective. If we fail to qualify for hedge accounting treatment, losses on the swaps caused by the change in their fair value will be recognized as part of net income, rather than being recognized as part of other comprehensive income.
Operating results and cash flows may cause us to incur asset impairment charges.
Long-lived assets, primarily property and equipment, and operating lease assets are reviewed at the store level at least annually for impairment, or whenever changes in circumstances indicate that a full recovery of net asset values through future cash flows is in question. We also assess the recoverability of indefinite-lived intangible assets at least annually or whenever events or changes in circumstances indicate that the carrying amount may not be fully recoverable. Our impairment review requires us to make estimates and projections regarding, but not limited to, sales, operating profit and future cash flows. If our operating performance reflects a sustained decline, we may be exposed to significant asset impairment charges in future periods, which could be material to our results of operations.
Reductions in income and cash flow from our marketing and servicing arrangement related to our private label and co-branded credit cards could adversely affect our operating results and cash flows.
Synchrony Financial (“Synchrony”) owns and services our private label credit card and co-branded MasterCard® programs. Our agreement with Synchrony provides for certain payments to be made by Synchrony to the Company, including a share of income from the performance of the credit card portfolios. The income and cash flow that the Company receives from Synchrony is dependent upon a number of factors including the level of sales on private label and co-branded accounts, the percentage of sales on private label and co-branded accounts relative to the Company’s total sales, the level of balances carried on the accounts, payment rates on the accounts, finance charge rates and other fees on the accounts, the level of credit losses for the accounts, Synchrony’s ability to extend credit to our customers as well as the cost of customer rewards programs. All of these factors can vary based on changes in federal and state credit card, banking and consumer protection laws, which could also materially limit the availability of credit to consumers or increase the cost of credit to our cardholders. The factors affecting the income and cash flow that the Company receives from Synchrony can also vary based on a variety of economic, legal, social and other factors that we cannot control. If the income or cash flow that the Company receives from our consumer credit card program agreement with Synchrony decreases, our operating results and cash flows could be adversely affected.
We are subject to risks associated with importing merchandise from foreign countries.
A substantial portion of our merchandise is sourced by our vendors and by us outside of the United States. All of our direct private brand vendors must comply with our supplier legal compliance program and applicable laws, including consumer and product safety laws. Although we diversify our sourcing and production by country and supplier, the failure of a supplier to produce and deliver our goods on time, to meet our quality standards and adhere to our product safety requirements or to meet the requirements of our supplier compliance program or applicable laws could result in damage to our reputation.
Although we have implemented policies and procedures designed to facilitate compliance with laws and regulations relating to doing business in foreign markets and importing merchandise from abroad, there can be no assurance that suppliers and other third parties with whom we do business will not violate such laws and regulations or our policies, which could subject us to liability and could adversely affect our results of operations.
13
We are subject to the various risks of importing merchandise from abroad and purchasing product made in foreign countries, such as:
• | potential disruptions in manufacturing, logistics and supply; |
• | changes in duties, tariffs, quotas and voluntary export restrictions on imported merchandise; |
• | strikes and other events affecting delivery; |
• | consumer perceptions of the safety of imported merchandise; |
• | product compliance with laws and regulations of the destination country; |
• | product liability claims from customers or penalties from government agencies relating to products that are recalled, defective or otherwise noncompliant or alleged to be harmful; |
• | concerns about human rights, working conditions and other labor rights and conditions and environmental impact in foreign countries where merchandise is produced and raw materials or components are sourced, and changing labor, environmental and other laws in these countries; |
• | local business practice and political issues that may result in adverse publicity or threatened or actual adverse consumer actions, including boycotts; |
• | natural disasters, public health crisis, acts of terrorism and other catastrophic events that could result in significant disruptions at our manufacturing facilities or distribution centers of our third-party manufacturers, suppliers and delivery service providers; |
• | compliance with laws and regulations concerning ethical business practices, such as the U.S. Foreign Corrupt Practices Act; and |
• | economic, political or other problems in countries from or through which merchandise is imported. |
Political or financial instability, trade restrictions, tariffs, currency exchange rates, labor conditions, congestion and labor issues at major ports, transport capacity and costs, systems issues, problems in third party distribution and warehousing and other interruptions of the supply chain, compliance with U.S. and foreign laws and regulations and other factors relating to international trade and imported merchandise beyond our control could affect the availability and the price of our inventory. These risks and other factors relating to foreign trade could subject us to liability or hinder our ability to access suitable merchandise on acceptable terms or at all, which could adversely impact our results of operations. In addition, developments in tax policy, such as the imposition of tariffs on imported merchandise or changes to U.S. trade legislation, could have a material adverse effect on our results of operations and liquidity.
Disruptions and congestion at ports through which we import merchandise may increase our costs and/or delay the receipt of goods in our stores, which could adversely impact our profitability, financial position and cash flows.
We ship the majority of our private brand merchandise by ocean to ports in the United States. Our national brand suppliers also ship merchandise by ocean. Disruptions in the operations of ports through which we import our merchandise, including, but not limited to, labor disputes involving work slowdowns, lockouts or strikes, natural disasters, public health crises, and other catastrophic events, could require us and/or our vendors to ship merchandise by air freight or to alternative ports in the United States. Shipping by air is significantly more expensive than shipping by ocean, which could adversely affect our profitability. Similarly, shipping to alternative ports in the United States could result in increased lead times and transportation costs. Disruptions at ports through which we import our goods could also result in unanticipated inventory shortages, which could adversely impact our reputation and our results of operations.
If we cannot meet the continued listing requirements of the NYSE, the NYSE may delist our common stock.
On January 31, 2020, we received written notification from the New York Stock Exchange (“NYSE”) that the average closing price of our common stock had fallen below $1.00 per share over a period of 30 consecutive trading days, which is the minimum average closing share price required to maintain listing under Section 802.01C of the NYSE Listed Company Manual. The notice has no immediate impact on the listing of our common stock, which will continue to be listed and traded on the NYSE during the period allowed to regain compliance, subject to our compliance with other listing standards. Our common stock is permitted to continue to trade on the NYSE under the symbol “JCP,” but will have an added designation of “.BC” to indicate the status of the common stock as “below compliance.”
We informed the NYSE that we intend to cure the deficiency and to return to compliance with the NYSE continued listing requirements. We can regain compliance at any time during the six-month period following receipt of the notification if our common stock has a closing share price of at least $1.00 on the last trading day of any calendar month during the six-month period and also has an average closing share price of at least $1.00 over the 30-trading day period ending on the last trading day of that month.
14
Notwithstanding the foregoing, if we were to determine that we must cure the deficiency by taking an action that would require approval of our stockholders (such as a reverse stock split), we could also regain compliance by (i) obtaining the requisite stockholder approval for such action and (ii) implementing the action promptly thereafter, such that the price of our common stock would promptly exceed $1.00 per share, provided that the price must remain above that level for at least the following 30 trading days. However, there is no assurance that our stockholders would vote for such proposal.
While we are considering various options to cure the deficiency, it may take a significant effort to regain compliance with this continued listing standard, and there can be no assurance that we will be successful.
Our common stock could also be delisted if (i) our average market capitalization over a consecutive 30 trading-day period is less than $15 million, or (ii) our common stock trades at an “abnormally low” price. In either case, we would not have an opportunity to cure the deficiency, and, as a result, our common stock would be suspended from trading on the NYSE immediately, and the NYSE would begin the process to delist our common stock, subject to our right to appeal under NYSE rules. There is no assurance that any appeal we undertake in these or other circumstances would be successful, nor is there any assurance that we will continue to comply with the other NYSE continued listing standards.
Failure to maintain our NYSE listing could negatively impact us and our stockholders by reducing the willingness of investors to hold our common stock because of the resulting decreased price, liquidity and trading of our common stock, limited availability of price quotations, and reduced news and analyst coverage. These developments may also require brokers trading in our common stock to adhere to more stringent rules and may limit our ability to raise capital by issuing additional shares in the future. Delisting may adversely impact the perception of our financial condition and cause reputational harm with investors and parties conducting business with us. In addition, the perceived decreased value of employee equity incentive awards may reduce their effectiveness in encouraging performance and retention.
Our Company’s growth and profitability depend on the levels of consumer confidence and spending.
Our results of operations are sensitive to changes in overall economic and political conditions that impact consumer spending, including discretionary spending. Many economic factors outside of our control, including the housing market, interest rates, recession, inflation and deflation, energy costs and availability, consumer credit availability and terms, consumer debt levels, tax rates and policy, and unemployment trends, influence consumer confidence and spending. The domestic and international political situation and actions also affect consumer confidence and spending. Additional events that could impact our performance include public health crises, terrorist threats and activities, worldwide military and domestic disturbances and conflicts, political instability and civil unrest. Declines in the level of consumer spending could adversely affect our growth and profitability.
Our business is seasonal, which impacts our results of operations.
Our annual earnings and cash flows depend to a great extent on the results of operations for the last quarter of our fiscal year, which includes the holiday season. Our fiscal fourth-quarter results may fluctuate significantly, based on many factors, including holiday spending patterns and weather conditions. This seasonality causes our operating results to vary considerably from quarter to quarter.
Our profitability may be impacted by weather conditions.
Our merchandise assortments reflect assumptions regarding expected weather patterns and our profitability depends on our ability to timely deliver seasonally appropriate inventory. Unseasonable or unexpected weather conditions such as warm temperatures during the winter season or prolonged or extreme periods of warm or cold temperatures could render a portion of our inventory incompatible with consumer needs. Extreme weather or natural disasters could also severely hinder our ability to timely deliver seasonally appropriate merchandise, preclude customers from traveling to our stores, delay capital improvements or cause us to close stores. A reduction in the demand for or supply of our seasonal merchandise could have an adverse effect on our inventory levels and results of operations.
Changes in federal, state or local laws and regulations could increase our expenses and adversely affect our results of operations.
Our business is subject to a wide array of laws and regulations. Government intervention and activism and/or regulatory reform may result in substantial new regulations and disclosure obligations and/or changes in the interpretation of existing laws and regulations, which may lead to additional compliance costs as well as the diversion of our management’s time and attention from strategic initiatives. If we fail to comply with applicable laws and regulations, we could be subject to legal risk, including government enforcement action and class action civil litigation that could disrupt our operations and increase our costs of doing business. Changes in the regulatory environment regarding topics such as privacy and information security, tax policy, product
15
safety, environmental protection, including regulations in response to concerns regarding climate change, collective bargaining activities, minimum wage, wage and hour, and health care mandates, among others, as well as changes to applicable accounting rules and regulations, could also cause our compliance costs to increase and adversely affect our business, financial condition and results of operations.
Legal and regulatory proceedings could have an adverse impact on our results of operations.
Our Company is subject to various legal and regulatory proceedings relating to our business, certain of which may involve jurisdictions with reputations for aggressive application of laws and procedures against corporate defendants. We are impacted by trends in litigation, including class action litigation brought under various consumer protection, employment, and privacy and information security laws. In addition, litigation risks related to claims that technologies we use infringe intellectual property rights of third parties have been amplified by the increase in third parties whose primary business is to assert such claims. Reserves are established, as needed, based on our best estimates of our potential liability. However, we cannot accurately predict the ultimate outcome of any such proceedings due to the inherent uncertainties of litigation. Regardless of the outcome or whether the claims are meritorious, legal and regulatory proceedings may require that we devote substantial time and expense to defend our Company. Unfavorable rulings could result in a material adverse impact on our business, financial condition or results of operations.
Significant changes in discount rates, actual investment return on pension assets, and other factors could affect our earnings, equity, and pension contributions in future periods.
Our earnings may be positively or negatively impacted by the amount of income or expense recorded for our qualified pension plan. Generally accepted accounting principles in the United States of America (GAAP) require that income or expense for the plan be calculated at the annual measurement date using actuarial assumptions and calculations. The most significant assumptions relate to the capital markets, interest rates and other economic conditions. Changes in key economic indicators can change the assumptions. Two critical assumptions used to estimate pension income or expense for the year are the expected long-term rate of return on plan assets and the discount rate. In addition, at the measurement date, we must also reflect the funded status of the plan (assets and liabilities) on the balance sheet, which may result in a significant change to equity through a reduction or increase to other comprehensive income. We may also experience volatility in the amount of the annual actuarial gains or losses recognized as income or expense because we have elected to recognize pension expense using mark-to-market accounting. Although GAAP expense and pension contributions are not directly related, the key economic factors that affect GAAP expense would also likely affect the amount of cash we could be required to contribute to the pension plan. Potential pension contributions include both mandatory amounts required under federal law and discretionary contributions to improve a plan’s funded status.
Our stock price has been and may continue to be volatile.
The market price of our common stock has fluctuated substantially and may continue to fluctuate significantly. Future announcements or disclosures concerning us or any of our competitors, our strategic initiatives, our sales and profitability, our financial condition, any quarterly variations in actual or anticipated operating results or comparable sales, any failure to meet analysts’ expectations and sales of large blocks of our common stock, among other factors, could cause the market price of our common stock to fluctuate substantially. In addition, the stock market has experienced price and volume fluctuations that have affected the market price of many retail and other stocks that have often been unrelated or disproportionate to the operating performance of these companies. This volatility could affect the price at which you could sell shares of our common stock.
Securities class action litigation has often been instituted against companies following periods of volatility in the overall market and in the market price of a company’s securities. Such litigation could result in substantial costs, divert our management’s attention and resources and have an adverse effect on our business, results of operations and financial condition.
The Company’s ability to use net operating loss carryforwards to offset future taxable income for U.S. federal income tax purposes may be limited.
The Company has a federal net operating loss (NOL) of $2.1 billion as of February 1, 2020. Nearly all of these NOL carryforwards (expiring in 2032 through 2034) arose prior to December 31, 2017 and are available to offset future taxable income in full. NOLs recognized after December 31, 2017 are only available to offset up to 80% of the Company’s future taxable income.
Section 382 of the Internal Revenue Code of 1986, as amended (the Code), imposes an annual limitation on the amount of taxable income that may be offset by a corporation's NOLs if the corporation experiences an “ownership change” as defined in Section 382 of the Code. An ownership change occurs when the Company’s “five-percent shareholders” (as defined in
16
Section 382 of the Code) collectively increase their ownership in the Company by more than 50 percentage points (by value) over a rolling three-year period. Additionally, various states have similar limitations on the use of state NOLs following an ownership change.
If an ownership change occurs, the amount of the taxable income for any post-change year that may be offset by a pre-change loss is subject to an annual limitation that is cumulative to the extent it is not all utilized in a year. This limitation is derived by multiplying the fair market value of the Company stock as of the ownership change by the applicable federal long-term tax-exempt rate, which was 1.63% at February 1, 2020. To the extent that a company has a net unrealized built-in gain at the time of an ownership change, which is realized or deemed recognized during the five-year period following the ownership change, there is an increase in the annual limitation for each of the first five-years that is cumulative to the extent it is not all utilized in a year.
The Company has an ongoing study of the rolling three-year testing periods. Based upon the elections the Company has made and the information that has been filed with the Securities and Exchange Commission through February 1, 2020, the Company has not had a Section 382 ownership change through February 1, 2020.
If an ownership change should occur in the future, the Company’s ability to use the NOL to offset future taxable income will be subject to an annual limitation and will depend on the amount of taxable income generated by the Company in future periods. There is no assurance that the Company will be able to fully utilize the NOL and the Company could be required to record an additional valuation allowance related to the amount of the NOL that may not be realized, which could impact the Company’s result of operations.
We believe that these NOL carryforwards are a valuable asset for us. Consequently, we have a stockholders' rights agreement (Amended Rights Agreement) in place, which was approved by the Company’s stockholders, to protect our NOLs during the effective period of the Amended Rights Agreement. On January 24, 2020, the term of the Amended Rights Agreement was extended to January 25, 2023. The Company expects to submit the extension of the Amended Rights Agreement to stockholders for approval at its 2020 annual meeting of stockholders. If stockholders do not approve the extension of the Amended Rights Agreement, the Amended Rights Agreement will terminate.
Although the Amended Rights Agreement is intended to reduce the likelihood of an “ownership change” that could adversely affect us, there is no assurance that the restrictions on transferability in the rights plan will prevent all transfers that could result in such an “ownership change”.
The Amended Rights Agreement could make it more difficult for a third party to acquire, or could discourage a third party from acquiring, our Company or a large block of our common stock. A third party that acquires 4.9% or more of our common stock could suffer substantial dilution of its ownership interest under the terms of the Amended Rights Agreement through the issuance of common stock or common stock equivalents to all stockholders other than the acquiring person.
The foregoing provisions may adversely affect the marketability of our common stock by discouraging potential investors from acquiring our stock. In addition, these provisions could delay or frustrate the removal of incumbent directors and could make more difficult a merger, tender offer or proxy contest involving us, or impede an attempt to acquire a significant or controlling interest in us, even if such events might be beneficial to us and our stockholders.
Item 1B. Unresolved Staff Comments
None.
17
Item 2. Properties
At February 1, 2020, we operated 846 department stores throughout the continental United States, Alaska and Puerto Rico, of which 387 were owned, including 110 stores located on ground leases. The following table lists the number of stores operating by state as of February 1, 2020:
Alabama | 15 | Maine | 5 | Oklahoma | 14 | |||||
Alaska | 1 | Maryland | 15 | Oregon | 8 | |||||
Arizona | 21 | Massachusetts | 9 | Pennsylvania | 27 | |||||
Arkansas | 13 | Michigan | 33 | Rhode Island | 2 | |||||
California | 71 | Minnesota | 15 | South Carolina | 13 | |||||
Colorado | 16 | Mississippi | 9 | South Dakota | 3 | |||||
Connecticut | 7 | Missouri | 23 | Tennessee | 21 | |||||
Delaware | 3 | Montana | 5 | Texas | 82 | |||||
Florida | 52 | Nebraska | 8 | Utah | 8 | |||||
Georgia | 21 | Nevada | 6 | Vermont | 4 | |||||
Idaho | 8 | New Hampshire | 9 | Virginia | 22 | |||||
Illinois | 29 | New Jersey | 11 | Washington | 19 | |||||
Indiana | 22 | New Mexico | 10 | West Virginia | 8 | |||||
Iowa | 11 | New York | 38 | Wisconsin | 10 | |||||
Kansas | 14 | North Carolina | 20 | Wyoming | 3 | |||||
Kentucky | 22 | North Dakota | 5 | Puerto Rico | 6 | |||||
Louisiana | 13 | Ohio | 36 | |||||||
Total square feet | 93.5 million | |||||||||
We are party to a $1.688 billion senior secured term loan credit facility and the issuer of $500 million aggregate principal amount of senior secured notes that are secured by mortgages on certain real property of the Company, in addition to liens on substantially all personal property of the Company, subject to certain exclusions set forth in the security documents relating to the term loan credit facility and the senior secured notes. The real property subject to mortgages under the term loan credit facility and the indenture governing the senior secured notes includes our distribution centers and certain of our stores.
At February 1, 2020, our supply chain network operated 11 facilities with multiple types of distribution activities, including jcp.com fulfillment centers (direct to customers), store merchandise distribution centers (stores) and regional warehouses (regional) as indicated in the following table:
Square Footage | |||||||
Leased/Owned | Number | Primary Function(s) | (in thousands) | ||||
Owned | 6 | direct to customers, stores, regional | 9,266 | ||||
Leased | 5 | stores, regional | 2,529 | ||||
11,795 | |||||||
Item 3. Legal Proceedings
The matters under the caption "Litigation" in Note 22 of the Notes to Consolidated Financial Statements included in this Form 10-K are incorporated herein by reference.
Item 4. Mine Safety Disclosures
Not applicable.
18
PART II
Item 5. Market for Registrant’s Common Equity, Related Stockholder Matters and Issuer Purchases of Equity Securities
Market for Registrant’s Common Equity
Our common stock is traded principally on the New York Stock Exchange (NYSE) under the symbol “JCP.” The number of stockholders of record at March 16, 2020, was 20,557. In addition to common stock, we have authorized 25 million shares of preferred stock, of which no shares were issued and outstanding at February 1, 2020.
Since May 2012, the Company has not paid a dividend. Under our senior secured term loan credit facility and senior secured asset-based credit facility, we are subject to covenants restricting our ability to pay cash dividends.
Additional information relating to the common stock and preferred stock is included in this Annual Report on Form 10-K in the Consolidated Statements of Stockholders’ Equity and in Note 14 to the Consolidated Financial Statements.
Issuer Purchases of Securities
No repurchases of common stock were made during the fourth quarter of 2019 and no amounts are authorized for share repurchases as of February 1, 2020.
Recent Sales of Unregistered Securities
On May 2, 2019, the Company granted a compensatory equity award of 284,091 time-based restricted stock units (TBRSUs) to Steve Whaley, the Company's senior vice president, principal accounting officer and controller using the exemption rule under Rule 506 of Regulation D.
On April 11, 2019, the Company granted a compensatory equity award of 1,209,678 TBRSUs to Bill Wafford, the Company's executive vice president, chief financial officer using the exemption rule under Rule 506 of Regulation D.
19
Five-Year Total Stockholder Return Comparison
The following presentation compares our cumulative stockholder returns for the past five fiscal years with the returns of the S&P 500 Stock Index and the S&P 500 Retail Index for Department Stores over the same period. A list of these companies follows the graph below. The graph assumes $100 invested at the closing price of our common stock on the NYSE and each index as of the last trading day of our fiscal year 2014 and assumes that all dividends, if applicable, were reinvested on the date paid. The points on the graph represent fiscal year-end amounts based on the last trading day of each fiscal year. The following graph and related information shall not be deemed “soliciting material” or to be “filed” with the Securities and Exchange Commission, nor shall such information be incorporated by reference into any filing under the Securities Act of 1933 or Securities Exchange Act of 1934, each as amended, except to the extent that we specifically incorporate it by reference into such filing.
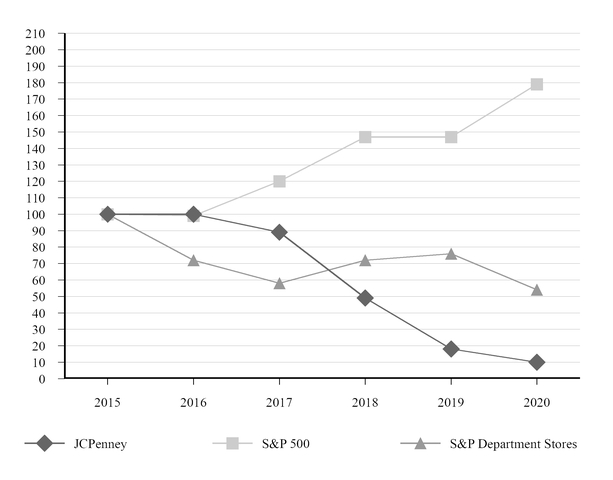
S&P Department Stores: Macy’s, Kohl’s, Nordstrom |
2015 | 2016 | 2017 | 2018 | 2019 | 2020 | |||||||
JCPenney | $100 | $100 | $89 | $49 | $18 | $10 | ||||||
S&P 500 | 100 | 99 | 120 | 147 | 147 | 179 | ||||||
S&P Department Stores | 100 | 72 | 58 | 72 | 76 | 54 | ||||||
The stockholder returns shown are neither determinative nor indicative of future performance.
20
Item 6. Selected Financial Data
Effective February 3, 2019, we adopted Accounting Standards Update (ASU) 2016-02, Leases (Topic 842), as amended. The Company adopted the provisions of ASU 2016-02 using the modified retrospective adoption method and the simplified transition option. As a result, prior period financial position information has not been restated to reflect the new accounting standard. See Note 3 to the Consolidated Financial Statements for further information.
As of February 4, 2018, we adopted Accounting Standards Codification (ASC) Topic 606 (ASC 606), Revenue from Contracts with Customers, and ASU 2017-07, Compensation -- Retirement Benefits (Topic 715): Improving the Presentation of Net Periodic Cost and Net Periodic Postretirement Benefit Cost. As a result, certain prior period results have been adjusted due to the transition method applied.
Five-Year Financial Summary
($ in millions, except per share data) | 2019 | 2018 | 2017 | 2016 | 2015 | (1) | ||||||||||||||
Results for the year | ||||||||||||||||||||
Total net sales | $ | 10,716 | $ | 11,664 | $ | 12,554 | $ | 12,571 | $ | 12,625 | ||||||||||
Sales percent increase/(decrease): | ||||||||||||||||||||
Total net sales | (8.1 | )% | (7.1 | )% | (2) | (0.1 | )% | (2) | (0.4 | )% | (3) | 3.0 | % | |||||||
Comparable store sales (4) | (7.7 | )% | (3.1 | )% | 0.1 | % | 0.0 | % | 4.5 | % | ||||||||||
Operating income/(loss) | (8 | ) | (6 | ) | 212 | 324 | 4 | |||||||||||||
As a percent of sales | (0.1 | )% | (0.1 | )% | 1.7 | % | 2.6 | % | 0.0 | % | ||||||||||
Net income/(loss) from continuing operations | (268 | ) | (255 | ) | (118 | ) | (17 | ) | (513 | ) | ||||||||||
Adjusted EBITDA (non-GAAP) (5) | 583 | 568 | 935 | 926 | 654 | |||||||||||||||
Adjusted net income/(loss) from continuing operations (non-GAAP) (5) | (257 | ) | (296 | ) | 31 | (59 | ) | (376 | ) | |||||||||||
Per common share | ||||||||||||||||||||
Earnings/(loss) per share from continuing operations, diluted | $ | (0.84 | ) | $ | (0.81 | ) | $ | (0.38 | ) | $ | (0.06 | ) | $ | (1.68 | ) | |||||
Adjusted earnings/(loss) per share from continuing operations, diluted (non-GAAP) (5) | $ | (0.80 | ) | $ | (0.94 | ) | $ | 0.10 | $ | (0.19 | ) | $ | (1.23 | ) | ||||||
Financial position and cash flow | ||||||||||||||||||||
Total assets | $ | 7,989 | $ | 7,721 | $ | 8,454 | $ | 9,160 | $ | 9,211 | ||||||||||
Cash and cash equivalents | 386 | 333 | 458 | 887 | 900 | |||||||||||||||
Total debt (6) | 3,721 | 3,808 | 4,012 | 4,602 | 4,769 | |||||||||||||||
Free cash flow (non-GAAP) (5) | 145 | 111 | 213 | 3 | 131 | |||||||||||||||
(1) | We have chosen to not adjust 2015 results for ASC 606, as permitted. Therefore, 2015 only reflects adjusted results for ASU 2017-07. |
(2) | Includes the effect of the 53rd week in 2017. Excluding sales of $147 million for the 53rd week in 2017, total net sales decreased 6.0% in 2018 and 1.3% in 2017. |
(3) | Calculation of increase/(decrease) of Total net sales as presented. |
(4) | Comparable store sales are presented on a 52-week basis and include sales from all stores, including sales from services, that have been open for 12 consecutive full fiscal months and eCommerce sales. Stores closed for an extended period are not included in comparable store sales calculations, while stores remodeled and minor expansions not requiring store closure remain in the calculations. Certain items, such as sales return estimates and store liquidation sales, are excluded from the Company's calculation. Our definition and calculation of comparable store sales may differ from other companies in the retail industry. |
(5) | See Non-GAAP Financial Measures herein for additional information and reconciliation to the most directly comparable GAAP financial measure. |
(6) | Total debt includes long-term debt, net of unamortized debt issuance costs, including current maturities and any borrowings under our revolving credit facility. |
21
Five-Year Operations Summary
2019 | 2018 | 2017 | 2016 | 2015 | ||||||||||||||||
Number of department stores: | ||||||||||||||||||||
Beginning of year | 864 | 872 | 1,013 | 1,021 | 1,062 | |||||||||||||||
Openings | — | 1 | — | 1 | — | |||||||||||||||
Closings | (18 | ) | (9 | ) | (141 | ) | (9 | ) | (41 | ) | ||||||||||
End of year | 846 | 864 | 872 | 1,013 | 1,021 | |||||||||||||||
Gross selling space (square feet in millions) | 93.5 | 95.0 | 95.6 | 103.3 | 104.7 | |||||||||||||||
Sales per gross square foot (1) | $ | 114 | $ | 122 | $ | 127 | $ | 121 | $ | 120 | ||||||||||
Sales per net selling square foot (1) | $ | 159 | $ | 170 | $ | 177 | $ | 166 | $ | 165 | ||||||||||
(1) | Calculation includes the sales, including commission revenue, and square footage of department stores, including selling space allocated to services and licensed departments, that were open for the full fiscal year, as well as eCommerce sales. |
22
Item 7. Management’s Discussion and Analysis of Financial Condition and Results of Operations
Overview
The following discussion, which presents our results, should be read in conjunction with the accompanying Consolidated Financial Statements and notes thereto, along with the Five-Year Financial and Operations Summaries, the risk factors and the cautionary statement regarding forward-looking information. Unless otherwise indicated, all references in this Management’s Discussion and Analysis (MD&A) related to earnings/(loss) per share (EPS) are on a diluted basis and all references to years relate to fiscal years rather than to calendar years.
JCPenney is a national omnichannel retailer operating through our 846 stores in 49 states and Puerto Rico as well as eCommerce channels, which consist of our website at www.jcp.com and our JCPenney mobile application. We offer a wide range of apparel and home merchandise from a portfolio of private, exclusive and national brands. We operate in a highly competitive retail environment, competing with brick and mortar stores, as well as omnichannel and exclusively eCommerce businesses.
Plan for Renewal
In November 2019, the Company announced its Plan for Renewal to return JCPenney to sustainable, profitable growth. Coupled with our deep understanding of the customer, these five components of our Plan for Renewal guide everything we do:
• | Offer compelling merchandise; |
• | Deliver an engaging experience; |
• | Drive traffic; |
• | Fuel growth; and |
• | Build a results-minded culture. |
We plan to transform our merchandising efforts centered around Offering Compelling Merchandise within the five lifestyles of how our customers, in particular the All-in Shopping Enthusiast, live and want to shop:
To Deliver an Engaging Experience, we used our extensive research and customer insights to create test and learns which featured occasion merchandising, improved visual merchandising, and a redesigned shopping experience. We expanded the learnings from these tests to over 90 stores. In addition, in November, we opened our Brand-Defining store to create an inspiring, shared experience showcasing compelling products and brands along with differentiating elements. It is the fullest articulation of our customer commitment - and the manifestation of the research, planning, and hard work that characterized 2019. We are measuring over 100 touchpoints in this lab store to inform our future actions.
To Drive Traffic, we have three distinct work streams: personalization, our affinity programs, and improvements to our eCommerce site -- which we consider our flagship store. Additionally, we strengthened our execution on fulfillment, including shipping from stores and picking up online orders in stores, which is helping us meet our increasing fulfillment demands.
To Fuel Growth, we are developing a more efficient operating model, reinvesting in value-creating activities, and establishing a capital structure that supports the long-term needs of the company.
Lastly, we are developing a Results-Minded Culture focused on accountability, urgency, and innovative problem solving at all levels of the organization, and we are building a culture that connects all associates to achievements larger than the individual.
23
2019 Summary
▪ | Total net sales were $10,716 million, a decrease of 8.1% as compared to 2018, and comparable store sales decreased 7.7% for the year. Adjusted comparable store sales, which exclude the impact of the Company's exit from major appliance and in-store furniture categories, decreased 5.6% for the year. See "Non-GAAP Financial Measures" for a discussion of this non-GAAP measure and reconciliation to its most directly comparable GAAP financial measure and further information on its uses and limitations. |
▪ | Credit income and other was $451 million compared to $355 million in 2018. The increase was due to improved performance of the credit portfolio. |
▪ | Cost of goods sold, which excludes depreciation and amortization, as a percentage of Total net sales was 65.4% compared to 67.5% last year. The improvement as a rate of net sales was primarily driven by an increase in both store and online selling margins, improved shrinkage results and the exit from the major appliance and in-store furniture categories earlier this year. |
▪ | SG&A expenses decreased $11 million, or 0.3%, as compared to 2018. The decrease in SG&A dollars was primarily due to lower advertising and store controllable expenses, which were offset by slightly higher incentive compensation. |
▪ | Net loss was $268 million, or $0.84 per share, compared to a net loss of $255 million, or $0.81 per share, in 2018. Results for 2019 included the following amounts that are not directly related to our ongoing core business operations: |
▪ | $48 million, or $(0.15) per share, of restructuring and management transition charges; |
▪ | $35 million, or $0.11 per share, for other components of net periodic pension and postretirement benefit income; |
▪ | $1 million, or $0.00 per share, for the gain on extinguishment of debt; and |
▪ | $1 million, or $0.00 per share, for the net gain on the sale of non-operating assets. |
▪ | Adjusted net loss was $257 million, or $(0.80) per share, compared to adjusted net loss of $296 million, or $(0.94) per share, in 2018. See "Non-GAAP Financial Measures" for a discussion of this non-GAAP measure and reconciliation to its most directly comparable GAAP financial measure and further information on its uses and limitations. |
▪ | Adjusted EBITDA was $583 million for 2019 compared to adjusted EBITDA of $568 million in 2018. See "Non-GAAP Financial Measures" for a discussion of this non-GAAP measure and reconciliation to its most directly comparable GAAP financial measure and further information on its uses and limitations. |
24
Results of Operations
Effective February 3, 2019, we adopted ASU 2016-02, Leases (Topic 842), as amended. The Company adopted the provisions of the new lease standard using the modified retrospective adoption method and the simplified transition option. See Note 3 to the Consolidated Financial Statements for further information.
Three-Year Comparison of Operating Performance
(in millions, except per share data) | 2019 | 2018 | 2017 | |||||||||
Total net sales | $ | 10,716 | $ | 11,664 | $ | 12,554 | ||||||
Credit income and other | 451 | 355 | 319 | |||||||||
Total revenues | 11,167 | 12,019 | 12,873 | |||||||||
Total net sales percent increase/(decrease) from prior year | (8.1 | )% | (7.1 | )% | (1) | (0.1 | )% | (1) | ||||
Comparable store sales increase/(decrease) (2) | (7.7 | )% | (3.1 | )% | 0.1 | % | ||||||
Adjusted comparable store sales increase/(decrease) (non-GAAP) (3) | (5.6 | )% | (2.3 | )% | (1.9 | )% | ||||||
Costs and expenses/(income): | ||||||||||||
Cost of goods sold (exclusive of depreciation and amortization shown separately below) | 7,013 | 7,870 | 8,208 | |||||||||
Selling, general and administrative | 3,585 | 3,596 | 3,845 | |||||||||
Depreciation and amortization | 544 | 556 | 570 | |||||||||
Real estate and other, net | (15 | ) | (19 | ) | (146 | ) | ||||||
Restructuring and management transition | 48 | 22 | 184 | |||||||||
Total costs and expenses | 11,175 | 12,025 | 12,661 | |||||||||
Operating income/(loss) | (8 | ) | (6 | ) | 212 | |||||||
As a percent of sales | (0.1 | )% | (0.1 | )% | 1.7 | % | ||||||
Other components of net periodic pension and postretirement benefit cost/(income) | (35 | ) | (71 | ) | 98 | |||||||
(Gain)/loss on extinguishment of debt | (1 | ) | 23 | 33 | ||||||||
Net interest expense | 293 | 313 | 325 | |||||||||
Income/(loss) before income taxes | (265 | ) | (271 | ) | (244 | ) | ||||||
Income tax (benefit)/expense | 3 | (16 | ) | (126 | ) | |||||||
Net income/(loss) | $ | (268 | ) | $ | (255 | ) | $ | (118 | ) | |||
Adjusted EBITDA (3) | $ | 583 | $ | 568 | $ | 935 | ||||||
Adjusted net income/(loss) (non-GAAP) (3) | $ | (257 | ) | $ | (296 | ) | $ | 31 | ||||
Diluted EPS | $ | (0.84 | ) | $ | (0.81 | ) | $ | (0.38 | ) | |||
Adjusted diluted EPS (non-GAAP) (3) | $ | (0.80 | ) | $ | (0.94 | ) | $ | 0.10 | ||||
Weighted average shares used for diluted EPS | 320.2 | 315.7 | 311.1 | |||||||||
(1) | Includes the effect of the 53rd week in 2017. Excluding sales of $147 million for the 53rd week in 2017, total net sales decreased 6.0% in 2018 and 1.3% in 2017. |
(2) | Comparable store sales are presented on a 52-week basis and include sales from all stores, including sales from services, that have been open for 12 consecutive full fiscal months and eCommerce sales. Stores closed for an extended period are not included in comparable store sales calculations, while stores remodeled and minor expansions not requiring store closure remain in the calculations. Certain items, such as sales return estimates and store liquidation sales, are excluded from the Company's calculation. Our definition and calculation of comparable store sales may differ from other companies in the retail industry. |
(3) | See discussion herein of this non-GAAP financial measure and reconciliation to its most directly comparable GAAP financial measure. |
25
2019 Compared to 2018
Total Net Sales
Our year-to-year change in total net sales is comprised of (a) sales from new stores net of closings and relocations, referred to as non-comparable store sales, (b) sales of stores opened in both years as well as eCommerce sales, referred to as comparable store sales and (c) other revenue adjustments such as sales return estimates and store liquidation sales. We consider comparable store sales to be a key indicator of our current performance; measuring the growth in sales and sales productivity of existing stores. Positive comparable store sales contribute to greater leveraging of operating costs, particularly payroll and occupancy costs, while negative comparable store sales contribute to de-leveraging of costs. Comparable store sales also have a direct impact on our total net sales and the level of cash flow.
2019 | 2018 | |||||||
Total net sales (in millions) | $ | 10,716 | $ | 11,664 | ||||
Sales percent increase/(decrease) | ||||||||
Total net sales | (8.1 | )% | (7.1 | )% | (1) | |||
Comparable store sales (2) | (7.7 | )% | (3.1 | )% | ||||
Adjusted comparable store sales increase/(decrease) (non-GAAP) (3) | (5.6 | )% | (2.3 | )% | ||||
Sales per gross square foot (4) | $ | 114 | $ | 122 | ||||
(1) | Includes the effect of the 53rd week in 2017. Excluding sales of $147 million for the 53rd week in 2017, total net sales decreased 6.0% in 2018. |
(2) | Comparable store sales are presented on a 52-week basis and include sales from all stores, including sales from services, that have been open for 12 consecutive full fiscal months and eCommerce sales. Stores closed for an extended period are not included in comparable store sales calculations, while stores remodeled and minor expansions not requiring store closure remain in the calculations. Certain items, such as sales return estimates and store liquidation sales, are excluded from the Company's calculation. Our definition and calculation of comparable store sales may differ from other companies in the retail industry. |
(3) | See discussion herein of this non-GAAP financial measure and reconciliation to its most directly comparable GAAP financial measure. |
(4) | Calculation includes the sales, including commission revenue, and square footage of department stores, including selling space allocated to services and licensed departments, that were open for the full fiscal year, as well as eCommerce sales. |
The following table provides the components of the net sales decrease:
($ in millions) | 2019 | ||
Comparable store sales increase/(decrease) | $ | (864 | ) |
Sales related to closed stores | (84 | ) | |
Total net sales increase/(decrease) | $ | (948 | ) |
As our omnichannel strategy, which includes our stores, our website at jcp.com, or our JCPenney mobile app, continues to mature, it is increasingly difficult to distinguish between a store sale and an eCommerce sale. Because we no longer have a clear distinction between store sales and eCommerce sales, we do not separately report eCommerce sales. Below is a list of some of our omnichannel activities:
• | Stores increase eCommerce sales by providing customers opportunities to view, touch and/or try on physical merchandise before ordering online or through the JCPenney app. |
• | Our website and JCPenney app increase store sales as in-store customers have often pre-shopped online or the JCPenney app before shopping in the store, including verification of which stores have online merchandise in stock. |
• | Most eCommerce purchases are easily returned in our stores. |
• | JCPenney Rewards can be earned and redeemed through all sales channels. |
• | In-store customers can order from our website with the assistance of associates in our stores or they can shop via the JCPenney app while inside the store. |
• | Customers who utilize the JCPenney app can receive mobile coupons to use when they check out both online or in our stores. |
• | eCommerce orders can be shipped from a dedicated jcp.com fulfillment center, a store, a regional warehouse, directly from vendors or any combination of the above. |
26
• | Certain categories of store inventory can be accessed and purchased online or through the JCPenney app and shipped directly to the customer's home from the store. |
• | eCommerce orders can be shipped to stores for customer pick up. |
• | "Buy online and pick up in store" is now available in all of our stores. |
For 2019, average unit retail selling price increased, while transaction counts and units per transaction decreased as compared to the prior year. On a geographic basis, all regions experienced comparable store sales decreases for 2019 compared to the prior year. During 2019, all merchandise divisions experienced comparable store sales decreases with Jewelry, Women's apparel and Men's apparel and accessories being our best performing divisions.
During both 2019 and 2018, private brand merchandise comprised 46% of total merchandise sales. Exclusive brand merchandise comprised 6% and 7% of total merchandise sales in 2019 and 2018, respectively.
Credit Income and Other
Our private label credit card and co-branded MasterCard® programs are owned and serviced by Synchrony. Under our agreement, we receive cash payments from Synchrony based upon the performance of the credit card portfolio. We participate in the programs by providing marketing promotions designed to increase the use of each card, including enhanced marketing offers for cardholders. Additionally, we accept payments in our stores from cardholders who prefer to pay in person when they are shopping in our locations. For 2019 and 2018, we recognized income of $451 million and $355 million, respectively, pursuant to our agreement with Synchrony. The increase in 2019 resulted from the improved loss performance of the underlying credit portfolio and the associated reserve changes.
Cost of Goods Sold
Cost of goods sold, exclusive of depreciation and amortization, improved to 65.4% of sales in 2019, or 210 basis points, compared to 67.5% in 2018. On a dollar basis, cost of goods sold decreased $857 million, or 10.9%, to $7,013 million in 2019 compared to $7,870 million in the prior year. The net 210 basis point improvement was primarily driven by an increase in selling margins, improved shrinkage results and the exit from the major appliance and in-store furniture categories earlier in the year.
SG&A Expenses
SG&A expenses declined $11 million to $3,585 million in 2019 compared to $3,596 million in 2018. The decrease in SG&A dollars was primarily due to lower advertising and store controllable expenses, which were offset by slightly higher incentive compensation. As a percentage of Total net sales, SG&A expenses were 33.5% compared to 30.8% in the prior year. The net 270 basis point increase was primarily driven by de-leveraging of SG&A expenses as a result of our negative comparable store sales performance. During 2018, SG&A included approximately $73 million in expense offsets related to the sale of leasehold interests as well as the reversal of previously accrued risk insurance reserves. Additionally, due to the implementation of the new lease accounting standard, approximately $20 million in expenses in 2019 related to the Company's home office lease, which were previously classified as elements of interest and depreciation and amortization, are now included in SG&A.
Depreciation and Amortization Expenses
Depreciation and amortization expense in 2019 decreased $12 million to $544 million, or 2.2%, compared to $556 million in 2018. This decrease is primarily a result of the implementation of the new lease accounting standard as discussed above.
Real Estate and Other, Net
Real estate and other primarily includes net gains from the sale of facilities and equipment that are no longer used in operations, asset impairments, accruals for certain litigation and other non-operating charges and credits. Prior to 2019, real estate and other also consisted of ongoing income from our real estate subsidiaries. During the first quarter of 2014, we formed a joint venture to develop property adjacent to our home office facility in Plano, Texas (Home Office Land Joint Venture) in which we contributed approximately 220 acres of property. The joint venture was formed to develop the contributed property and our proportional share of the joint venture's activities is recorded in Real estate and other, net. During the third quarter of 2018, we sold our interest to the other partner and are no longer a member of the joint venture.
27
The composition of real estate and other, net was as follows:
($ in millions) | 2019 | 2018 | ||||||
Net gain from sale of non-operating assets | $ | (1 | ) | $ | — | |||
Investment income from Home Office Land Joint Venture | — | (4 | ) | |||||
Net gain from sale of operating assets | (8 | ) | (67 | ) | ||||
Impairments | — | 52 | ||||||
Other | (6 | ) | — | |||||
Total expense/(income) | $ | (15 | ) | $ | (19 | ) | ||
See Note 19 to the Consolidated Financial Statements for further discussion of real estate and other, net.
Restructuring and Management Transition
The composition of restructuring and management transition charges was as follows:
($ in millions) | 2019 | 2018 | ||||||
Home office and stores | $ | 43 | $ | 13 | ||||
Management transition | 5 | 9 | ||||||
Total | $ | 48 | $ | 22 | ||||
In 2019 and 2018, we recorded $43 million and $13 million, respectively, of costs to reduce our store and home office expenses. Costs during 2019 include store impairments of $19 million and accelerated depreciation of $4 million related to announced store closures, employee termination benefits of $10 million, store related closing costs of $4 million and advisory costs of $6 million. Costs during 2018 include employee termination benefits of $10 million, store related closing costs of $6 million and a $3 million net gain of the sales of certain closed stores.
Other Components of Net Periodic Pension and Postretirement Benefit Cost/(Income)
Other components of net periodic pension and postretirement benefit cost/(income) was $(35) million in 2019 compared to $(71) million in 2018. The decrease in 2019 resulted from recognition of certain settlement accounting charges and a decline in the discount rate in determining pension obligations.
(Gain)/Loss on Extinguishment of Debt
During the first quarter of 2018, we settled cash tender offers with respect to portions of our outstanding 8.125% Senior Notes Due 2019 (2019 Notes) and 5.65% Senior Notes Due 2020 (2020 Notes), resulting in a loss on extinguishment of debt of $23 million.
Net Interest Expense
Net interest expense consists principally of interest expense on long-term debt, net of interest income earned on cash and cash equivalents. In 2019, net interest expense was $293 million, a decrease of $20 million, or 6.4%, from $313 million in 2018. The reduction in net interest expense is due to lower debt levels in 2019 compared to 2018 and as a result of the implementation of the new lease accounting standard as discussed above.
Income Taxes
Our deferred tax assets, which include the future tax benefits of our net operating loss carryforwards, are subject to a valuation allowance. At February 1, 2020, the federal and state valuation allowances were $614 million and $255 million, respectively. Our deferred tax assets include the impact of re-measurement on U. S. deferred taxes at the lower enacted corporate tax rate resulting from U. S. tax reform enacted in December 2017. Future book pre-tax losses will require additional valuation allowances to offset the deferred tax assets created. Until such time that we achieve sufficient profitability to allow removal of most of our valuation allowance, utilization of our loss carryforwards will result in a corresponding decrease in the valuation allowance and offset our tax provision dollar for dollar.
We are required to allocate a portion of our tax provision between operating losses and Accumulated other comprehensive income/(loss). In 2019, the Company did not recognize an income tax benefit from any of its operating loss and incurred an actuarial loss in Other comprehensive income/(loss), the tax benefit on which was fully offset by a valuation allowance within Other comprehensive income/(loss). Accordingly, included in the total valuation allowance of $869 million is $189 million of valuation allowance which offsets the deferred tax benefit attributable to the actuarial loss reported in Other comprehensive income/(loss).
28
For 2019, we recorded net tax expense of $3 million. Tax expense includes $4 million related to the amortization of certain indefinite-lived intangible assets, $9 million for federal, state and foreign jurisdictions where loss carryforwards are limited or unavailable offset by $9 million to adjust the valuation allowance and $1 million for state audit settlements.
For 2018, we recorded a net tax benefit of $16 million. Tax benefit includes $16 million to adjust the valuation allowance, $1 million for state audit settlements and $11 million related to other comprehensive income offset by tax expense of $4 million related to the amortization of certain indefinite-lived intangible assets, $7 million for federal, state and foreign jurisdictions where loss carryforwards are limited or unavailable and $1 million for state law changes.
Net Income/(Loss) and Adjusted Net Income/(Loss) (non-GAAP)
In 2019, we reported a loss of $268 million, or $0.84 per share, compared with a loss of $255 million, or $0.81 per share, in 2018. Excluding the impact of restructuring and management transition charges, other components of periodic pension and postretirement benefit cost/(income), the (gain)/loss on extinguishment of debt, the proportional share of net income from joint venture, the tax impact resulting from other comprehensive income allocation, and the impact of tax reform, adjusted net income/(loss) (non-GAAP) was a loss of $257 million, or $0.80 per share, in 2019 compared to a loss of $296 million, or $0.94 per share, in 2018.
The higher net loss in 2019 was driven primarily by the higher income tax expense in 2019 as the loss before income taxes improved from 2018.
2018 Compared to 2017
For a comparison of our results of operations for 2018 and 2017, see “Part II, Item 7. Management’s Discussion and Analysis of Financial Condition and Results of Operations” of our annual report on Form 10-K for the fiscal year ended February 2, 2019, filed with the SEC on March 19, 2019.
Non-GAAP Financial Measures
We report our financial information in accordance with generally accepted accounting principles in the United States (GAAP). However, we present certain financial measures and ratios identified as non-GAAP under the rules of the Securities and Exchange Commission (SEC) to assess our results. We believe the presentation of these non-GAAP financial measures and ratios is useful in order to better understand our financial performance as well as to facilitate the comparison of our results to the results of our peer companies. In addition, management uses these non-GAAP financial measures and ratios to assess the results of our operations. It is important to view non-GAAP financial measures in addition to, rather than as a substitute for, those measures and ratios prepared in accordance with GAAP. We have provided reconciliations of the most directly comparable GAAP measures to our non-GAAP financial measures presented.
The following non-GAAP financial measures are adjusted to exclude restructuring and management transition charges, other components of net periodic pension and postretirement benefit cost/(income), the (gain)/loss on extinguishment of debt, the net gain on the sale of non-operating assets, the proportional share of net income from our joint venture formed to develop the excess property adjacent to our home office facility in Plano, Texas (Home Office Land Joint Venture), the tax impact for the allocation of income taxes to other comprehensive income items related to our pension plans and interest rate swaps and the impact of tax reform. Unlike other operating expenses, restructuring and management transition charges, other components of net periodic pension and postretirement benefit cost/(income), the (gain)/loss on extinguishment of debt, the net gain on the sale of non-operating assets, the proportional share of net income from the Home Office Land Joint Venture, the tax impact for the allocation of income taxes to other comprehensive income items related to our pension plans and interest rate swaps and the impact of tax reform are not directly related to our ongoing core business operations, which consist of selling merchandise and services to consumers through our department stores and our website at jcp.com. Further, our non-GAAP adjustments are for non-operating associated activities such as closed store impairments included in restructuring and management transition charges and such as joint venture earnings from the sale of excess land included in the proportional share of net income from our Home Office Land Joint Venture. Additionally, other components of net periodic pension and postretirement benefit cost/(income) is determined using numerous complex assumptions about changes in pension assets and liabilities that are subject to factors beyond our control, such as market volatility. We believe it is useful for investors to understand the impact of restructuring and management transition charges, other components of net periodic pension and postretirement benefit cost/(income), the (gain)/loss on extinguishment of debt, the net gain on the sale of non-operating assets, the proportional share of net income from the Home Office Land Joint Venture, the tax impact for the allocation of income taxes to other comprehensive income items related to our pension plans and interest rate swaps and the impact of tax reform on our financial results and therefore are presenting the following non-GAAP financial measures: (1) adjusted EBITDA; (2) adjusted net income/(loss)
29
from continuing operations; (3) adjusted earnings/(loss) per share-diluted from continuing operations; and (4) adjusted comparable store sales increase/(decrease).
Adjusted EBITDA. The following table reconciles net income/(loss), the most directly comparable GAAP measure, to adjusted EBITDA, which is a non-GAAP financial measure:
($ in millions) | 2019 | 2018 | 2017 | 2016 | 2015 | ||||||||||||||
Net income/(loss) from continuing operations | $ | (268 | ) | $ | (255 | ) | $ | (118 | ) | $ | (17 | ) | $ | (513 | ) | ||||
Add: Net interest expense | 293 | 313 | 325 | 363 | 405 | ||||||||||||||
Add: (Gain)/loss on extinguishment of debt | (1 | ) | 23 | 33 | 30 | 10 | |||||||||||||
Add: Income tax expense/(benefit) | 3 | (16 | ) | (126 | ) | 1 | 9 | ||||||||||||
Add: Depreciation and amortization | 544 | 556 | 570 | 609 | 616 | ||||||||||||||
Add: Restructuring and management transition charges | 48 | 22 | 184 | 26 | 84 | ||||||||||||||
Add: Other components of net periodic pension and postretirement benefit cost/(income) | (35 | ) | (71 | ) | 98 | (53 | ) | 93 | |||||||||||
Less: Net gain on the sale of non-operating assets | (1 | ) | — | — | (5 | ) | (9 | ) | |||||||||||
Less: Proportional share of net income from home office land joint venture | — | (4 | ) | (31 | ) | (28 | ) | (41 | ) | ||||||||||
Adjusted EBITDA (non-GAAP) | $ | 583 | $ | 568 | $ | 935 | $ | 926 | $ | 654 | |||||||||
Adjusted Net Income/(Loss) and Adjusted Diluted EPS from Continuing Operations. The following table reconciles net income/(loss) and diluted EPS from continuing operations, the most directly comparable GAAP financial measures, to adjusted net income/(loss) and adjusted diluted EPS from continuing operations, non-GAAP financial measures:
($ in millions, except per share data) | 2019 | 2018 | 2017 | 2016 | 2015 | ||||||||||||||
Net income/(loss) (GAAP) from continuing operations | $ | (268 | ) | $ | (255 | ) | $ | (118 | ) | $ | (17 | ) | $ | (513 | ) | ||||
Diluted EPS (GAAP) from continuing operations | $ | (0.84 | ) | $ | (0.81 | ) | $ | (0.38 | ) | $ | (0.06 | ) | $ | (1.68 | ) | ||||
Add: Restructuring and management transition charges (1) | 48 | 22 | 184 | 26 | 84 | ||||||||||||||
Add: Other components of net periodic pension and postretirement benefit cost/(income) (1) | (35 | ) | (71 | ) | 98 | (53 | ) | 93 | |||||||||||
Add: (Gain)/loss on extinguishment of debt (1) | (1 | ) | 23 | 33 | 30 | 10 | |||||||||||||
Less: Net gain on the sale of non-operating assets (1) | (1 | ) | — | — | (5 | ) | (9 | ) | |||||||||||
Less: Proportional share of net income from home office land joint venture (1) | — | (4 | ) | (31 | ) | (28 | ) | (41 | ) | ||||||||||
Less: Tax impact resulting from other comprehensive income allocation | — | (11 | ) | (2) | (60 | ) | (2) | (12 | ) | (2) | — | ||||||||
Less: Impact of tax reform | — | — | (75 | ) | — | — | |||||||||||||
Adjusted net income/(loss) (non-GAAP) from continuing operations | $ | (257 | ) | $ | (296 | ) | $ | 31 | $ | (59 | ) | $ | (376 | ) | |||||
Adjusted diluted EPS (non-GAAP) from continuing operations | $ | (0.80 | ) | $ | (0.94 | ) | $ | 0.10 | $ | (0.19 | ) | $ | (1.23 | ) | |||||
(1) | Reflects no tax effect due to the impact of the Company's tax valuation allowance. |
(2) | Represents the tax benefits related to the allocation of tax expense to other comprehensive income items, including the amortization of actuarial losses and prior service costs related to the Primary Pension Plan and the results of our annual remeasurement of our pension plans. |
Adjusted Comparable Store Sales Increase/(Decrease) (Non-GAAP)
Comparable store sales is a key performance indicator used by numerous retailers to measure the sales growth of its underlying operations. Comparable store sales is considered to be a GAAP measure as the key performance indicator is measured based on GAAP net sales. Comparable store sales that excludes the impact of major appliance and in-store furniture categories is considered a non-GAAP measure. Given our elimination of these categories from our merchandise assortment, we believe that providing a comparable store sales metric that excludes the impact of major appliance and in-store furniture categories is useful for investors to evaluate the impact of these changes to our sales performance.
30
The following table reconciles comparable store sales increase/(decrease), the most directly comparable GAAP measure, to adjusted comparable store sales increase/(decrease), a non-GAAP measure.
2019 | 2018 | ||||
Comparable store sales increase/(decrease) | (7.7 | )% | (3.1 | )% | |
Impact related to major appliance and in-store furniture categories | 2.1 | % | 0.8 | % | |
Adjusted comparable store sales increase/(decrease) (non-GAAP) | (5.6 | )% | (2.3 | )% | |
Financial Condition and Liquidity
Overview
Our primary sources of liquidity are cash generated from operations, available cash and cash equivalents and access to our $2.35 billion senior secured asset-based revolving credit facility (Revolving Credit Facility).
We ended the year with $386 million of cash and cash equivalents, an increase of $53 million from the prior year. As of the end of 2019, based on our borrowing base and amounts reserved for outstanding standby letters of credit, we had $1,391 million available for future borrowings under the Revolving Credit Facility, providing total available liquidity of approximately $1.8 billion.
The following table provides a summary of our key components and ratios of financial condition and liquidity:
($ in millions) | 2019 | 2018 | 2017 | ||||||||
Cash and cash equivalents | $ | 386 | $ | 333 | $ | 458 | |||||
Merchandise inventory | 2,166 | 2,437 | 2,803 | ||||||||
Property and equipment, net | 3,488 | 3,938 | 4,281 | ||||||||
Total debt (1) | 3,721 | 3,808 | 4,012 | ||||||||
Stockholders’ equity | 829 | 1,170 | 1,383 | ||||||||
Total capital | 4,550 | 4,978 | 5,395 | ||||||||
Maximum capacity under our Revolving Credit Facility | 2,350 | 2,350 | 2,350 | ||||||||
Cash flow from operating activities | 428 | 359 | 454 | ||||||||
Free cash flow (non-GAAP) (2) | 145 | 111 | 213 | ||||||||
Capital expenditures | 309 | 392 | 395 | ||||||||
Ratios: | |||||||||||
Total debt-to-total capital (3) | 81.8 | % | 76.5 | % | 74.4 | % | |||||
Cash-to-total debt (4) | 10.4 | % | 8.7 | % | 11.4 | % | |||||
(1) | Includes long-term debt, net of unamortized debt issuance costs, including current maturities and any borrowings under our Revolving Credit Facility. |
(2) | See below for a discussion of this non-GAAP financial measure and reconciliation to its most directly comparable GAAP financial measure. |
(3) | Total debt and other financing obligations divided by total capital. |
(4) | Cash and cash equivalents divided by total debt. |
Because of the coronavirus outbreak, there is significant uncertainty surrounding the potential impact on our results of operations and cash flows. We are proactively taking steps to increase available cash on hand including, but not limited to, targeted reductions in discretionary operating expenses and capital expenditures, and utilizing funds available under our Revolving Credit Facility.
Free Cash Flow (Non-GAAP)
Free cash flow is a key financial measure of our ability to generate additional cash from operating our business. We define free cash flow as cash flow from operating activities, less capital expenditures and dividends paid, plus the proceeds from the sale of operating assets. Free cash flow is a relevant indicator of our ability to repay maturing debt, revise our dividend policy or fund
31
other uses of capital that we believe will enhance stockholder value. Free cash flow is considered a non-GAAP financial measure under the rules of the SEC. Free cash flow is limited and does not represent remaining cash flow available for discretionary expenditures due to the fact that the measure does not deduct payments required for debt maturities, payments made for business acquisitions or required pension contributions, if any. Therefore, it is important to view free cash flow in addition to, rather than as a substitute for, our entire statement of cash flows and those measures prepared in accordance with GAAP.
The following table reconciles net cash provided by/(used in) operating activities, the most directly comparable GAAP measure, to free cash flow, a non-GAAP financial measure, as well as information regarding net cash provided by/(used in) investing activities and net cash provided by/(used in) financing activities.
($ in millions) | 2019 | 2018 | 2017 | 2016 | 2015 | ||||||||||||||
Net cash provided by/(used in) operating activities (GAAP) | $ | 428 | $ | 359 | $ | 454 | $ | 334 | $ | 440 | |||||||||
Less: | |||||||||||||||||||
Capital expenditures | (309 | ) | (392 | ) | (395 | ) | (427 | ) | (320 | ) | |||||||||
Plus: | |||||||||||||||||||
Proceeds from sale of operating assets | 26 | 144 | 154 | 96 | 11 | ||||||||||||||
Free cash flow (non-GAAP) | $ | 145 | $ | 111 | $ | 213 | $ | 3 | $ | 131 | |||||||||
Net cash provided by/(used in) investing activities (1) | $ | (276 | ) | $ | (244 | ) | $ | (229 | ) | $ | (316 | ) | $ | (296 | ) | ||||
Net cash provided by/(used in) financing activities | $ | (99 | ) | $ | (240 | ) | $ | (654 | ) | $ | (31 | ) | $ | (562 | ) | ||||
(1) | Net cash provided by/(used in) investing activities includes capital expenditures and proceeds from sale of operating assets, which are also included in our computation of free cash flow. |
During 2019, free cash flow increased $34 million to an inflow of $145 million compared to an inflow of $111 million in 2018. Free cash flow increased due to improved operating performance and lower capital expenditures offset by lower proceeds from sale of operating assets in 2019 when compared to 2018.
Operating Activities
While a significant portion of our sales, profit and operating cash flows have historically been realized in the fourth quarter, our quarterly results of operations may fluctuate significantly as a result of many factors, including seasonal fluctuations in customer demand, product offerings and inventory levels.
In 2019, cash flow from operating activities was an inflow of $428 million, an increase of $69 million compared to an inflow of $359 million during the same period in the prior year. The increase in cash from operations was primarily due to improved operating performance, including lower inventory levels. Cash flows from operating activities also included construction allowances from landlords of $10 million, which funded a portion of our capital expenditures in investing activities.
Merchandise inventory decreased $271 million to $2,166 million, or 11.1%, as of the end of 2019 compared to $2,437 million as of the end of 2018. Inventory turns for 2019, 2018 and 2017 were 2.79, 2.75 and 2.73, respectively. Merchandise accounts payable decreased $61 million at the end of 2019 compared to 2018.
In 2018, cash flow from operating activities was an inflow of $359 million, a decrease of $95 million compared to an inflow of $454 million during the prior year. The decrease in cash from operations was primarily due to lower operating performance. Cash flows from operating activities also included construction allowances from landlords of $23 million, which funded a portion of our capital expenditures in investing activities.
Investing Activities
In 2019, investing activities was a cash outflow of $276 million compared to an outflow of $244 million for 2018. The increase in the cash outflow from investing activities was primarily a result of lower proceeds from the sale of operating assets partially offset by lower capital expenditures.
For 2019, capital expenditures were $309 million. At the end of the year, we also had an additional $16 million of accrued capital expenditures, which will be paid in subsequent periods. The capital expenditures for 2019 related primarily to investments in our store environment and store facility improvements and investments in information technology in both our
32
home office and stores. We received construction allowances from landlords of $10 million in 2019 to fund a portion of the capital expenditures related to store leasehold improvements. These funds are classified as operating activities and have been recorded as a reduction of operating lease assets in the Consolidated Balance Sheets.
In 2018, investing activities was a cash outflow of $244 million compared to an outflow of $229 million for 2017. The increase in the cash outflow from investing activities was primarily a result of lower proceeds from the sale of operating assets.
For 2018, capital expenditures were $392 million. At the end of the year, we also had an additional $43 million of accrued capital expenditures, which were paid in 2019. The capital expenditures for 2018 related primarily to investments in our store environment and store facility improvements, including investments in 27 new Sephora inside JCPenney stores and investments in information technology in both our home office and stores. We also received construction allowances from landlords of $23 million in 2018. Additionally, we received net cash proceeds of $30 million and $68 million, respectively for the sale-leasebacks of our Milwaukee, Wisconsin and Manchester, Connecticut distribution facilities.
The following provides a breakdown of capital expenditures:
($ in millions) | 2019 | 2018 | 2017 | ||||||||
Store renewals and updates | $ | 130 | $ | 141 | $ | 178 | |||||
Software | 118 | 129 | 123 | ||||||||
New and relocated stores | 1 | 13 | 5 | ||||||||
Technology hardware and other | 60 | 109 | 89 | ||||||||
Total | $ | 309 | $ | 392 | $ | 395 | |||||
Financing Activities
In 2019, cash flows from financing activities were an outflow of $99 million compared to an outflow of $240 million for the same period in the prior year.
During 2019, we paid $50 million to retire outstanding debt at maturity and $42 million in required principal payments on outstanding debt.
During 2018, we issued $400 million aggregate principal amount of senior secured second priority notes due 2025 and incurred $7 million in related issuance costs and paid $395 million to settle cash tender offers with respect to portions of our outstanding 2019 Notes and 2020 Notes. Additionally, we paid $190 million to retire outstanding debt at maturity and we paid $42 million in required principal payments on outstanding debt and $6 million in required payments on our finance leases and note payable.
Cash Flow
Our primary sources of liquidity are cash generated from operations, available cash and cash equivalents and access to our Revolving Credit Facility. Our cash flows may be impacted by many factors including the economic environment, consumer confidence, competitive conditions in the retail industry and the success of our strategies. For 2020, we believe that our existing liquidity will be adequate to fund our capital expenditures and working capital needs; however, in accordance with our long-term financing strategy, we may access the capital markets opportunistically.
2017 Credit Facility
The Company has a $2,350 million Revolving Credit Facility. As of the end of 2019, we had no borrowings outstanding under the Revolving Credit Facility. In addition, as of the end of 2019, based on our borrowing base, we had $1,594 million available for borrowing under the facility, of which $203 million was reserved for outstanding standby letters of credit, none of which have been drawn on, leaving $1,391 million available for future borrowings. The applicable rate for standby and import letters of credit were 1.75% and 0.875%, respectively, while the commitment fee was 0.375% for the unused portion of the Revolving Credit Facility.
In March 2020, we borrowed $1.25 billion under the Revolving Credit Facility. See Note 23 to the Consolidated Financial Statements for additional information.
33
Credit Ratings
Our credit ratings and outlook as of March 16, 2020 were as follows:
Corporate | Outlook | ||
Fitch Ratings | CCC+ | Not Applicable | |
Moody’s Investors Service, Inc. | Caa1 | Stable | |
Standard & Poor’s Ratings Services | CCC | Negative | |
Credit rating agencies periodically review our capital structure and the quality and stability of our earnings. Rating agencies consider, among other things, changes in operating performance, comparable store sales, the economic environment, conditions in the retail industry, financial leverage and changes in our business strategy in their rating decisions. Downgrades to our long-term credit ratings could result in reduced access to the credit and capital markets and higher interest costs on future financings.
Contractual Obligations and Commitments
Aggregated information about our obligations and commitments to make future contractual payments, such as debt and lease agreements, and contingent commitments as of February 1, 2020 is presented in the following table.
($ in millions) | Total | Less Than 1 Year | 1 - 3 Years | 3 - 5 Years | More Than 5 Years | ||||||||||||||
Recorded contractual obligations: | |||||||||||||||||||
Total debt, excluding unamortized debt issuance costs | $ | 3,758 | $ | 147 | $ | 84 | $ | 1,924 | $ | 1,603 | |||||||||
Operating leases (1) | 2,667 | 189 | 381 | 347 | 1,750 | ||||||||||||||
Financing obligation | 1 | 1 | — | — | — | ||||||||||||||
Unrecognized tax benefits (2) | 36 | — | — | — | 36 | ||||||||||||||
Contributions to non-qualified supplemental retirement plans (3) | 112 | 27 | 31 | 16 | 38 | ||||||||||||||
$ | 6,574 | $ | 364 | $ | 496 | $ | 2,287 | $ | 3,427 | ||||||||||
Unrecorded contractual obligations: | |||||||||||||||||||
Interest payments on long-term debt (4) | $ | 4,360 | $ | 235 | (5) | $ | 458 | $ | 299 | $ | 3,368 | ||||||||
Standby and import letters of credit (6) | 203 | 203 | — | — | — | ||||||||||||||
Surety bonds (7) | 64 | 64 | — | — | — | ||||||||||||||
Contractual obligations (8) | 125 | 81 | 43 | 1 | — | ||||||||||||||
Purchase orders (9) | 1,325 | 1,325 | — | — | — | ||||||||||||||
$ | 6,077 | $ | 1,908 | $ | 501 | $ | 300 | $ | 3,368 | ||||||||||
Total | $ | 12,651 | $ | 2,272 | $ | 997 | $ | 2,587 | $ | 6,795 | |||||||||
(1) | Represents future minimum lease payments for non-cancelable operating leases, including renewals determined to be reasonably certain. Future minimum lease payments have not been reduced for sublease income. |
(2) | Represents management’s best estimate of the payments related to tax reserves for uncertain income tax positions. Based on the nature of these liabilities, the actual payments in any given year could vary significantly from these amounts. See Note 20 to the Consolidated Financial Statements. |
(3) | Represents expected cash payments through 2029. |
(4) | Includes interest expense related to our 2016 Term Loan Facility of $281 million that was calculated using its interest rate as of February 1, 2020 for the anticipated amount outstanding each period, which assumes the required principal payments for the loan remain the same each quarter. |
(5) | Includes $67 million of accrued interest that is included in our Consolidated Balance Sheet at February 1, 2020. |
(6) | Standby letters of credit, which totaled $203 million, are issued as collateral to a third-party administrator for self-insured workers’ compensation and general liability claims and to support our merchandise initiatives. There were no outstanding import letters of credit at February 1, 2020. |
(7) | Surety bonds are primarily for previously incurred and expensed obligations related to workers’ compensation and general liability claims. |
(8) | Consists primarily of (a) minimum purchase requirements for exclusive merchandise and fixtures; (b) minimum marketing obligations; and (c) minimum obligations for professional services, energy services, software maintenance and network services. |
34
(9) | Amounts committed under open purchase orders for merchandise inventory of which a significant portion are cancelable without penalty prior to a date that precedes the vendor’s scheduled shipment date. |
Off-Balance Sheet Arrangements
We do not have any material off-balance sheet financings or any additional arrangements or relationships with entities that are not consolidated into the financial statements.
Impact of Inflation, Deflation and Changing Prices
We have experienced inflation and deflation related to our purchase of certain commodity products. We do not believe that changing prices for commodities have had a material effect on our Net Sales or results of operations. Although we cannot precisely determine the overall effect of inflation and deflation on operations, we do not believe inflation and deflation have had
a material effect on our financial condition or results of operations.
With a sizable portion of our private and national branded apparel sourced from China, we are exposed to potential increases in product costs which may result from increased tariffs imposed by the U.S. government in connection with its trade disputes with China. We expect a minimal impact on our product costs based on the current tariffs that are in effect and have taken actions to diversify our sourcing operations for private brands. However, we can expect a more meaningful increase to our product costs if potential additional tariffs go into effect on all Chinese imports and specifically in apparel and footwear.
Critical Accounting Policies
The preparation of our financial statements in conformity with accounting principles generally accepted in the United States requires that we make estimates and use assumptions that in some instances may materially affect amounts reported in the accompanying Consolidated Financial Statements. In preparing these financial statements, we have made our best estimates and judgments based on history and current trends, as well as other factors that we believe are relevant at the time of the preparation of our Consolidated Financial Statements. Historically, actual results have not differed materially from estimates; however, future events and their effects cannot be determined with certainty and as a result, actual results could differ from our assumptions and estimates.
See Note 2 to the Consolidated Financial Statements for a description of our significant accounting policies.
Inventory Valuation under the Retail Method
Inventories are valued at the lower of cost (using the first-in, first-out or “FIFO” method) or market, determined under the Retail Inventory Method (RIM). Under RIM, retail values of merchandise groups are converted to a cost basis by applying the specific average cost-to-retail ratio related to each merchandise grouping. RIM inherently requires management judgment and certain estimates that may significantly impact the ending inventory valuation at cost, as well as our Cost of goods sold. The most significant estimates are permanent reductions to retail prices (markdowns) and permanent devaluation of inventory (markdown accruals) used primarily to clear seasonal merchandise or otherwise slow-moving inventory and inventory shortage (shrinkage).
Permanent markdowns and markdown accruals are designated for clearance activity and are recorded at the point of decision, when the utility of inventory has diminished, versus the point of sale. Factors considered in the determination of permanent markdowns and markdown accruals include current and anticipated demand, customer preferences, age of the merchandise and style trends. Under RIM, permanent markdowns and markdown accruals result in the devaluation of inventory and the corresponding increase to cost of goods sold is recognized in the period the decision to execute the markdown is made. Shrinkage accruals are estimated as a percent of sales for a given period based on physical inventory counts or cycle count activities. Physical inventory counts for stores are taken at least annually and cycle count activities for distribution centers and regional warehouses are executed on a daily basis. Inventory records and shrinkage accruals are adjusted based on the actual results from physical inventories and cycle counts. The shrinkage rate from the most recent physical inventory and cycle count activity, in combination with current events and historical experience, is used as the standard for the shrinkage accrual rate for the next inventory cycle or cycle count activity. Historically, our actual physical inventory and cycle counts results have shown our estimates to be reliable. Based on prior experience, we do not believe that the actual results will differ significantly from the assumptions used in these estimates.
Valuation of Long-Lived and Indefinite-Lived Assets
Long-Lived Assets
We evaluate recoverability of long-lived assets, such as property and equipment and right-of-use assets, whenever events or changes in circumstances indicate that the carrying value may not be recoverable, such as historical operating losses or plans to close stores and dispose of or sell long-lived assets before the end of their previously estimated useful lives. Additionally,
35
annual operating performance of individual stores are periodically analyzed to identify potential underperforming stores which may require further evaluation of the recoverability of the carrying amounts. If our further evaluations of underperforming stores, performed on an undiscounted cash flow basis, indicate that the carrying amount of the asset may not be recoverable, the potential impairment is measured as the excess of carrying value over the fair value of the impaired asset. The impairment calculation requires us to apply estimates for future cash flows and use judgments for qualitative factors such as local market conditions, operating environment, mall performance and other trends. We estimate fair value based on either a projected discounted cash flow method using a discount rate that is considered commensurate with the risk inherent in our current business model or an appraised value method, as appropriate.
We recognize impairment losses in the earliest period that it is determined a loss has occurred. The carrying value is adjusted to the new carrying value and any subsequent increases in fair value are not recorded. If it is determined that the estimated remaining useful life of the asset should be decreased, the periodic depreciation expense is adjusted based on the new carrying value of the asset. Impairment losses totaling $19 million in 2019 related to the Company's closure of 24 full-line and 9 ancillary home and furniture stores and $77 million in 2017 related to the Company's closure of 138 stores were recorded in the Consolidated Statement of Operations in the line item Restructuring and management transition. With the adoption of ASU 2016-02, the Company evaluated the new right-of-use assets added to certain store asset groups that were previously determined to be impaired. Given the facts and circumstances that were still in existence upon adopting the new lease standard, the Company recorded an approximate $39 million impairment charge to Reinvested earnings/(accumulated deficit) to adjust the net book value of the new right-of-use assets to their fair value. Impairment losses totaling $52 million in 2018 related to the Company's three airplanes that were sold during the year were recorded in the Consolidated Statement of Operations in the line item Real estate and other, net.
While we do not believe there is a reasonable likelihood that there will be a material change in our estimates or assumptions used to calculate long-lived asset impairments, if actual results are not consistent with our current estimates and assumptions, we may be exposed to additional impairment charges, which could be material to our results of operations.
Indefinite-Lived Assets
We assess the recoverability of indefinite-lived intangible assets at least annually during the fourth quarter of our fiscal year or more frequently whenever events or changes in circumstances indicate that the carrying amount of the indefinite-lived intangible asset may not be fully recoverable. Examples of a change in events or circumstances include, but are not limited to, a decrease in the market price of the asset, a history of cash flow losses related to the use of the asset or a significant adverse change in the extent or manner in which an asset is being used. For our 2019 annual impairment test, we tested the Liz Claiborne indefinite-lived intangible asset utilizing the relief from royalty method to determine the estimated fair value of the indefinite-lived intangible asset. The relief from royalty method estimates our theoretical royalty savings from ownership of the intangible asset. Key assumptions used in this model include discount rates, royalty rates, growth rates, sales projections and terminal value rates. Discount rates, royalty rates, growth rates and sales projections are the assumptions most sensitive and susceptible to change as they require significant management judgment. Discount rates used are similar to the rates estimated by the weighted average cost of capital considering any differences in company-specific risk factors. Royalty rates are established by management based on comparable trademark licensing agreements in the market. Operational management, considering industry and company-specific historical and projected data, develops growth rates and sales projections associated with the indefinite-lived intangible asset. Terminal value rate determination follows common methodology of capturing the present value of perpetual sales estimates beyond the last projected period assuming a constant weighted average cost of capital and long-term growth rates.
While we do not believe there is a reasonable likelihood that there will be a material change in our estimates or assumptions used to calculate indefinite-lived asset impairments, if actual results are not consistent with our current estimates and assumptions, we may be exposed to additional impairment charges, which could be material to our results of operations.
Valuation of Deferred Tax Assets
We account for income taxes using the asset and liability method. Deferred tax assets and liabilities are recognized for the future tax consequences attributable to differences between the financial statement carrying amounts of existing assets and liabilities and their respective tax bases and operating loss and tax credit carryforwards. Deferred tax assets and liabilities are measured using enacted tax rates expected to apply to taxable income in the years in which those temporary differences are expected to be recovered or settled. The effect on deferred tax assets and liabilities of a change in tax rates is recognized in income in the period that includes the enactment date. A valuation allowance is recorded to reduce the carrying amounts of deferred tax assets unless it is more likely than not such assets will be realized.
36
In assessing the need for a valuation allowance, we consider both positive and negative evidence related to the likelihood of the realization of the deferred tax assets based on future events. Our accounting for deferred tax consequences represents our best estimate of those future events. If based on the weight of available evidence, it is more likely than not (defined as a likelihood of more than 50%) the deferred tax assets will not be realized, we record a valuation allowance. The weight given to both positive and negative evidence is commensurate with the extent to which the evidence may be objectively verified. As such, it is generally difficult for positive evidence regarding projected future taxable income, exclusive of reversing taxable temporary differences, to outweigh objective negative evidence of recent losses. Cumulative losses in recent years are a significant piece of negative evidence that is difficult to overcome in determining that a valuation allowance is not needed against deferred tax assets.
This assessment is completed on a taxing jurisdiction basis and takes into account several types of evidence, including the following:
• | Nature, frequency, and severity of current and cumulative financial reporting losses. A pattern of recent losses is heavily weighted as a source of negative evidence. In certain circumstances, historical information may not be as relevant due to a change in circumstances. |
• | Sources of future taxable income. Future reversals of existing temporary differences are heavily weighted sources of objectively verifiable positive evidence. Projections of future taxable income, exclusive of reversing temporary differences, are a source of positive evidence only when the projections are combined with a history of recent profits and can be reasonably estimated. Otherwise, these projections are considered inherently subjective and generally will not be sufficient to overcome negative evidence that includes cumulative losses in recent years, particularly if the projected future taxable income is dependent on an anticipated turnaround to profitability that has not yet been achieved. In such cases, we generally give these projections of future taxable income no weight for the purposes of our valuation allowance assessment. |
• | Tax planning strategies. If necessary and available, tax-planning strategies would be implemented to accelerate taxable amounts to utilize expiring net operating loss carryforwards. These strategies would be a source of additional positive evidence and, depending on their nature, could be heavily weighted. |
In the second quarter of 2013, our net deferred tax position, exclusive of any valuation allowance, changed from a net deferred tax liability to a net deferred tax asset. In our assessment of the need for a valuation allowance, we heavily weighted the negative evidence of cumulative losses in recent periods and the positive evidence of future reversals of existing temporary differences. Although a sizable portion of our losses were the result of charges incurred for restructuring and other special items, even without these charges we still would have incurred significant losses. Accordingly, we considered our pattern of recent losses to be relevant to our analysis. Considering this pattern of recent losses and the uncertainties associated with projected future taxable income exclusive of reversing temporary differences, we gave no weight to projections showing future U.S. taxable income for purposes of assessing the need for a valuation allowance. As a result of our assessment, we concluded that, beginning in the second quarter of 2013, our estimate of the realization of deferred tax assets would be based solely on future reversals of existing taxable temporary differences and tax planning strategies that we would make use of to accelerate taxable income to utilize expiring net operating loss carryforwards.
Future book pre-tax losses will require additional valuation allowances to offset the deferred tax assets created. A sustained period of profitability is required before we would change our need for a valuation allowance against our net deferred tax assets. Additionally, under the U.S. Tax Cuts and Jobs Act, additional NOLs that the Company may recognize in the future would not expire but would only be available to offset up to 80% of the Company’s future taxable income.
See Note 20 to the Consolidated Financial Statements for more information regarding income taxes and also Risk Factors, Item 1A.
Pension
Pension Accounting
We maintain a qualified funded defined benefit pension plan (Primary Pension Plan) and smaller non-qualified unfunded supplemental defined benefit plans. The determination of pension expense is the result of actuarial calculations that are based on important assumptions about pension assets and liabilities. The most important of these are the expected rate of return on assets and the discount rate assumptions. These assumptions require significant judgment and a change in any one of them could have a material impact on pension expense reported in our Consolidated Statements of Operations and Consolidated Statements of Comprehensive Income/(Loss), as well as in the assets, liability and equity sections of the Consolidated Balance Sheets.
37
The following table reflects our expected rate of return and discount rate assumptions:
2019 | 2018 | 2017 | |||||||
Expected return on plan assets | 6.25 | % | 6.50 | % | 6.50 | % | |||
Discount rate for pension expense | 4.33 | % | 3.98 | % | 4.40 | % | |||
Discount rate for pension obligation | 3.08 | % | 4.33 | % | 3.98 | % | |||
Return on Plan Assets and Impact on Earnings
For the Primary Pension Plan, we apply our expected return on plan assets using fair market value as of the annual measurement date. The fair market value method results in greater volatility to our pension expense than the more commonly used calculated value method (referred to as smoothing of assets). Our Primary Pension Plan asset base consists of a mix of equities (U.S., non-U.S. and private), fixed income (investment-grade and high-yield), real estate (private and public) and alternative asset classes.
The expected return on plan assets is based on the plan’s long-term asset allocation policy, historical returns for plan assets and overall capital market returns, taking into account current and expected market conditions.
Discount Rate
The discount rate used to measure pension expense each year is the rate as of the beginning of the year (i.e., the prior measurement date). The discount rate, as determined by the plan actuary, is based on a hypothetical AA yield curve represented by a series of bonds maturing over the next 30 years, designed to match the corresponding pension benefit cash payments to retirees.
For 2019, the discount rate to measure pension expense was 4.33% compared to 3.98% in 2018. The discount rate to measure the pension obligations decreased to 3.08% as of February 1, 2020 from 4.33% as of February 2, 2019.
Sensitivity
The sensitivity of pension expense to a plus or minus one-half of one percent of expected return on assets is a decrease or increase in pension expense of approximately $17 million. An increase in the discount rate of one-half of one percent would increase the 2020 pension expense by approximately $9 million and a decrease in the discount rate of one-half of one percent would decrease pension expense by approximately $10 million.
Pension Funding
Funding requirements for our Primary Pension Plan are determined under Employee Retirement Income Security Act of 1974 (ERISA) rules, as amended by the Pension Protection Act of 2006. As a result of the funded status of the Primary Pension Plan, we are not required to make cash contributions in 2020.
Recent Accounting Pronouncements
Refer to Note 4 to the Consolidated Financial Statements for discussion of recent accounting pronouncements.
Cautionary Statement Regarding Forward-Looking Information
This Annual Report on Form 10-K may contain forward-looking statements within the meaning of the Private Securities Litigation Reform Act of 1995, which reflect our current view of future events and financial performance. Words such as "expect" and similar expressions identify forward-looking statements, which include, but are not limited to, statements regarding sales, cost of goods sold, selling, general and administrative expenses, earnings, cash flows and liquidity. Forward-looking statements are based only on the Company's current assumptions and views of future events and financial performance. They are subject to known and unknown risks and uncertainties, many of which are outside of the Company's control, that may cause the Company's actual results to be materially different from planned or expected results. Those risks and uncertainties include, but are not limited to, general economic conditions, including inflation, recession, unemployment levels, consumer confidence and spending patterns, credit availability and debt levels, changes in store traffic trends, the cost of goods, more stringent or costly payment terms and/or the decision by a significant number of vendors not to sell us merchandise on a timely basis or at all, trade restrictions, the ability to monetize non-core assets on acceptable terms, the ability to implement our strategic plan including our omnichannel initiatives, customer acceptance of our strategies, our ability to attract, motivate and retain key executives and other associates, the impact of cost reduction initiatives, our ability to generate or maintain liquidity,
38
implementation of new systems and platforms, changes in tariff, freight and shipping rates, changes in the cost of fuel and other energy and transportation costs, disruptions and congestion at ports through which we import goods, increases in wage and benefit costs, competition and retail industry consolidations, interest rate fluctuations, dollar and other currency valuations, the impact of weather conditions, risks associated with war, an act of terrorism or pandemic, the ability of the federal government to fund and conduct its operations, a systems failure and/or security breach that results in the theft, transfer or unauthorized disclosure of customer, employee or Company information, legal and regulatory proceedings, the Company’s ability to access the debt or equity markets on favorable terms or at all, the Company's ability to comply with the continued listing criteria of the NYSE, risks arising from the potential suspension of trading of the Company's common stock on that exchange, and the impact of natural disasters, public health crises, or other catastrophic events on our financial results. There can be no assurances that the Company will achieve expected results, and actual results may be materially less than expectations. While we believe that our assumptions are reasonable, we caution that it is impossible to predict the degree to which any such factors could cause actual results to differ materially from predicted results. We intend the forward-looking statements in this Annual Report on Form 10-K to speak only as of the date of this report and do not undertake to update or revise projections as more information becomes available.
Item 7A. Quantitative and Qualitative Disclosures about Market Risk
All of our outstanding notes and debentures as of February 1, 2020 are at fixed interest rates and would not be affected by interest rate changes. The Revolving Credit Facility borrowings under the 2017 Credit Facility are affected by interest rate changes. As of February 1, 2020, we had no borrowings outstanding under the Revolving Credit Facility.
The Company's 2016 Term Loan Facility bears interest at a variable rate of LIBOR plus 4.25%. To manage the fluctuation of interest, the Company entered into interest rate swap agreements with notional amounts totaling $1,250 million to fix a portion of our variable LIBOR-based interest payments. The interest rate swap agreements, which were effective May 7, 2015, have a weighted-average fixed rate of 2.04%, mature on May 7, 2020 and have been designated as cash flow hedges. The Company entered into additional interest rate swap agreements with notional amounts totaling $750 million to fix a portion of our variable LIBOR-based interest payments. The interest rate swap agreements have a weighted-average fixed rate of 3.135%, are effective from May 7, 2020 to May 7, 2025 and have been designated as cash flow hedges. Accordingly, a 100 basis point increase in LIBOR interest rates would result in additional annual interest expense of $16 million under the 2016 Term Loan Facility and a $13 million reduction in annual interest expense under the interest rate swap agreements.
The effects of changes in the U.S. equity and bond markets serve to increase or decrease the value of assets in our Primary Pension Plan. We seek to manage exposure to adverse equity and bond returns by maintaining diversified investment portfolios and utilizing professional investment managers.
Item 8. Financial Statements and Supplementary Data
See the Index to Consolidated Financial Statements on page 52.
Item 9. Changes in and Disagreements with Accountants on Accounting and Financial Disclosure
None.
Item 9A. Controls and Procedures
Conclusion Regarding the Effectiveness of Disclosure Controls and Procedures
The management of our Company, under the supervision and with the participation of our principal executive officer and principal financial officer, conducted an evaluation of the effectiveness of the design and operation of our disclosure controls and procedures (as defined in Rules 13a-15(e) and 15d-15(e) under the Securities Exchange Act of 1934 (the Exchange Act)) as of the end of the period covered by this Annual Report on Form 10-K. Based on this evaluation, our principal executive officer and principal financial officer concluded that our disclosure controls and procedures are effective to ensure that information required to be disclosed by us in the reports that we file or submit under the Exchange Act (i) is recorded, processed, summarized and reported within the time periods specified in the Securities and Exchange Commission’s rules and forms and (ii) is accumulated and communicated to management, including our principal executive officer and principal financial officer, as appropriate to allow timely decisions regarding required disclosure.
39
Management’s Report on Internal Control over Financial Reporting
The management of our Company is responsible for establishing and maintaining adequate internal control over financial reporting (as defined in Rules 13a-15(f) and 15d-15(f) under the Exchange Act). Management has assessed the effectiveness of our Company’s internal control over financial reporting as of February 1, 2020. In making this assessment, management used criteria set forth by the Committee of Sponsoring Organizations of the Treadway Commission (COSO) in Internal Control–Integrated Framework (2013). Based on its assessment, management believes that, as of February 1, 2020, our Company’s internal control over financial reporting is effective based on those criteria.
The Company’s independent registered public accounting firm, KPMG LLP, has audited the consolidated financial statements included in this Annual Report on Form 10-K and has issued an attestation report on the effectiveness of our Company’s internal control over financial reporting. Their report follows.
Changes in Internal Control over Financial Reporting
There were no changes in our Company’s internal control over financial reporting during the fourth quarter ended February 1, 2020 that have materially affected, or are reasonably likely to materially affect, our Company’s internal control over financial reporting.
40
Report of Independent Registered Public Accounting Firm
To the Stockholders and Board of Directors
J. C. Penney Company, Inc.:
Opinion on Internal Control Over Financial Reporting
We have audited J. C. Penney Company, Inc. and subsidiaries’ (the Company) internal control over financial reporting as of February 1, 2020, based on criteria established in Internal Control - Integrated Framework (2013) issued by the Committee of Sponsoring Organizations of the Treadway Commission. In our opinion, the Company maintained, in all material respects, effective internal control over financial reporting as of February 1, 2020, based on criteria established in Internal Control - Integrated Framework (2013) issued by the Committee of Sponsoring Organizations of the Treadway Commission.
We also have audited, in accordance with the standards of the Public Company Accounting Oversight Board (United States) (PCAOB), the consolidated balance sheets of the Company as of February 1, 2020 and February 2, 2019, the related consolidated statements of operations, comprehensive income/(loss), stockholders’ equity, and cash flows for each of the years in the three-year period ended February 1, 2020, and the related notes (collectively, the consolidated financial statements), and our report dated March 20, 2020 expressed an unqualified opinion on those consolidated financial statements.
Basis for Opinion
The Company’s management is responsible for maintaining effective internal control over financial reporting and for its assessment of the effectiveness of internal control over financial reporting, included in the accompanying Management’s Report on Internal Control over Financial Reporting. Our responsibility is to express an opinion on the Company’s internal control over financial reporting based on our audit. We are a public accounting firm registered with the PCAOB and are required to be independent with respect to the Company in accordance with the U.S. federal securities laws and the applicable rules and regulations of the Securities and Exchange Commission and the PCAOB.
We conducted our audit in accordance with the standards of the PCAOB. Those standards require that we plan and perform the audit to obtain reasonable assurance about whether effective internal control over financial reporting was maintained in all material respects. Our audit of internal control over financial reporting included obtaining an understanding of internal control over financial reporting, assessing the risk that a material weakness exists, and testing and evaluating the design and operating effectiveness of internal control based on the assessed risk. Our audit also included performing such other procedures as we considered necessary in the circumstances. We believe that our audit provides a reasonable basis for our opinion.
Definition and Limitations of Internal Control Over Financial Reporting
A company’s internal control over financial reporting is a process designed to provide reasonable assurance regarding the reliability of financial reporting and the preparation of financial statements for external purposes in accordance with generally accepted accounting principles. A company’s internal control over financial reporting includes those policies and procedures that (1) pertain to the maintenance of records that, in reasonable detail, accurately and fairly reflect the transactions and dispositions of the assets of the company; (2) provide reasonable assurance that transactions are recorded as necessary to permit preparation of financial statements in accordance with generally accepted accounting principles, and that receipts and expenditures of the company are being made only in accordance with authorizations of management and directors of the company; and (3) provide reasonable assurance regarding prevention or timely detection of unauthorized acquisition, use, or disposition of the company’s assets that could have a material effect on the financial statements.
Because of its inherent limitations, internal control over financial reporting may not prevent or detect misstatements. Also, projections of any evaluation of effectiveness to future periods are subject to the risk that controls may become inadequate because of changes in conditions, or that the degree of compliance with the policies or procedures may deteriorate.
/s/ KPMG LLP
Dallas, Texas
March 20, 2020
41
Item 9B. Other Information
Please see information regarding borrowings subsequent to the balance sheet date in Note 23 to the Consolidated Financial Statements.
PART III
Item 10. Directors, Executive Officers and Corporate Governance
The information required by Item 10 with respect to executive officers is included within Item 1 in Part I of this Annual Report on Form 10-K under the caption “Information about our Executive Officers.”
The information required by Item 10 with respect to directors, audit committee, audit committee financial experts and Section 16(a) beneficial ownership reporting compliance is included under the captions “Board Committees–Audit Committee,” and “Proposal 1 - Election of Directors” in our definitive proxy statement for 2020, which will be filed with the Securities and Exchange Commission pursuant to Regulation 14A and is incorporated herein by reference.
Code of Ethics and Corporate Governance Guidelines
We have adopted a code of ethics for officers and employees, which applies to, among others, our principal executive officer, principal financial officer and principal accounting officer, and which is known as the “Statement of Business Ethics.” We have also adopted certain ethical principles and policies for our directors, which are set forth in Article V of our Corporate Governance Guidelines. The Statement of Business Ethics and Corporate Governance Guidelines are available on our website at www.jcp.com. Additionally, we will provide copies of these documents without charge upon request made to:
J. C. Penney Company, Inc.
Office of Investor Relations
6501 Legacy Drive
Plano, Texas 75024
(Telephone 972-431-5500)
Our Company intends to satisfy the disclosure requirement under Item 5.05 of Form 8-K regarding an amendment to or waiver of any provision of the Statement of Business Ethics that applies to any officer of the Company by posting such information on our website at www.jcp.com.
Item 11. Executive Compensation
The information required by Item 11 is included under the captions “Compensation Committee Interlocks and Insider Participation,” “Compensation Discussion and Analysis,” “Report of the Human Resources and Compensation Committee,” “Summary Compensation Table,” “Grants of Plan-Based Awards for Fiscal 2019,” “Outstanding Equity Awards at Fiscal Year-End 2019,” “Option Exercises and Stock Vested for Fiscal 2019,” “Nonqualified Deferred Compensation for Fiscal 2019,” “Potential Payments and Benefits on Termination of Employment,” “Director Compensation for Fiscal 2019,” and “CEO Pay Ratio” in our Company’s definitive proxy statement for 2020, which will be filed with the Securities and Exchange Commission pursuant to Regulation 14A and is incorporated herein by reference.
Item 12. Security Ownership of Certain Beneficial Owners and Management and Related Stockholder Matters
The information required by Item 12 with respect to beneficial ownership of our Company’s common stock is included under the caption “Beneficial Ownership of Common Stock” and with respect to equity compensation plans is included under the caption "Equity Compensation Plan(s) Information" in our Company’s definitive proxy statement for 2020, which will be filed with the Securities and Exchange Commission pursuant to Regulation 14A and is incorporated herein by reference.
Item 13. Certain Relationships and Related Transactions, and Director Independence
The information required by Item 13 is included under the captions “Policies and Procedures with Respect to Related Person Transactions” and “Board Independence” in our Company’s definitive proxy statement for 2020, which will be filed with the Securities and Exchange Commission pursuant to Regulation 14A and is incorporated herein by reference.
42
Item 14. Principal Accounting Fees and Services
The information required by Item 14 is included under the captions “Audit and Other Fees” and “Audit Committee’s Pre-Approval Policies and Procedures” in our Company’s definitive proxy statement for 2020, which will be filed with the Securities and Exchange Commission pursuant to Regulation 14A and is incorporated herein by reference.
PART IV
Item 15. Exhibits, Financial Statement Schedules
(a) Documents filed as part of this report:
1. Consolidated Financial Statements:
The Consolidated Financial Statements of J. C. Penney Company, Inc. and subsidiaries are listed in the accompanying "Index to Consolidated Financial Statements" on page 52.
2. Financial Statement Schedules:
Schedules have been omitted as they are inapplicable or not required under the rules, or the information has been submitted in the Consolidated Financial Statements and related financial information contained otherwise in this Annual Report on Form 10-K.
3. Exhibits:
Each management contract or compensatory plan or arrangement required to be filed as an exhibit to this Annual Report on Form 10-K is specifically identified in the Exhibit Index below and filed with or incorporated by reference in this report.
43
Exhibit Index
Incorporated by Reference | ||||||||||||
Filed | ||||||||||||
SEC | Filing | Herewith (†) | ||||||||||
Exhibit No. | Exhibit Description | Form | File No. | Exhibit | Date | (as indicated) | ||||||
2.1 | 8-K | 001-15274 | 2 | 1/28/2002 | ||||||||
3.1 | 10-Q | 001-15274 | 3.1 | 6/8/2011 | ||||||||
3.2 | 8-K | 001-15274 | 3.1 | 7/21/2016 | ||||||||
3.3 | 8-K | 001-15274 | 3.1 | 8/22/2013 | ||||||||
4.1 | 10-K | 001-00777 | 4(a) | 4/19/1994 | ||||||||
4.2 | 10-K | 001-00777 | 4(b) | 4/19/1994 | ||||||||
4.3 | 10-K | 001-00777 | 4(c) | 4/19/1994 | ||||||||
4.4 | 10-K | 001-15274 | 4.4 | 3/19/2018 | ||||||||
4.5 | Fourth Supplemental Indenture, dated as of June 7, 1991, between JCP and U.S. Bank National Association, Trustee (formerly First Trust of California, National Association, as Successor Trustee to Bank of America National Trust and Savings Association) | S-3 | 033-41186 | 4(e) | 6/13/1991 | |||||||
4.6 | 10-K | 001-15274 | 4(o) | 4/25/2002 | ||||||||
4.7 | 8-K | 001-15274 | 4.1 | 5/24/2013 | ||||||||
4.8 | S-3 | 033-53275 | 4(a) | 4/26/1994 | ||||||||
4.9 | 10-K | 001-15274 | 4(p) | 4/25/2002 | ||||||||
Other instruments evidencing long-term debt have not been filed as exhibits hereto because none of the debt authorized under any such instrument exceeds 10% of the total assets of the Registrant and its consolidated subsidiaries. The Registrant agrees to furnish a copy of any of its long-term debt instruments to the Securities and Exchange Commission upon request.
44
Incorporated by Reference | ||||||||||||
Filed | ||||||||||||
SEC | Filing | Herewith (†) | ||||||||||
Exhibit No. | Exhibit Description | Form | File No. | Exhibit | Date | (as indicated) | ||||||
4.10 | 10-Q | 001-15274 | 4 | 9/6/2002 | ||||||||
4.11 | 8-K | 001-15274 | 4.1 | 9/15/2014 | ||||||||
4.12 | 8-K | 001-15274 | 4.2 | 9/15/2014 | ||||||||
4.13 | 8-K | 001-15274 | 4.1 | 6/24/2016 | ||||||||
4.14 | 8-K | 001-15274 | 4.1 | 1/28/2014 | ||||||||
4.15 | 8-K | 001-15274 | 4.1 | 1/23/2017 | ||||||||
4.16 | 8-K | 001-15274 | 4.1 | 1/24/2020 | ||||||||
4.17 | 8-K | 001-15274 | 4.1 | 3/14/2018 | ||||||||
4.18 | † | |||||||||||
10.1 | 8-K | 001-15274 | 10.1 | 6/23/2014 | ||||||||
10.2 | 8-K | 001-15274 | 10.1 | 12/11/2015 | ||||||||
10.3 | 8-K | 001-15274 | 10.1 | 6/21/2017 | ||||||||
10.4 | 8-K | 001-15274 | 10.2 | 6/23/2014 | ||||||||
10.5 | 8-K | 001-15274 | 10.1 | 6/24/2016 | ||||||||
45
Incorporated by Reference | ||||||||||||
Filed | ||||||||||||
SEC | Filing | Herewith (†) | ||||||||||
Exhibit No. | Exhibit Description | Form | File No. | Exhibit | Date | (as indicated) | ||||||
10.6 | 8-K | 001-15274 | 10.2 | 6/24/2016 | ||||||||
10.7 | 8-K | 001-15274 | 10.3 | 6/24/2016 | ||||||||
10.8 | 8-K | 001-15274 | 10.4 | 6/24/2016 | ||||||||
10.9 | 8-K | 001-15274 | 10.1 | 3/14/2018 | ||||||||
10.10 | 8-K | 001-15274 | 10.2 | 3/14/2018 | ||||||||
10.11 | 8-K | 001-15274 | 10.3 | 3/14/2018 | ||||||||
10.12 | 8-K | 001-15274 | 10.4 | 3/14/2018 | ||||||||
10.13 | 10-Q | 001-15274 | 10.1 | 11/28/2018 | ||||||||
10.14** | Directors’ Charitable Award Program | 10-K | 001-00777 | 10(r) | 4/25/1990 | |||||||
10.15** | Def. Proxy Stmt. | 001-00777 | B | 4/11/2001 | ||||||||
10.16** | 10-K | 001-15274 | 10.65 | 3/31/2009 | ||||||||
10.17** | Def. Proxy Stmt. | 001-15274 | Annex A | 3/31/2009 | ||||||||
10.18** | Def. Proxy Stmt. | 001-15274 | Annex A | 3/28/2012 | ||||||||
10.19** | Def. Proxy Stmt. | 001-15274 | Annex A | 3/21/2014 | ||||||||
10.20** | Def. Proxy Stmt. | 001-15274 | Annex A | 3/23/2016 | ||||||||
10.21** | Def. Proxy Stmt. | 001-15274 | Annex A | 4/9/2018 | ||||||||
46
Incorporated by Reference | ||||||||||||
Filed | ||||||||||||
SEC | Filing | Herewith (†) | ||||||||||
Exhibit No. | Exhibit Description | Form | File No. | Exhibit | Date | (as indicated) | ||||||
10.22** | 8-K | 001-15274 | 10.1 | 5/24/2019 | ||||||||
10.23** | 10-Q | 001-15274 | 10.1 | 9/12/2007 | ||||||||
10.24** | 8-K | 001-15274 | 10.5 | 2/15/2005 | ||||||||
10.25** | 8-K | 001-15274 | 10.1 | 5/24/2005 | ||||||||
10.26** | 8-K | 001-15274 | 10.1 | 11/18/2005 | ||||||||
10.27** | 8-K | 001-15274 | 10.1 | 9/26/2007 | ||||||||
10.28** | 10-Q | 001-15274 | 10.3 | 12/5/2013 | ||||||||
10.29** | 8-K | 001-15274 | 10.2 | 5/21/2015 | ||||||||
10.30** | 10-K | 001-15274 | 10.33 | 3/16/2016 | ||||||||
10.31** | 8-K | 001-15274 | 10.2 | 5/21/2015 | ||||||||
10.32** | 8-K | 001-15274 | 10.1 | 5/19/2006 | ||||||||
10.33** | 8-K | 001-15274 | 10.2 | 5/19/2006 | ||||||||
10.34** | 8-K | 001-15274 | 10.8 | 2/15/2005 | ||||||||
10.35** | 8-K | 001-15274 | 10.3 | 5/19/2006 | ||||||||
10.36** | 8-K | 001-15274 | 10.4 | 5/19/2006 | ||||||||
10.37** | 8-K | 001-15274 | 10.1 | 3/15/2007 | ||||||||
10.38** | 8-K | 001-15274 | 10.1 | 3/7/2008 | ||||||||
10.39** | 10-K | 001-15274 | 10.60 | 3/31/2009 | ||||||||
10.40** | 8-K | 001-15274 | 10.1 | 6/14/2011 | ||||||||
10.41** | 10-K | 001-15274 | 10.47 | 3/19/2018 | ||||||||
10.42** | 10-K | 001-15274 | 10.53 | 3/31/2009 | ||||||||
10.43** | 10-Q | 001-15274 | 10.2 | 9/10/2008 | ||||||||
10.44** | 10-Q | 001-15274 | 10.1 | 11/30/2016 | ||||||||
10.45** | 10-K | 001-15274 | 10(ii)(ab) | 4/25/2002 | ||||||||
10.46** | 10-K | 001-15274 | 10.56 | 3/31/2009 | ||||||||
47
Incorporated by Reference | ||||||||||||
Filed | ||||||||||||
SEC | Filing | Herewith (†) | ||||||||||
Exhibit No. | Exhibit Description | Form | File No. | Exhibit | Date | (as indicated) | ||||||
10.47** | 10-K | 001-15274 | 10.61 | 3/31/2009 | ||||||||
10.48** | 10-K | 001-15274 | 10.62 | 3/31/2009 | ||||||||
10.49** | 10-Q | 001-15274 | 10.2 | 9/9/2009 | ||||||||
10.50** | 10-Q | 001-15274 | 10.4 | 9/9/2009 | ||||||||
10.51** | 10-K | 001-15274 | 10.55 | 3/24/2017 | ||||||||
10.52** | 10-K | 001-15274 | 10.80 | 3/20/2013 | ||||||||
10.53** | 10-K | 001-15274 | 10.82 | 3/20/2013 | ||||||||
10.54** | 8-K | 001-15274 | 10.2 | 3/24/2014 | ||||||||
10.55** | 10-Q | 001-15274 | 10.4 | 6/4/2015 | ||||||||
10.56** | 10-Q | 001-15274 | 10.5 | 6/4/2015 | ||||||||
10.57** | 10-Q | 001-15274 | 10.6 | 6/4/2015 | ||||||||
10.58** | 10-K | 001-15274 | 10.73 | 3/16/2016 | ||||||||
10.59** | 10-K | 001-15274 | 10.74 | 3/16/2016 | ||||||||
10.60** | 10-Q | 001-15274 | 10.1 | 5/31/2016 | ||||||||
10.61** | 10-Q | 001-15274 | 10.2 | 8/30/2016 | ||||||||
10.62** | 10-Q | 001-15274 | 10.1 | 06/7/2017 | ||||||||
10.63** | 10-Q | 001-15274 | 10.2 | 06/7/2017 | ||||||||
10.64** | 10-Q | 001-15274 | 10.3 | 06/7/2017 | ||||||||
10.65** | 10-Q | 001-15274 | 10.2 | 11/28/2018 | ||||||||
10.66** | 10-Q | 001-15274 | 10.1 | 9/5/2018 | ||||||||
10.67** | 10-Q | 001-15274 | 10.2 | 9/5/2018 | ||||||||
10.68** | 10-Q | 001-15274 | 10.3 | 9/5/2018 | ||||||||
10.69** | 10-Q | 001-15274 | 10.5 | 5/30/2018 | ||||||||
10.70** | 10-Q | 001-15274 | 10.4 | 5/29/2019 | ||||||||
10.71** | 10-Q | 001-15274 | 10.2 | 8/28/2019 | ||||||||
48
Incorporated by Reference | ||||||||||||
Filed | ||||||||||||
SEC | Filing | Herewith (†) | ||||||||||
Exhibit No. | Exhibit Description | Form | File No. | Exhibit | Date | (as indicated) | ||||||
10.72** | 8-K | 001-15274 | 10.1 | 10/2/2018 | ||||||||
10.73** | 8-K | 001-15274 | 10.2 | 10/2/2018 | ||||||||
10.74** | 8-K | 001-15274 | 10.1 | 10/29/2018 | ||||||||
10.75** | 8-K | 001-15274 | 10.1 | 3/26/2019 | ||||||||
10.76** | 8-K | 001-15274 | 10.1 | 4/18/2019 | ||||||||
10.77** | 8-K | 001-15274 | 10.1 | 4/18/2019 | ||||||||
21 | † | |||||||||||
23 | † | |||||||||||
24 | † | |||||||||||
31.1 | † | |||||||||||
31.2 | † | |||||||||||
32.1 | † | |||||||||||
32.2 | † | |||||||||||
101.INS | XBRL Instance Document - the instance document does not appear in the Interactive Data File because its XBRL tags are embedded within the Inline XBRL document | † | ||||||||||
101.SCH | Inline XBRL Taxonomy Extension Schema Document | † | ||||||||||
101.CAL | Inline XBRL Taxonomy Extension Calculation Linkbase Document | † | ||||||||||
101.DEF | Inline XBRL Taxonomy Extension Definition Linkbase Document | † | ||||||||||
101.LAB | Inline XBRL Taxonomy Extension Label Linkbase Document | † | ||||||||||
101.PRE | Inline XBRL Taxonomy Extension Presentation Linkbase Document | † | ||||||||||
104 | Cover Page Interactive Data File, formatted in iXBRL and contained in Exhibit 101 | |||||||||||
** Indicates a management contract or compensatory plan or arrangement.
(b) See Exhibit Index above.
(c) Other Financial Statement Schedules. None.
Item 16. Form 10-K Summary
None.
49
SIGNATURES
Pursuant to the requirements of Section 13 or 15(d) of the Securities Exchange Act of 1934, the registrant has duly caused this report to be signed on its behalf by the undersigned, thereunto duly authorized.
J. C. PENNEY COMPANY, INC. | ||
(Registrant) | ||
By /s/ Steve Whaley | ||
Steve Whaley | ||
Senior Vice President, Principal Accounting Officer and Controller (principal accounting officer) | ||
Date: | March 20, 2020 | |
Pursuant to the requirements of the Securities Exchange Act of 1934, this report has been signed below by the following persons on behalf of the registrant and in the capacities and on the dates indicated.
Signatures | Title | Date | ||
Jill Soltau* | Chief Executive Officer; Director (principal executive officer) | March 20, 2020 | ||
Jill Soltau | ||||
Bill Wafford* | Executive Vice President, Chief Financial Officer (principal financial officer) | March 20, 2020 | ||
Bill Wafford | ||||
/s/ Steve Whaley | Senior Vice President, Principal Accounting Officer and Controller (principal accounting officer) | March 20, 2020 | ||
Steve Whaley | ||||
Ronald W. Tysoe* | Chairman of the Board; Director | March 20, 2020 | ||
Ronald W. Tysoe | ||||
Paul J. Brown* | Director | March 20, 2020 | ||
Paul J. Brown | ||||
Amanda Ginsberg* | Director | March 20, 2020 | ||
Amanda Ginsberg | ||||
W. Paul Jones* | Director | March 20, 2020 | ||
W. Paul Jones | ||||
Wonya Y. Lucas* | Director | March 20, 2020 | ||
Wonya Y. Lucas | ||||
B. Craig Owens* | Director | March 20, 2020 | ||
Craig Owens | ||||
50
Signatures | Title | Date | ||
Lisa A. Payne* | Director | March 20, 2020 | ||
Lisa A. Payne | ||||
Debora A. Plunkett* | Director | March 20, 2020 | ||
Debora A. Plunkett | ||||
Leonard H. Roberts* | Director | March 20, 2020 | ||
Leonard H. Roberts | ||||
Javier G. Teruel* | Director | March 20, 2020 | ||
Javier G. Teruel | ||||
R. Gerald Turner* | Director | March 20, 2020 | ||
R. Gerald Turner | ||||
*By: | /s/ Steve Whaley | |
Steve Whaley | ||
Attorney-in-fact | ||
51
J. C. PENNEY COMPANY, INC.
INDEX TO CONSOLIDATED FINANCIAL STATEMENTS
Page | |
52
REPORT OF INDEPENDENT REGISTERED PUBLIC ACCOUNTING FIRM
To the Stockholders and Board of Directors
J. C. Penney Company, Inc.:
Opinion on the Consolidated Financial Statements
We have audited the accompanying consolidated balance sheets of J. C. Penney Company, Inc. and subsidiaries (the Company) as of February 1, 2020 and February 2, 2019, the related consolidated statements of operations, comprehensive income/(loss), stockholders’ equity, and cash flows for each of the years in the three-year period ended February 1, 2020, and the related notes (collectively, the consolidated financial statements). In our opinion, the consolidated financial statements present fairly, in all material respects, the financial position of the Company as of February 1, 2020 and February 2, 2019, and the results of its operations and its cash flows for each of the years in the three-year period ended February 1, 2020, in conformity with U.S. generally accepted accounting principles.
We also have audited, in accordance with the standards of the Public Company Accounting Oversight Board (United States) (PCAOB), the Company’s internal control over financial reporting as of February 1, 2020, based on criteria established in Internal Control - Integrated Framework (2013) issued by the Committee of Sponsoring Organizations of the Treadway Commission, and our report dated March 20, 2020 expressed an unqualified opinion on the effectiveness of the Company’s internal control over financial reporting.
Change in Accounting Principle
As discussed in Note 3 to the consolidated financial statements, the Company has changed its method of accounting for leasing transactions as of February 3, 2019 due to the adoption of Financial Accounting Standards Board's Accounting Standards Update (ASU) No. 2016-02, Leases (Topic 842), as amended.
Basis for Opinion
These consolidated financial statements are the responsibility of the Company’s management. Our responsibility is to express an opinion on these consolidated financial statements based on our audits. We are a public accounting firm registered with the PCAOB and are required to be independent with respect to the Company in accordance with the U.S. federal securities laws and the applicable rules and regulations of the Securities and Exchange Commission and the PCAOB.
We conducted our audits in accordance with the standards of the PCAOB. Those standards require that we plan and perform the audit to obtain reasonable assurance about whether the consolidated financial statements are free of material misstatement, whether due to error or fraud. Our audits included performing procedures to assess the risks of material misstatement of the consolidated financial statements, whether due to error or fraud, and performing procedures that respond to those risks. Such procedures included examining, on a test basis, evidence regarding the amounts and disclosures in the consolidated financial statements. Our audits also included evaluating the accounting principles used and significant estimates made by management, as well as evaluating the overall presentation of the consolidated financial statements. We believe that our audits provide a reasonable basis for our opinion.
Critical Audit Matter
The critical audit matter communicated below is a matter arising from the current period audit of the consolidated financial statements that was communicated or required to be communicated to the audit committee and that: (1) relates to accounts or disclosures that are material to the consolidated financial statements and (2) involved our especially challenging, subjective, or complex judgments. The communication of a critical audit matter does not alter in any way our opinion on the consolidated financial statements, taken as a whole, and we are not, by communicating the critical audit matter below, providing a separate opinion on the critical audit matter or on the accounts or disclosures to which it relates.
Assessment of the carrying value of the indefinite-lived intangible asset associated with the Liz Claiborne® family of trademarks and related intellectual property
As discussed in Notes 2 and 7 to the consolidated financial statements, the indefinite-lived intangible assets, net balance as of February 1, 2020 was $275 million. The Company performs indefinite-lived intangible asset impairment testing at least annually during the fourth quarter or more frequently whenever events or changes in circumstances indicate that the carrying amount may not be fully recoverable. The Company tests the indefinite-lived intangible asset utilizing the relief from royalty method to determine the estimated fair value.
53
We identified the assessment of the carrying value of the indefinite-lived intangible asset associated with the Liz Claiborne® family of trademarks and related intellectual property as a critical audit matter. The sales projections, growth rates, royalty rate, and discount rate used in the determination of the fair value of the indefinite-lived intangible asset were challenging to assess as changes to those assumptions could have a significant effect on the Company’s assessment of their carrying value.
The primary procedures we performed to address this critical audit matter included the following. We tested certain internal controls over the Company’s indefinite-lived intangible asset impairment assessment process. This included controls related to the determination of the fair value of the indefinite-lived intangible asset, including the related sales projections, growth rates, royalty rate, and the discount rate. We compared the Company’s historical sales projections for Liz Claiborne® to actual results for the same period to assess the Company’s ability to accurately forecast. We compared the Company’s sales projections for Liz Claiborne® to the sales projections in the Company's and its peer companies' analyst reports. We performed sensitivity analyses over the sales projections, growth rates, royalty rate, and discount rate assumptions to assess the impact of changes in those assumptions on the Company’s determination that the fair value of the Liz Claiborne® indefinite-lived intangible asset exceeded its carrying value. We involved a valuation professional with specialized skill and knowledge, who assisted in:
– | evaluating the Company’s discount and royalty rates, by comparing them against the discount rate range and royalty rate range that were independently developed using publicly available comparable market data; and |
– | developing an estimated range of the Liz Claiborne® indefinite-lived intangible asset’s fair value using the Company’s estimated cash flow projections and an independently developed discount rate range and royalty rate, and comparing the results to the Company’s estimate of fair value. |
/s/ KPMG LLP
We have served as the Company’s auditor since 1916.
Dallas, Texas
March 20, 2020
54
CONSOLIDATED STATEMENTS OF OPERATIONS
(In millions, except per share data) | 2019 | 2018 | 2017 | |||||||||
Total net sales | $ | $ | $ | |||||||||
Credit income and other | ||||||||||||
Total revenues | ||||||||||||
Costs and expenses/(income): | ||||||||||||
Cost of goods sold (exclusive of depreciation and amortization shown separately below) | ||||||||||||
Selling, general and administrative (SG&A) | ||||||||||||
Depreciation and amortization | ||||||||||||
Real estate and other, net | ( | ) | ( | ) | ( | ) | ||||||
Restructuring and management transition | ||||||||||||
Total costs and expenses | ||||||||||||
Operating income/(loss) | ( | ) | ( | ) | ||||||||
Other components of net periodic pension and postretirement benefit cost/(income) | ( | ) | ( | ) | ||||||||
(Gain)/loss on extinguishment of debt | ( | ) | ||||||||||
Net interest expense | ||||||||||||
Income/(loss) before income taxes | ( | ) | ( | ) | ( | ) | ||||||
Income tax expense/(benefit) | ( | ) | ( | ) | ||||||||
Net income/(loss) | $ | ( | ) | $ | ( | ) | $ | ( | ) | |||
Earnings/(loss) per share: | ||||||||||||
Basic | $ | ( | ) | $ | ( | ) | $ | ( | ) | |||
Diluted | ( | ) | ( | ) | ( | ) | ||||||
Weighted average shares – basic | ||||||||||||
Weighted average shares – diluted | ||||||||||||
See the accompanying notes to the Consolidated Financial Statements.
55
CONSOLIDATED STATEMENTS OF COMPREHENSIVE INCOME/(LOSS)
($ in millions) | 2019 | 2018 | 2017 | |||||||||
Net income/(loss) | $ | ( | ) | $ | ( | ) | $ | ( | ) | |||
Other comprehensive income/(loss), net of tax: | ||||||||||||
Retirement benefit plans | ||||||||||||
Net actuarial gain/(loss) arising during the period (1) | ( | ) | ||||||||||
Reclassification of net actuarial (gain)/loss from a settlement (2) | ||||||||||||
Reclassification for net actuarial (gain)/loss (3) | ( | ) | ||||||||||
Reclassification for amortization of prior service (credit)/cost (4) | ||||||||||||
Reclassification of prior service (credit)/cost from a curtailment (5) | ||||||||||||
Cash flow hedges | ||||||||||||
Gain/(loss) on interest rate swaps (6) | ( | ) | ( | ) | ||||||||
Reclassification for periodic settlements (7) | ( | ) | ( | ) | ||||||||
Foreign currency translation | ||||||||||||
Unrealized gain/(loss) | ( | ) | ||||||||||
Total other comprehensive income/(loss), net of tax | ( | ) | ||||||||||
Total comprehensive income/(loss), net of tax | $ | ( | ) | $ | ( | ) | $ | ( | ) | |||
(1) | Net of $ |
(2) | Net of $( |
(3) | Net of $( |
(4) | Net of $( |
(5) | Net of $( |
(6) | Net of $ |
(7) | Net of $ |
See the accompanying notes to the Consolidated Financial Statements.
56
CONSOLIDATED BALANCE SHEETS
($ in millions, except per share data) | 2019 | 2018 | ||||||
Assets | ||||||||
Current assets: | ||||||||
Cash in banks and in transit | $ | $ | ||||||
Cash short-term investments | ||||||||
Cash and cash equivalents | ||||||||
Merchandise inventory | ||||||||
Prepaid expenses and other | ||||||||
Total current assets | ||||||||
Property and equipment, net | ||||||||
Operating lease assets | ||||||||
Prepaid pension | ||||||||
Other assets | ||||||||
Total Assets | $ | $ | ||||||
Liabilities and Stockholders’ Equity | ||||||||
Current liabilities: | ||||||||
Merchandise accounts payable | $ | $ | ||||||
Other accounts payable and accrued expenses | ||||||||
Current operating lease liabilities | ||||||||
Current portion of finance leases and note payable | ||||||||
Current maturities of long-term debt | ||||||||
Total current liabilities | ||||||||
Noncurrent operating lease liabilities | ||||||||
Long-term finance leases and note payable | ||||||||
Long-term debt | ||||||||
Deferred taxes | ||||||||
Other liabilities | ||||||||
Total Liabilities | ||||||||
Stockholders' Equity | ||||||||
Common stock (1) | ||||||||
Additional paid-in capital | ||||||||
Reinvested earnings/(accumulated deficit) | ( | ) | ( | ) | ||||
Accumulated other comprehensive income/(loss) | ( | ) | ( | ) | ||||
Total Stockholders’ Equity | ||||||||
Total Liabilities and Stockholders’ Equity | $ | $ | ||||||
(1) |
See the accompanying notes to the Consolidated Financial Statements.
57
CONSOLIDATED STATEMENTS OF STOCKHOLDERS’ EQUITY
(in millions) | Number of Common Shares | Common Stock | Additional Paid-in Capital | Reinvested Earnings/ (Accumulated Deficit) | Accumulated Other Comprehensive Income/(Loss) | Total Stockholders' Equity | |||||||||||||||||
January 28, 2017 | $ | $ | $ | ( | ) | $ | ( | ) | $ | ||||||||||||||
Net income/(loss) | — | ( | ) | ( | ) | ||||||||||||||||||
Other comprehensive income/(loss) | — | ||||||||||||||||||||||
Stock-based compensation | |||||||||||||||||||||||
February 3, 2018 | $ | $ | $ | ( | ) | $ | ( | ) | $ | ||||||||||||||
Net income/(loss) | — | ( | ) | ( | ) | ||||||||||||||||||
Other comprehensive income/(loss) | — | ||||||||||||||||||||||
Stock-based compensation and other | |||||||||||||||||||||||
February 2, 2019 | $ | $ | $ | ( | ) | $ | ( | ) | $ | ||||||||||||||
ASU 2016-02 (Leases) and ASU 2018-02 (Stranded Taxes) adoption (See Note 3) | — | ( | ) | ||||||||||||||||||||
Net income/(loss) | — | ( | ) | ( | ) | ||||||||||||||||||
Other comprehensive income/(loss) | — | ( | ) | ( | ) | ||||||||||||||||||
Stock-based compensation and other | |||||||||||||||||||||||
February 1, 2020 | $ | $ | $ | ( | ) | $ | ( | ) | $ | ||||||||||||||
See the accompanying notes to the Consolidated Financial Statements.
58
CONSOLIDATED STATEMENTS OF CASH FLOWS
($ in millions) | 2019 | 2018 | 2017 | ||||||||
Cash flows from operating activities | |||||||||||
Net income/(loss) | $ | ( | ) | $ | ( | ) | $ | ( | ) | ||
Adjustments to reconcile net income/(loss) to net cash provided by/(used in) operating activities: | |||||||||||
Restructuring and management transition | ( | ) | |||||||||
Asset impairments and other charges | |||||||||||
Net gain on sale of non-operating assets | ( | ) | |||||||||
Net gain on sale of operating assets | ( | ) | ( | ) | ( | ) | |||||
(Gain)/loss on extinguishment of debt | ( | ) | |||||||||
Depreciation and amortization | |||||||||||
Benefit plans | ( | ) | ( | ) | |||||||
Stock-based compensation | |||||||||||
Other comprehensive income tax benefits | ( | ) | ( | ) | |||||||
Deferred taxes | ( | ) | ( | ) | ( | ) | |||||
Change in cash from: | |||||||||||
Inventory | |||||||||||
Prepaid expenses and other assets | ( | ) | ( | ) | |||||||
Merchandise accounts payable | ( | ) | ( | ) | ( | ) | |||||
Income taxes | ( | ) | |||||||||
Accrued expenses and other | ( | ) | ( | ) | ( | ) | |||||
Net cash provided by/(used in) operating activities | |||||||||||
Cash flows from investing activities | |||||||||||
Capital expenditures | ( | ) | ( | ) | ( | ) | |||||
Proceeds from sale of non-operating assets | |||||||||||
Proceeds from sale of operating assets | |||||||||||
Joint venture return of investment | |||||||||||
Insurance proceeds received for damage to property and equipment | |||||||||||
Net cash provided by/(used in) investing activities | ( | ) | ( | ) | ( | ) | |||||
Cash flows from financing activities | |||||||||||
Proceeds from issuance of long-term debt | |||||||||||
Proceeds from borrowings under the credit facility | |||||||||||
Payments of borrowings under the credit facility | ( | ) | ( | ) | ( | ) | |||||
Premium on early retirement of debt | ( | ) | ( | ) | |||||||
Payments of finance leases and note payable | ( | ) | ( | ) | ( | ) | |||||
Payments of long-term debt | ( | ) | ( | ) | ( | ) | |||||
Financing costs | ( | ) | ( | ) | |||||||
Proceeds from stock issued under stock plans | |||||||||||
Tax withholding payments for vested restricted stock | ( | ) | ( | ) | ( | ) | |||||
Net cash provided by/(used in) financing activities | ( | ) | ( | ) | ( | ) | |||||
Net increase/(decrease) in cash and cash equivalents | ( | ) | ( | ) | |||||||
Cash and cash equivalents at beginning of period | |||||||||||
Cash and cash equivalents at end of period | $ | $ | $ | ||||||||
See the accompanying notes to the Consolidated Financial Statements.
59
NOTES TO CONSOLIDATED FINANCIAL STATEMENTS
1. Basis of Presentation and Consolidation
Nature of Operations
Our Company was founded by James Cash Penney in 1902 and has grown to be a major national retailer, operating 846 department stores in 49 states and Puerto Rico, as well as through our eCommerce website at jcp.com and our mobile application. We sell family apparel and footwear, accessories, fine and fashion jewelry, beauty products through Sephora inside JCPenney, and home furnishings. In addition, our department stores provide services, such as styling salon, optical, portrait photography and custom decorating, to customers.
Basis of Presentation and Consolidation
The Consolidated Financial Statements present the results of J. C. Penney Company, Inc. and our subsidiaries (the Company or JCPenney). All significant inter-company transactions and balances have been eliminated in consolidation.
We are a holding company whose principal operating subsidiary is J. C. Penney Corporation, Inc. (JCP). JCP was incorporated in Delaware in 1924, and J. C. Penney Company, Inc. was incorporated in Delaware in 2002, when the holding company structure was implemented. The holding company has no direct subsidiaries other than JCP, and has no independent assets or operations.
The Company is a co-obligor (or guarantor, as appropriate) regarding the payment of principal and interest on JCP’s outstanding debt securities. We guarantee certain of JCP’s outstanding debt securities fully and unconditionally.
Fiscal Year
Our fiscal year ends on the Saturday closest to January 31. Unless otherwise stated, references to years in this report relate to fiscal years rather than to calendar years.
Fiscal Year | Ended | Weeks | ||
2019 | February 1, 2020 | 52 | ||
2018 | February 2, 2019 | 52 | ||
2017 | February 3, 2018 | 53 | ||
Use of Estimates and Assumptions
Reclassifications
Certain prior period amounts have been reclassified to conform to the current period presentation. None of the reclassifications affected our net income/(loss) in any period.
2. Significant Accounting Policies
Revenue
Our contracts with customers primarily consist of sales of merchandise and services at the point of sale, sales of gift cards to a customer for a future purchase, customer loyalty rewards that provide discount rewards to customers based on purchase activity, and certain licensing and profit sharing arrangements involving the use of our intellectual property by others. Revenue includes Total net sales and Credit income and other. Net sales are categorized by merchandise and service sale groupings as we believe it best depicts the nature, amount, timing and uncertainty of revenue and cash flow.
Credit income and other encompasses the revenue earned from the agreement with Synchrony Financial (Synchrony) associated with our private label credit card and co-branded MasterCard® programs.
60
Merchandise and Service Sales
Total net sales, which exclude sales taxes, are generally recorded when payment is received and the customer takes control of the merchandise. Service revenue is recorded at the time the customer receives the benefit of the service, such as salon, portrait, optical or custom decorating. Shipping and handling fees charged to customers are also included in total net sales with corresponding costs recorded as cost of goods sold. Net sales are not recognized for estimated future returns which are estimated based primarily on historical return rates and sales levels.
Gift Card Revenue
At the time gift cards are sold a performance obligation is created and no revenue is recognized; rather, a contract liability is established for our obligation to provide a merchandise or service sale to the customer for the face value of the card. The contract liability is relieved and a net sale is recognized when gift cards are redeemed for merchandise or services. We recognize gift card breakage, net of required escheatment, over the redemption pattern of gift cards. Breakage is estimated based on historical redemption patterns and the estimates can vary based on changes in the usage patterns of our customers.
Customer Loyalty Rewards
Customers who spend a certain amount with us using our private label card or registered loyalty card receive points that can accumulate towards earning JCPenney Rewards certificates, which are redeemable for a discount on future purchases. Points earned by a loyalty customer do not expire but any certificates earned expire two months from the date of issuance. We account for our customer loyalty rewards by deferring a portion of our sales to loyalty points expected to be earned towards a reward certificate, and then recognize the reward certificate as a net sale when used by the customer in connection with a merchandise or service sale. The points earned toward a future reward are valued at their relative standalone selling price by applying fair value based on historical redemption patterns.
Licensing Agreements
Our private label credit card and co-branded MasterCard® programs are owned and serviced by Synchrony. Under our agreement, we receive periodic cash payments from Synchrony based upon the consumer's usage of co-branded card and the performance of the credit card portfolio. We participate in the programs by providing marketing promotions designed to increase the use of each card, including enhanced marketing offers for cardholders. Additionally, we accept payments in our stores from cardholders who prefer to pay in person when they are shopping in our locations. Revenue related to this agreement is recognized over the time we have fulfilled our deliverables and is reflected in Credit income and other.
Principal Versus Agent
We assess principal versus agent considerations depending on our control of the good or service before it is transferred to the customer. When we are the principal and have control of the specified good or service, we include as a net sale the gross amount of consideration to which we expect to be entitled for that specified good or service in revenue. In contrast, when we are the agent and do not have control of the specified good or service, we include as a net sale the fee or commission to which we expect to be entitled for the agency service. In certain instances, the fee or commission might be the net amount retained after paying the supplier.
Cost of Goods Sold (Exclusive of Depreciation and Amortization)
Cost of goods sold includes costs directly related to bringing merchandise to its final selling destination. These costs include the cost of the merchandise (net of discounts or allowances earned), sourcing and procurement costs, buying and brand development costs, including buyers’ salaries and related expenses, royalties and design fees, freight costs, warehouse operating expenses, merchandise examination, inspection and testing, store merchandise distribution center expenses, including rent, and shipping and handling costs incurred on eCommerce sales.
Vendor Allowances
We receive vendor support in the form of cash payments or allowances for a variety of reimbursements such as cooperative advertising, markdowns, vendor shipping and packaging compliance, defective merchandise, the purchase of vendor specific fixtures and other vendor contributions. We have agreements in place with each vendor setting forth the specific conditions for each allowance or payment. Depending on the arrangement, we either recognize the allowance as a reduction of current costs or defer the payment over the period the related merchandise is sold. If the payment is a reimbursement for costs incurred, it is generally offset against those related costs; otherwise, it is treated as a reduction to the cost of merchandise.
Markdown reimbursements related to merchandise that has been sold are negotiated and documented by our buying teams and are credited directly to cost of goods sold in the period an agreement has been reached. Vendor allowances received prior to merchandise being sold are deferred and recognized as a reduction of inventory and credited to cost of goods sold based on an inventory turnover rate.
61
Vendor compliance credits reimburse us for incremental merchandise handling expenses incurred due to a vendor’s failure to comply with our established shipping or merchandise preparation requirements. Vendor compliance credits are recorded as a reduction of merchandise handling costs.
Selling, General and Administrative Expenses
SG&A expenses include the following costs, except as related to merchandise buying, sourcing, warehousing or distribution activities: salaries, marketing costs, occupancy and rent expense, utilities and maintenance, pre-opening expenses, costs related to information technology, administrative costs related to our home office and district and regional operations, real and personal property and other taxes (excluding income taxes) and credit/debit card fees.
Advertising
Income Taxes
Earnings/(Loss) per Share
Basic earnings/(loss) per share (EPS) is computed by dividing net income/(loss) by the weighted-average number of common shares outstanding during the period. Diluted EPS is computed by dividing net income/(loss) by the weighted-average number of common shares outstanding during the period plus the number of additional common shares that would have been outstanding if the potentially dilutive shares had been issued. Potentially dilutive shares include stock options, unvested restricted stock units and awards and a warrant outstanding during the period, using the treasury stock method. Potentially dilutive shares are excluded from the computations of diluted EPS if their effect would be anti-dilutive.
Cash and Cash Equivalents
Cash and cash equivalents include cash short-term investments that are highly liquid investments with original maturities of three months or less. Cash short-term investments consist primarily of short-term U.S. Treasury money market funds and a portfolio of highly rated bank deposits and are stated at cost, which approximates fair market value due to the short-term maturity. Cash in banks and in transit also include credit card sales transactions that are settled early in the following period.
Merchandise Inventory
Inventories are valued at the lower of cost (using the first-in, first-out or “FIFO” method) or market using the retail method (RIM). Under RIM, retail values of merchandise groups are converted to a cost basis by applying the specific average cost-to-retail ratio related to each merchandise grouping.
In 2017, we changed our method of accounting for merchandise inventories for our eCommerce operations from the lower of standard cost (representing average vendor costs) or net realizable value to the lower of cost or market using RIM. Along with this change, we retired certain legacy systems and implemented a new module of our enterprise resource planning system to account for merchandise inventories.
Shrinkage accruals are estimated as a percent of sales for a given period based on physical inventory counts or cycle count activities. Physical inventory counts for stores are taken at least annually and cycle count activities for distribution centers and regional warehouses are executed on a daily basis. Inventory records and shrinkage accruals are adjusted based on the actual results from physical inventories and cycle counts. The shrinkage rate from the most recent physical inventory and cycle count
62
activity, in combination with current events and historical experience, is used as the standard for the shrinkage accrual rate for the next inventory cycle or cycle count activity. Historically, our actual physical inventory and cycle counts results have shown our estimates to be reliable.
Property and Equipment, Net
Estimated Useful Lives | ||||||||||
($ in millions) | (Years) | 2019 | 2018 | |||||||
Land | N/A | $ | $ | |||||||
Buildings | ||||||||||
Furniture and equipment | 3-20 | |||||||||
Leasehold improvements (1) | ||||||||||
Finance leases (equipment) | 3-5 | |||||||||
Accumulated depreciation | ( | ) | ( | ) | ||||||
Property and equipment, net | $ | $ | ||||||||
(1) | Leasehold improvements are depreciated over the shorter of the estimated useful lives of the improvements or the term of the lease, including renewals determined to be reasonably certain. |
Property and equipment is stated at cost less accumulated depreciation. Depreciation is computed primarily by using the straight-line method over the estimated useful lives of the related assets.
We expense routine maintenance and repairs when incurred. We capitalize major replacements and improvements. We remove the cost of assets sold or retired and the related accumulated depreciation or amortization from the accounts and include any resulting gain, loss or impairment in net income/(loss).
We recognize a liability for the fair value of our conditional asset retirement obligations, which are primarily related to asbestos removal, when probable and if the liability’s fair value can be reasonably estimated.
Capitalized Software Costs
We capitalize costs associated with the acquisition or development of major software for internal use in other assets in our Consolidated Balance Sheets and amortize the asset over the expected useful life of the software, generally between three and seven years. We only capitalize subsequent additions, modifications or upgrades to internal-use software to the extent that such changes allow the software to perform a task it previously did not perform. We expense software maintenance and training costs as incurred.
Cloud computing arrangements are evaluated to determine whether the arrangement includes a software license or is a service contract. If determined to be a software license, then the arrangement is capitalized as an other asset and amortized over the expected life of software, generally between three to seven years. If determined to be a service contract, then the cost of the arrangement is expensed as the services are provided.
Impairment of Long-Lived and Indefinite-Lived Assets
63
We assess the recoverability of indefinite-lived intangible assets at least annually during the fourth quarter of our fiscal year or whenever events or changes in circumstances indicate that the carrying amount of the indefinite-lived intangible asset may not be fully recoverable. Examples of a change in events or circumstances include, but are not limited to, a decrease in the market price of the asset, a history of cash flow losses related to the use of the asset or a significant adverse change in the extent or manner in which an asset is being used. We test our indefinite-lived intangible assets utilizing the relief from royalty method to determine the estimated fair value for each indefinite-lived intangible asset. The relief from royalty method estimates our theoretical royalty savings from ownership of the intangible asset. Key assumptions used in this model include discount rates, royalty rates, growth rates, sales projections and terminal value rates.
Leases
Accounting Policy Applied in Fiscal 2019
At the lease commencement date, based on certain criteria, we determine if a lease is classified as an operating lease or finance lease and then recognize a right-of-use asset and a lease liability on the Consolidated Balance Sheets for all leases (with the exception of leases that have a term of twelve months or less). The lease liability is measured as the present value of unpaid lease payments measured based on the reasonably certain lease term and corresponding discount rate. The initial right-of-use asset is measured as the lease liability plus certain other costs and is reduced by any tenant allowances collected from the lessor.
Lease payments include fixed and in-substance fixed payments, variable payments based on an index or rate and termination penalties. Lease payments do not include variable lease components other than those that depend on an index or rate or any payments not considered part of the lease (i.e. payment of the lessor’s real estate taxes and insurance). Payments not considered lease payments are expensed as incurred. Some leases require additional payments based on sales and the related contingent rent is recorded as rent expense when the payment is probable. As a policy election, we consider lease payments and all related other payments as one component of a lease.
The reasonably certain lease term includes the non-cancelable lease term and any renewal option periods where we have economically compelling reasons for future exercise.
The discount rate used in our present value calculations is the rate implicit in the lease, when known, or our estimated incremental borrowing rate. Our incremental borrowing rate is estimated based on our secured borrowings and our credit risk relative to the time horizons of other publicly available data points that are consistent with the respective lease term.
Whether an operating lease or a finance lease, the lease liability is amortized over the lease term at a constant periodic interest rate. The right-of-use assets related to operating leases are amortized over the lease term on a basis that renders a straight-line amount of rent expense which encompasses the amortization and interest component of the lease. With the occurrence of certain events, the amortization pattern for an operating asset is adjusted to a straight-line basis over the remaining lease term. The right-of-use asset related to a finance lease is amortized on a straight-line basis over the lease term. Rent on short-term leases is expensed on a straight-line basis over the lease term. When a lease is modified or there is a change in lease term, we assess for any change in lease classification and remeasure the lease liability with a corresponding increase or decrease to the right-of-use asset.
Sale-leasebacks are transactions through which we sell assets and subsequently lease them back. The resulting leases that qualify for sale-leaseback accounting are evaluated and accounted for as an operating lease. A transaction that does not qualify for sale-leaseback accounting as a result of finance lease classification or the failure to meet certain revenue recognition criteria is accounted for as a financing transaction. For a financing transaction, we retain the "sold" assets within property and equipment and record a financing obligation equal to the amount of cash proceeds received. Rental payments under such transactions are recognized as a reduction of the financing obligation and as interest expense using an effective interest method.
Accounting Policy Applied in Fiscal 2018
Our lease accounting policies for lease contracts in fiscal 2018 and prior are disclosed in the 2018 Annual Report on Form 10-K.
Exit or Disposal Activity Costs
64
Retirement-Related Benefits
We recognize the funded status – the difference between the fair value of plan assets and the plan’s benefit obligation – of our defined benefit pension and postretirement plans directly on the Consolidated Balance Sheet. Each overfunded plan is recognized as an asset and each underfunded plan is recognized as a liability. We adjust other comprehensive income/(loss) to reflect prior service cost or credits and actuarial gain or loss amounts arising during the period and reclassification adjustments for amounts being recognized as components of net periodic pension/postretirement cost, net of tax. Prior service cost or credits are amortized to net income/(loss) over the average remaining service period, a period of about eight years for the primary plan. Pension related actuarial gains or losses in excess of 10% of the greater of the fair value of plan assets or the plan's projected benefit obligation (the corridor) are recognized annually in the fourth quarter each year (Mark-to-market (MTM) adjustment), and, if applicable, in any interim period in which an interim remeasurement is triggered.
We measure the plan assets and obligations annually at the adopted measurement date of January 31 to determine pension expense for the subsequent year. The factors and assumptions affecting the measurement are the characteristics of the population and salary increases, with the most important being the expected return on plan assets and the discount rate for the pension obligation. We use actuarial calculations for the assumptions, which require significant judgment.
Stock-Based Compensation
Stock options are valued primarily using the Black-Scholes option pricing model and are granted with an exercise price equal to the closing price of our common stock on the grant date. Time-based and performance-based restricted stock awards are valued using the closing price of our common stock on the grant date. Our current plan does not permit awarding stock options below grant-date market value nor does it allow any repricing subsequent to the date of grant.
Stock options are valued using the following assumptions:
• | Valuation Method. We estimate the fair value of stock option awards on the date of grant using primarily the Black-Scholes option pricing model. |
• | Expected Term. Our expected option term represents the average period that we expect stock options to be outstanding and is determined based on our historical experience, giving consideration to contractual terms, vesting schedules, anticipated stock prices and expected future behavior of option holders. |
• | Expected Volatility. Our expected volatility is based on a blend of the historical volatility of JCPenney stock combined with an estimate of the implied volatility derived from exchange traded options. |
• | Risk-Free Interest Rate. Our risk-free interest rate is based on zero-coupon U.S. Treasury yields in effect at the date of grant with the same period as the expected option life. |
• | Expected Dividend Yield. The dividend assumption is based on our current expectations about our dividend policy. |
Employee stock options and time-based and performance-based restricted stock awards typically vest over periods ranging from one to three years and employee stock options have a maximum term of 10 years. Estimates of forfeitures are incorporated at the grant date and are adjusted if actual results are different from initial estimates. For awards that have performance conditions, the probability of achieving the performance condition is evaluated each reporting period, and if the performance condition is expected to be achieved, the related compensation expense is recorded over the remaining service period. In addition, certain performance-based restricted stock awards may be granted where the number of shares may be increased to the maximum or reduced to the minimum threshold based on the results of the performance metrics in accordance with the terms established at the time of the award. In the event that performance conditions are not achieved and the awards do not vest, compensation expense is reversed.
3. Adoption of New Accounting Standards
In February 2016, the Financial Accounting Standards Board (FASB) issued Accounting Standards Update (ASU) 2016-02, Leases (Topic 842), as amended, which requires lessees to recognize most leases on their balance sheets as lease liabilities with corresponding right-of-use assets. The Company adopted the provisions of the new lease standard effective February 3, 2019,
65
using the modified retrospective adoption method and the simplified transition option available in the new lease standard. This allows us to continue to apply the legacy guidance in the old standard (ASC Topic 840, Leases (ASC 840)), including its disclosure requirements, in the comparative periods presented in the year of adoption. The Company also elected the package of practical expedients available under the transition provisions of the new lease standard, which include a) not reassessing ASC 840 evaluations on whether expired or existing contracts contain leases, b) not reassessing lease classification previously assessed under ASC 840, and c) not revaluing initial direct costs for existing leases under ASC 840. We also elected the practical expedient to carry forward our historical accounting for any land easements on existing contracts.
In addition, the Company changed the accounting for the failed sale-leaseback of its home office to comply with the new lease standard's guidance for sale-leaseback accounting, and recorded a "day one impairment" of the new right-of-use assets that were included in previously impaired asset groups associated with long-lived assets. Per the transition guidance of the new lease standard, the failed sale-leaseback is considered a valid sale and leaseback that resulted in the removal of the related real estate assets of $153 million and the financing obligation of $208 million, and the recognition of the $55 million gain on sale in Reinvested earnings/(accumulated deficit). Adoption of the new lease accounting standard also required us to reevaluate the accounting for a $50 million promissory note issued in connection with the sale of the home office. In accordance with previous guidance, the promissory note was not recorded in the Consolidated Balance Sheets and not included in the implied gain on sale, however, under the new guidance, the promissory note is considered variable consideration under ASC 606, Revenue for Contracts with Customers. Accordingly, in transition, the Company did not recognize any amount for the $50 million promissory note, as management assessed the most likely amount of variable consideration to be zero given the associated local real estate market dynamics. There were no changes to the measurement of this variable consideration as of year end. In regards to the "day one impairment" charge, the Company evaluated the new right-of-use assets added to certain store asset groups that were previously determined to be impaired. Given the facts and circumstances that were still in existence upon adopting the new lease standard, the Company recorded an approximate $39 million impairment charge to Reinvested earnings/(accumulated deficit) to adjust the net book value of the new right-of-use assets to their fair value.
The following table provides the overall Consolidated Balance Sheet impact of applying the new lease standard effective as of February 3, 2019. Due to the change in accounting for the Home Office sale-leaseback, there was a change in classification of $20 million of lease costs that were recorded as elements of Depreciation and amortization and Net interest expense in 2018 that are reported as Selling, general and administrative expenses in 2019. There was no significant impact to the Company's Consolidated Statement of Cash Flows.
Balance as of February 3, 2019 | |||||||||||
($ in millions) | Balances removed under prior accounting | Balances added/reclassified under new lease standard | Net impact of new lease standard | ||||||||
Prepaid expenses and other | $ | $ | ( | ) | $ | ( | ) | ||||
Property and equipment | ( | ) | |||||||||
Operating lease assets | |||||||||||
Other assets | ( | ) | ( | ) | |||||||
Total assets | $ | $ | $ | ||||||||
Other accounts payable and accrued expenses | $ | $ | ( | ) | $ | ( | ) | ||||
Current operating lease liabilities | |||||||||||
Current portion of finance leases and note payable | ( | ) | |||||||||
Noncurrent operating lease liabilities | |||||||||||
Long-term finance leases and note payable | ( | ) | |||||||||
Deferred taxes | ( | ) | |||||||||
Other liabilities | ( | ) | ( | ) | |||||||
Reinvested earnings/(accumulated deficit) | ( | ) | |||||||||
Total liabilities and stockholders’ equity | $ | $ | $ | ||||||||
In February 2018, the FASB issued ASU 2018-02, Income Statement-Reporting Comprehensive Income (Topic 220): Reclassification of Certain Tax Effects from Accumulated Other Comprehensive Income. This standard allows companies to reclassify stranded tax effects resulting from the Tax Cuts and Jobs Act (the “Tax Act”) enacted on December 22, 2017 from
66
Accumulated other comprehensive income/(loss) to Reinvested earnings/(accumulated deficit). We adopted ASU 2018-02 on February 3, 2019 and reclassified $53 million (net of federal income tax benefit) of income tax effects of the Tax Act from Accumulated other comprehensive income/(loss) to Reinvested earnings/(accumulated deficit).
4. Effect of New Accounting Standards
In June 2016, the FASB issued Accounting Standards Update (ASU) 2016-13, Financial Instruments—Credit Losses (Topic 326): Measurement of Credit Losses on Financial Instruments, which changes the impairment model for most financial assets and certain other instruments. Under the new guidance, entities will be required to measure expected credit losses for financial instruments, including trade receivables, based on historical experience, current conditions and reasonable forecasts. This standard will be effective for public entities for fiscal years, and interim periods within those fiscal years, beginning after December 15, 2019. We do not expect the adoption of this new standard will have a material impact on the consolidated financial statements.
In August 2018, the FASB issued ASU 2018-13, Fair Value Measurement. This standard is effective for public business entities in fiscal years beginning after December 15, 2019, and for interim periods within those years. Early adoption is permitted, including during an interim period. This new standard requires changes to the disclosure requirements for fair value measurements for certain Level 3 items, and specifies that some of the changes must be applied prospectively, while others should be applied retrospectively. We are evaluating this new standard but do not expect it to have a significant impact on our financial statement disclosures.
In August 2018, the FASB issued ASU 2018-14, Compensation—Retirement Benefits—Defined Benefit Plans—General (Subtopic 715-20): Disclosure Framework—Changes to the Disclosure Requirements for Defined Benefit Plans, which removes certain disclosures that are no longer cost beneficial and also includes additional disclosures to improve the overall usefulness of the disclosure requirements to financial statement users. This standard will be effective for public entities for fiscal years beginning after December 15, 2020, however early adoption is permitted. We are evaluating this new standard but do not expect it to have a significant impact on our financial statement disclosures.
In August 2018, the FASB issued ASU 2018-15, Intangibles—Goodwill and Other—Internal-Use Software (Subtopic 350-40):
Customer’s Accounting for Implementation Costs Incurred in a Cloud Computing Arrangement That Is a Service Contract. This standard aligns the requirements for capitalizing implementation costs incurred in a hosting arrangement that is a service contract with the requirements for capitalizing implementation costs incurred to develop or obtain internal-use software. This standard will be effective for public entities for fiscal years, and interim periods within those fiscal years, beginning after December 15, 2019, however early adoption is permitted. We do not expect the adoption of this new standard will have a material impact on the consolidated financial statements.
In December 2019, the FASB issued ASU 2019-12, Simplifying the Accounting for Income Taxes (Topic 740), which simplifies the accounting for income taxes by eliminating certain exceptions to the guidance in ASC 740 related to the approach for intraperiod tax allocation, the methodology for calculating income taxes in an interim period and the recognition of deferred tax liabilities for outside basis differences. The standard also simplifies aspects of the accounting for franchise taxes and enacted changes in tax laws or rates and clarifies the accounting for transactions that result in a step-up in the tax basis of goodwill. This standard will be effective for public entities for fiscal years, and interim periods within those fiscal years, beginning after December 15, 2020, however early adoption is permitted. We are currently evaluating the impact of this new standard on the consolidated financial statements.
67
5. Earnings/(Loss) per Share
Net income/(loss) and shares used to compute basic and diluted EPS are reconciled below:
(in millions, except per share data) | 2019 | 2018 | 2017 | |||||||||
Earnings/(loss) | ||||||||||||
Net income/(loss) | $ | ( | ) | $ | ( | ) | $ | ( | ) | |||
Shares | ||||||||||||
Weighted average common shares outstanding (basic shares) | ||||||||||||
Adjustment for assumed dilution: | ||||||||||||
Stock options and restricted stock awards | ||||||||||||
Weighted average shares assuming dilution (diluted shares) | ||||||||||||
EPS | ||||||||||||
Basic | $ | ( | ) | $ | ( | ) | $ | ( | ) | |||
Diluted | $ | ( | ) | $ | ( | ) | $ | ( | ) | |||
The following average potential shares of common stock were excluded from the diluted EPS calculation because their effect would have been anti-dilutive:
(Shares in millions) | 2019 | 2018 | 2017 | ||||||
Stock options, restricted stock awards | |||||||||
68
6. Revenue
Our contracts with customers primarily consist of sales of merchandise and services at the point of sale, sales of gift cards to a customer for a future purchase, customer loyalty rewards that provide discount rewards to customers based on purchase activity, and certain licensing and profit sharing arrangements involving the use of our intellectual property by others. Revenue includes Total net sales and Credit income and other. Net sales are categorized by merchandise and service sale groupings as we believe it best depicts the nature, amount, timing and uncertainty of revenue and cash flow.
Based on how we categorized our merchandise divisions in 2019, the components of Net sales for 2019 and 2018 were as follows:
($ in millions) | 2019 | 2018 | |||||||||||
Men’s apparel and accessories | $ | % | $ | % | |||||||||
Women’s apparel | % | % | |||||||||||
Women’s accessories, including Sephora | % | % | |||||||||||
Home | % | % | |||||||||||
Footwear and handbags | % | % | |||||||||||
Kids’, including toys | % | % | |||||||||||
Jewelry | % | % | |||||||||||
Services and other | % | % | |||||||||||
Total net sales | $ | % | $ | % | |||||||||
Credit income and other encompasses the revenue earned from the agreement with Synchrony associated with our private label credit card and co-branded MasterCard® programs.
The Company has contract liabilities associated with the sales of gift cards and our customer loyalty program.
The liabilities are included in Other accounts payable and accrued expenses in the Consolidated Balance Sheets and were as follows:
(in millions) | 2019 | 2018 | |||||
Gift cards | $ | $ | |||||
Loyalty rewards | |||||||
Total contract liability | $ | $ | |||||
Contract liability includes consideration received for gift card and loyalty related performance obligations which have not been satisfied as of a given date.
A rollforward of the amounts included in contract liability for 2019 and 2018 are as follows:
(in millions) | 2019 | 2018 | |||||
Beginning balance | $ | $ | |||||
Current period gift cards sold and loyalty reward points earned | |||||||
Net sales from amounts included in contract liability opening balances | ( | ) | ( | ) | |||
Net sales from current period usage | ( | ) | ( | ) | |||
Ending balance | $ | $ | |||||
69
7. Other Assets
($ in millions) | 2019 | 2018 | |||||
Capitalized software, net | $ | $ | |||||
Indefinite-lived intangible assets, net (1) | |||||||
Revolving credit facility unamortized costs, net | |||||||
Interest rate swaps (Notes 9, 10 and 11) | |||||||
Other | |||||||
Total | $ | $ | |||||
(1) Amounts are net of an accumulated impairment loss of $9 million.
Our indefinite-lived intangible assets primarily consist of our worldwide rights for the Liz Claiborne® family of trademarks and related intellectual property. In connection with our annual indefinite-lived intangible assets impairment tests performed during the fourth quarter of 2019, we did not record an impairment for our indefinite-lived intangible assets as the estimated fair values exceeded the carrying values of the underlying assets.
8. Other Accounts Payable and Accrued Expenses
($ in millions) | 2019 | 2018 | ||||||
Accrued salaries, vacation and bonus | $ | $ | ||||||
Customer gift cards | ||||||||
Taxes other than income taxes | ||||||||
Loyalty rewards | ||||||||
Interest | ||||||||
Advertising | ||||||||
Current portion of workers’ compensation and general liability self-insurance | ||||||||
Restructuring and management transition (Note 18) | ||||||||
Current portion of retirement plan liabilities (Note 17) | ||||||||
Capital expenditures | ||||||||
Occupancy and rent-related | ||||||||
Other | ||||||||
Total | $ | $ | ||||||
9. Other Liabilities
($ in millions) | 2019 | 2018 | ||||||
Supplemental pension and other postretirement benefit plan liabilities (Note 17) | $ | $ | ||||||
Long-term portion of workers’ compensation and general liability insurance | ||||||||
Deferred developer/tenant allowances | ||||||||
Deferred rent liability (Note 3) | ||||||||
Interest rate swaps (Notes 7, 10 and 11) | ||||||||
Restructuring and management transition (Note 18) | ||||||||
Other | ||||||||
Total | $ | $ | ||||||
70
10. Derivative Financial Instruments
We use derivative financial instruments for hedging and non-trading purposes to manage our exposure to changes in interest rates. Use of derivative financial instruments in hedging programs subjects us to certain risks, such as market and credit risks. Market risk represents the possibility that the value of the derivative instrument will change. In a hedging relationship, the change in the value of the derivative is offset to a great extent by the change in the value of the underlying hedged item. Credit risk related to derivatives represents the possibility that the counterparty will not fulfill the terms of the contract. The notional, or contractual amount of our derivative financial instruments is used to measure interest to be paid or received and does not represent our exposure due to credit risk. Credit risk is monitored through established approval procedures, including setting concentration limits by counterparty, reviewing credit ratings and requiring collateral (generally cash) from the counterparty when appropriate.
When we use derivative financial instruments for the purpose of hedging our exposure to interest rates, the contract terms of a hedged instrument closely mirror those of the hedged item, providing a high degree of risk reduction and correlation. Contracts that are effective at meeting the risk reduction and correlation criteria are recorded using hedge accounting. If a derivative instrument is a hedge, depending on the nature of the hedge, changes in the fair value of the instrument will either be offset against the change in fair value of the hedged assets, liabilities or firm commitments through earnings or be recognized in Accumulated other comprehensive income/(loss) until the hedged item is recognized in earnings. The ineffective portion of an instrument’s change in fair value will be immediately recognized in earnings during the period. Instruments that do not meet the criteria for hedge accounting, or contracts for which we have not elected hedge accounting, are valued at fair value with unrealized gains or losses reported in earnings during the period of change.
Effective May 7, 2015, we entered into interest rate swap agreements with notional amounts totaling $1,250 million to fix a portion of our variable LIBOR-based interest payments. The interest rate swap agreements have a weighted-average fixed rate of 2.04 %, mature on May 7, 2020 and have been designated as cash flow hedges. On September 4, 2018, we entered into additional interest rate swap agreements with notional amounts totaling $750 million to fix a portion of our variable LIBOR-based interest payments. The interest rate swap agreements have a weighted-average fixed rate of 3.135 %, have an effective date from May 7, 2020 to May 7, 2025 and have been designated as cash flow hedges.
The fair value of our interest rate swaps are recorded in the Consolidated Balance Sheets as an asset or a liability (see Note 11). The effective portion of the interest rate swaps' changes in fair values is reported in Accumulated other comprehensive income/(loss) (see Note 14), and the ineffective portion is reported in Net income/(loss). Amounts in Accumulated other comprehensive income/(loss) are reclassified into Net income/(loss) when the related interest payments affect earnings. For the periods presented, all of the interest rate swaps were 100 % effective.
Information regarding the pre-tax changes in the fair value of our interest rate swaps is as follows:
($ in millions) | 2019 | 2018 | Line Item in the Financial Statements | ||||||
Gain/(loss) recognized in other comprehensive income/(loss) | $ | ( | ) | $ | ( | ) | Accumulated other comprehensive income | ||
Gain/(loss) recognized in net income/(loss) | Interest expense | ||||||||
71
Information regarding the gross amounts of our derivative instruments in the Consolidated Balance Sheets is as follows:
Asset Derivatives at Fair Value | Liability Derivatives at Fair Value | ||||||||||||||||||
($ in millions) | Balance Sheet Location | 2019 | 2018 | Balance Sheet Location | 2019 | 2018 | |||||||||||||
Derivatives designated as hedging instruments: | |||||||||||||||||||
Interest rate swaps | Other assets | Other liabilities | |||||||||||||||||
Total derivatives designated as hedging instruments | $ | $ | $ | $ | |||||||||||||||
11. Fair Value Disclosures
In determining fair value, the accounting standards establish a three level hierarchy for inputs used in measuring fair value, as follows:
• | Level 1 — Quoted prices in active markets for identical assets or liabilities. |
• | Level 2 — Significant observable inputs other than quoted prices in active markets for similar assets and liabilities, such as quoted prices for identical or similar assets or liabilities in markets that are not active; or other inputs that are observable or can be corroborated by observable market data. |
• | Level 3 — Significant unobservable inputs reflecting our own assumptions, consistent with reasonably available assumptions made by other market participants. |
Cash Flow Hedges Measured on a Recurring Basis
The fair value of our cash flow hedges are valued in the market using discounted cash flow techniques which use quoted market interest rates in discounted cash flow calculations which consider the instrument's term, notional amount, discount rate and credit risk. Significant inputs to the derivative valuation for interest rate swaps are observable in the active markets and are classified as Level 2 in the fair value measurement hierarchy.
Other Non-Financial Assets Measured on a non-Recurring Basis
In connection with the Company announcing its plan to close underperforming stores in 2019, long-lived assets held and used
with a carrying value of $22 million were written down to their fair value of $8 million, resulting in asset impairment charges
of $14 million in the first quarter of 2019. Additionally, in connection with the adoption of the new lease accounting standard,
right-of-use assets of $58 million were written down to their fair value of $19 million. The fair value was determined based on
comparable market values of similar properties or on a rental income approach and the significant inputs related to valuing the
store related assets are classified as Level 2 in the fair value measurement hierarchy.
In connection with the Company's decision to close underperforming stores in 2020, long-lived assets held and used
with a carrying value of $6 million were written down to their fair value of $1 million, resulting in asset impairment charges
of $5 million in the second half of 2019.
In connection with the Company's decision to sell its three airplanes in 2018, long-lived assets held and used with a carrying value of $72 million were written down to their fair value of $20 million, resulting in asset impairment charges of $52 million. The fair value was determined based on dealer quotes using a market approach and the significant inputs related to valuing the airplanes are classified as Level 2 in the fair value measurement hierarchy.
72
Other Financial Instruments
Carrying values and fair values of financial instruments that are not carried at fair value in the Consolidated Balance Sheets are as follows:
As of February 1, 2020 | As of February 2, 2019 | |||||||||||||||
($ in millions) | Carrying Amount | Fair Value | Carrying Amount | Fair Value | ||||||||||||
Total debt, excluding unamortized debt issuance costs, finance leases, financing obligation and notes payable | $ | $ | $ | $ | ||||||||||||
The fair value of long-term debt is estimated by obtaining quotes from brokers or is based on current rates offered for similar debt. As of February 1, 2020 and February 2, 2019, the fair values of cash and cash equivalents, accounts payable and short-term borrowings approximate their carrying values due to the short-term nature of these instruments.
Concentrations of Credit Risk
We have no significant concentrations of credit risk.
12. Credit Facility
The Company has a $2,350 million senior secured asset-based credit facility (2017 Credit Facility), comprised of a $2,350 million revolving line of credit (Revolving Facility). During the second quarter of 2017, we amended the Revolving Facility to, among other things, extend the maturity date to June 20, 2022 and to lower the interest rate spread by 75 basis points. All borrowings under the 2017 Credit Facility accrue interest at a rate equal to, at the Company's option, a base rate or an adjusted LIBOR rate plus a spread.
The 2017 Credit Facility is secured by a perfected first-priority security interest in substantially all of our eligible credit card receivables, accounts receivable and inventory. The Revolving Facility is available for general corporate purposes, including the issuance of letters of credit. Pricing under the Revolving Facility is tiered based on our utilization under the line of credit. JCP’s obligations under the 2017 Credit Facility are guaranteed by J. C. Penney Company, Inc.
The borrowing base under the Revolving Facility is limited to a maximum of 85% of eligible accounts receivable, plus 90% of eligible credit card receivables, plus 90% of the liquidation value of our inventory, net of certain reserves. Letters of credit reduce the amount available to borrow by their face value. In addition, the maximum availability is limited by a minimum excess availability threshold which is the lesser of 10% of the borrowing base or $200 million, subject to a minimum threshold requirement of $150 million.
As of the end of 2019, we had no borrowings outstanding under the Revolving Facility. In addition, as of the end of 2019, we had $1,594 million available for borrowing, of which $203 million was reserved for outstanding standby letters of credit, none of which have been drawn on, leaving $1,391 million for future borrowings. The applicable rate for standby letters of credit was 1.75 % and 0.875 %, respectively, while the required commitment fee was 0.375 % for the unused portion of the Revolving Facility.
73
13. Long-Term Debt
($ in millions) | 2019 | 2018 | ||||||
Issue: | ||||||||
8.125% Senior Notes Due 2019 | $ | $ | ||||||
5.65% Senior Notes Due 2020 (1) | ||||||||
2016 Term Loan Facility (Matures in 2023) | ||||||||
5.875% Senior Secured Notes Due 2023 (1) | ||||||||
7.125% Debentures Due 2023 | ||||||||
8.625% Senior Secured Second Priority Notes Due 2025 (1) | ||||||||
6.9% Notes Due 2026 | ||||||||
6.375% Senior Notes Due 2036 (1) | ||||||||
7.4% Debentures Due 2037 | ||||||||
7.625% Notes Due 2097 | ||||||||
Total debt | ||||||||
Unamortized debt issuance costs | ( | ) | ( | ) | ||||
Less: current maturities | ( | ) | ( | ) | ||||
Total long-term debt | $ | $ | ||||||
Weighted-average interest rate at year end | % | % | ||||||
Weighted-average maturity (in years) | ||||||||
(1) | These debt issuances contain a change of control provision that would obligate us, at the holders’ option, to repurchase the debt at a price of |
During the first quarter of 2018, JCP issued $400 million aggregate principal amount of senior secured second priority notes with a 8.625% interest rate (Senior Secured Second Priority Notes). The Senior Secured Second Priority Notes are due in 2025 and are guaranteed, jointly and severally, by the Company and certain domestic subsidiaries of JCP that guarantee the Company's 2016 Term Loan Facility (defined below) and existing Senior Secured First Priority Notes (defined below). The net proceeds from the Senior Secured Second Priority Notes were used for the tender consideration for JCP's contemporaneous cash tender offers for $125 million aggregate principal amount of its 8.125% Senior Notes Due 2019 (2019 Notes) and $250 million aggregate principal amount of its 5.65% Senior Notes Due 2020 (collectively, with the 2019 Notes, the Securities). In doing so, we recognized a loss on extinguishment of debt of $23 million which includes the premium paid over the face value of the accepted Securities of $20 million, reacquisition costs of $1 million and the write off of unamortized debt issuance costs of $2 million.
The Company's amended and restated senior secured term loan credit facility (2016 Term Loan Facility) bears interest at a rate of LIBOR (subject to a 1% floor) plus 4.25 % and matures on June 23, 2023. We are required to make quarterly repayments in a principal amount equal to $10.55 million during the seven-year term, subject to certain reductions for mandatory and optional prepayments. Proceeds from the 2016 Term Loan Facility and the $500 million aggregate principal amount of 5.875% Senior Secured Notes due 2023 (Senior Secured First Priority Notes) were used to repay the entire outstanding principal balance of the $2.25 billion five-year senior secured term loan facility entered into in 2013. The 2016 Term Loan Facility and the Senior Secured First Priority Notes are guaranteed by the Company and certain subsidiaries of JCP and are secured by mortgages on certain real estate of JCP and the guarantors.
74
Scheduled Annual Principal Payments on Long-Term Debt, Excluding Capital Leases Financing Obligation and Note Payable
($ in millions) | |||
2020 | $ | ||
2021 | |||
2022 | |||
2023 | |||
2024 | |||
Thereafter | |||
Total | $ | ||
14. Stockholders’ Equity
Accumulated Other Comprehensive Income/(Loss)
The following table shows the changes in accumulated other comprehensive income/(loss) balances for 2019 and 2018:
($ in millions) | Net Actuarial Gain/(Loss) | Prior Service Credit/(Cost) | Foreign Currency Translation | Gain/(Loss) on Cash Flow Hedges | Accumulated Other Comprehensive Income/(Loss) | |||||||||||||||
February 3, 2018 | $ | ( | ) | $ | ( | ) | $ | $ | ( | ) | $ | ( | ) | |||||||
Current period change | ( | ) | ( | ) | ||||||||||||||||
February 2, 2019 | $ | ( | ) | $ | ( | ) | $ | ( | ) | $ | ( | ) | $ | ( | ) | |||||
ASU 2018-02 (Stranded Taxes) adoption (See Note 3) | ||||||||||||||||||||
Current period change | ( | ) | ( | ) | ( | ) | ||||||||||||||
February 1, 2020 | $ | ( | ) | $ | ( | ) | $ | ( | ) | $ | ( | ) | $ | ( | ) | |||||
Common Stock
On a combined basis, our 401(k) savings plan, including our employee stock ownership plan (ESOP), held approximately 16 million shares, or approximately 5.0 % of outstanding Company common stock, at February 1, 2020. Under the 2016 Term Loan Facility, we are subject to restrictive covenants regarding our ability to pay cash dividends.
Preferred Stock
We have authorized 25 million shares of preferred stock; no shares of preferred stock were issued and outstanding as of February 1, 2020 or February 2, 2019.
Stockholders' Rights Agreement
As authorized by our Company’s Board of Directors (the Board), on January 27, 2014, the Company entered into an Amended and Restated Rights Agreement (Amended Rights Agreement) with Computershare Inc., as Rights Agent (Rights Agent), amending, restating and replacing the Rights Agreement, dated as of August 22, 2013 (Original Rights Agreement), between the Company and the Rights Agent. Pursuant to the terms of the Original Rights Agreement, one preferred stock purchase right (a Right) was attached to each outstanding share of Common Stock of $0.50 par value of the Company (Common Stock) held by holders of record as of the close of business on September 3, 2013. The Company has issued one Right in respect of each new share of Common Stock issued since the record date. The Rights, registered on August 23, 2013, trade with and are inseparable from our Common Stock and will not be evidenced by separate certificates unless they become exercisable.
The purpose of the Amended Rights Agreement is to diminish the risk that the Company's ability to use its net operating losses and other tax assets to reduce potential future federal income tax obligations would become subject to limitations by reason of the Company's experiencing an "ownership change" as defined under Section 382 of the Internal Revenue Code of 1986, as amended (the Code). Ownership changes under Section 382 generally relate to the cumulative change in ownership among stockholders with an ownership interest of 5% or more (as determined under Section 382's rules) over a rolling three year period. The Amended Rights Agreement is intended to reduce the likelihood of an ownership change under Section 382 by deterring any person or group from acquiring beneficial ownership of 4.9% or more of the outstanding Common Stock. After various amendments to the Original Rights Agreement, the expiration date of the Rights was extended to January 26, 2020 and certain other provisions were amended including the definition of "beneficial ownership" to include terms appropriate for the
75
purpose of preserving tax benefits. On January 24, 2020, the term of the Amended Rights Agreement was extended to January 25, 2023. The Company expects to submit the extension of the Amended Rights Agreement to stockholders for approval at its 2020 annual meeting of stockholders. If stockholders do not approve the extension of the Amended Rights Agreement, the Amended Rights Agreement will terminate.
15. Stock-Based Compensation
We grant stock-based compensation awards to employees and non-employee directors under our equity compensation plan. On May 24, 2019, our stockholders approved the J. C. Penney Company, Inc. 2019 Long-Term Incentive Plan (2019 Plan), which has a fungible share design in which each stock option will count as one share issued and each stock award will count as 1.49 shares issued, except for stock awards issued from February 2, 2019 to May 24, 2019, the effective date of the 2019 Plan, in which each stock award counted as 1.63 shares issued. The 2019 Plan reserved 17.9 million shares of common stock or 26.7 million options for future grants and will terminate on May 31, 2024. In addition, shares underlying any outstanding stock award or stock option grant canceled prior to vesting or exercise become available for use under the 2019 Plan. Under the terms of the 2019 Plan, all grants made after February 2, 2019 reduce the shares available for grant under the 2019 Plan. As of February 1, 2020, a maximum of 21.2 million options were available for future grant under the 2019 Plan.
Our stock option and restricted stock award grants have averaged about 3.5 % of outstanding stock over the past three years. Authorized shares of the Company's common stock are used to settle the exercise of stock options, granting of restricted shares and vesting of restricted stock units.
Stock-based Compensation Cost
The components of total stock-based compensation costs are as follows:
($ in millions) | 2019 | 2018 | 2017 | |||||||||
Stock awards | $ | $ | $ | |||||||||
Stock options | ||||||||||||
Total stock-based compensation | $ | $ | $ | (1) | ||||||||
Total income tax benefit recognized for stock-based compensation arrangements | $ | $ | $ | |||||||||
(1) | Excludes $ |
Stock Options
Our weighted-average fair value of stock options at grant date was $0.86 in 2019, $0.86 in 2018 and $2.91 in 2017. We used the Black-Scholes option pricing model in 2019 and 2018 and primarily used the binomial lattice valuation model in 2017 to determine the fair value of the stock options granted.
76
Stock Awards
Time-Based Stock Awards | Performance-Based Stock Awards | ||||||||||||
(shares in thousands) | Number of Units | Weighted-Average Grant Date Fair Value | Number of Units | Weighted-Average Grant Date Fair Value | |||||||||
Non-vested at February 2, 2019 | $ | $ | |||||||||||
Granted | |||||||||||||
Vested | ( | ) | |||||||||||
Forfeited/canceled | ( | ) | ( | ) | |||||||||
Non-vested at February 1, 2020 | |||||||||||||
As of February 1, 2020, we had $14 million of unrecognized compensation expense related to unearned employee stock awards, which will be recognized over the remaining weighted-average vesting period of approximately one year. The aggregate market value of shares vested during 2019, 2018 and 2017 was $5 million, $11 million and $17 million, respectively, compared to an aggregate grant date fair value of $13 million, $25 million and $27 million, respectively. Stock awards granted include approximately 1.7 million fully vested RSUs to directors during 2019 with a fair value of $0.90 per RSU award.
In addition to the grants above, on March 5, 2019, we granted approximately 8.0 million phantom units as part of our management incentive compensation plan, which are similar to RSUs in that the number of units granted was based on the price of our stock, but the units will be settled in cash based on the value of our stock on the vesting date, limited to $5.03 per phantom unit. The fair value of the awards is remeasured at each reporting period and was $0.75 per share as of February 1, 2020. Compensation expense, which is variable, is recognized over the vesting period with a corresponding liability, which is recorded in Other accounts payable and accrued expenses and Other liabilities in our Consolidated Balance Sheets. The phantom units have a liability of $4 million as of February 1, 2020. Cash of $1.5 million was paid during 2019 for previously granted phantom units.
16. Leases
We conduct a major part of our operations from leased premises (building or land) that include retail stores, store distribution centers, warehouses, offices and other facilities. Almost all leases include renewal options where we can extend the lease term from one to 50 years or more. We also lease equipment under finance leases for terms of primarily three to five years , and we rent or sublease certain real estate to third parties. Our lease contracts do not contain any purchase options or residual value guarantees.
Leases
($ in millions) | Classification | 2019 | ||||
Assets | ||||||
Operating lease assets | Operating lease assets | $ | ||||
Total lease assets | $ | |||||
Liabilities | ||||||
Current | ||||||
Operating | Current operating lease liabilities | $ | ||||
Finance | Current portion of finance leases and note payable | |||||
Noncurrent | ||||||
Operating | Noncurrent operating lease liabilities | |||||
Finance | Long-term finance leases and note payable | |||||
Total lease liabilities | $ | |||||
77
Lease Cost
($ in millions) | Classification | 2019 | ||||
Operating lease cost | Selling, general and administrative expense (SG&A) | $ | ||||
Variable lease cost | Selling, general and administrative expense (SG&A) | |||||
Finance lease cost | ||||||
Amortization of lease assets | Depreciation and amortization | |||||
Interest on lease liabilities | Net interest expense | |||||
Rental income | Real estate and other, net | |||||
Net lease cost | $ | |||||
As of February 1, 2020, future lease payments were as follows:
($ in millions) | Operating Leases | Finance Leases | Total | ||||||||
2020 | $ | $ | $ | ||||||||
2021 | |||||||||||
2022 | |||||||||||
2023 | |||||||||||
2024 | |||||||||||
Thereafter | |||||||||||
Total lease payments | |||||||||||
Less: amounts representing interest | ( | ) | ( | ) | |||||||
Present value of lease liabilities | $ | $ | $ | ||||||||
Lease term and discount rate are as follows:
2019 | ||
Weighted-average remaining lease term (years) | ||
Operating leases | ||
Weighted-average discount rate | ||
Operating leases | % | |
Other information:
($ in millions) | 2019 | |
Cash paid for amounts included in the measurement of these liabilities | ||
Operating cash flows from operating leases | ||
Operating cash flows from finance leases | ||
Financing cash flows from finance leases | ||
78
As determined prior to the adoption of the new lease standard, the future minimum lease payments under operating leases in effect as of February 2, 2019 were as follows:
($ in millions) | |||
2019 | $ | ||
2020 | |||
2021 | |||
2022 | |||
2023 | |||
Thereafter | |||
Less: sublease income | ( | ) | |
Total minimum lease payments | $ | ||
79
17. Retirement Benefit Plans
We provide retirement pension benefits, postretirement health and welfare benefits, as well as 401(k) savings, profit-sharing and stock ownership plan benefits to various segments of our workforce. Retirement benefits are an important part of our total compensation and benefits program designed to retain and attract qualified, talented employees. Pension benefits are provided through defined benefit pension plans consisting of a non-contributory qualified pension plan (Primary Pension Plan) and, for certain management employees, non-contributory supplemental retirement plans, including a 1997 voluntary early retirement plan. Retirement and other benefits include:
Defined Benefit Pension Plans |
Primary Pension Plan – funded |
Supplemental retirement plans – unfunded |
Other Benefit Plans |
Postretirement benefits – dental |
Defined contribution plans: |
401(k) Safe harbor plan and the 401(k) savings, profit-sharing and stock ownership plan |
Deferred compensation plan |
Defined Benefit Pension Plans
Primary Pension Plan — Funded
The Primary Pension Plan is a funded non-contributory qualified pension plan, initiated in 1966 and closed to new entrants on January 1, 2007. The plan is funded by Company contributions to a trust fund, which are held for the sole benefit of participants and beneficiaries.
Supplemental Retirement Plans — Unfunded
We have unfunded supplemental retirement plans, which provide retirement benefits to certain management employees. We pay ongoing benefits from operating cash flow and cash investments. The plans are a Supplemental Retirement Program and a Benefit Restoration Plan. Participation in the Supplemental Retirement Program is limited to employees who were annual incentive-eligible management employees as of December 31, 1995. Benefits for these plans are based on length of service and final average compensation. The Benefit Restoration Plan is intended to make up benefits that could not be paid by the Primary Pension Plan due to governmental limits on the amount of benefits and the level of pay considered in the calculation of benefits. The Supplemental Retirement Program is a non-qualified plan that was designed to allow eligible management employees to retire at age 60 with retirement income comparable to the age 65 benefit provided under the Primary Pension Plan and Benefit Restoration Plan. In addition, the Supplemental Retirement Program offers participants who leave between ages 60 and 62 benefits equal to the estimated social security benefits payable at age 62 . The Supplemental Retirement Program also continues Company-paid term life insurance at a declining rate until it is phased out at age 70 . Employee-paid term life insurance through age 65 is continued under a separate plan (Supplemental Term Life Insurance Plan for Management Profit-Sharing Employees).
Voluntary Early Retirement Program
In 2017, the Company initiated a Voluntary Early Retirement Program (VERP) for approximately 6,000 eligible associates. Eligibility for the VERP included home office, stores and supply chain personnel who met certain criteria related to age and years of service as of January 31, 2017. The consideration period for eligible associates to accept the VERP ended on March 31, 2017. Based on the approximately 2,800 associates who elected to accept the VERP, we incurred a total charge of $112 million for special retirement benefits. The special retirement benefits increased the projected benefit obligation (PBO) of the Primary Pension Plan and the Supplemental Pension Plans by $88 million and $24 million, respectively. In addition, we incurred curtailment charges of $7 million related to our Primary Pension Plan and Supplemental Pension Plans as a result of the reduction in the expected years of future service related to these plans. We also recognized settlement expense of $13 million in 2017 due to higher lump-sum payment activity to retirees primarily as a result of the VERP executed earlier in the year.
80
Pension Expense/(Income) for Defined Benefit Pension Plans
The components of net periodic benefit expense/(income) for our non-contributory qualified defined benefit pension plan and supplemental pension plans are as follows:
($ in millions) | 2019 | 2018 | 2017 | |||||||||
Service cost | $ | $ | $ | |||||||||
Other components of net periodic pension and postretirement benefit cost/(income): | ||||||||||||
Interest cost | ||||||||||||
Expected return on plan assets | ( | ) | ( | ) | ( | ) | ||||||
Amortization of actuarial loss/(gain) | ( | ) | ||||||||||
Amortization of prior service cost/(credit) | ||||||||||||
Settlement expense | ||||||||||||
Curtailment (gain)/loss recognized | ||||||||||||
Special termination benefit recognized | ||||||||||||
( | ) | ( | ) | |||||||||
Net periodic benefit expense/(income) | $ | ( | ) | $ | ( | ) | $ | |||||
Service cost is included in SG&A in the Consolidated Statements of Operations.
Assumptions
The weighted-average actuarial assumptions used to determine expense were as follows:
2019 | 2018 | 2017 | |||||||
Expected return on plan assets | % | % | % | ||||||
Discount rate | % | % | % | (1) | |||||
Salary increase | % | % | % | ||||||
(1) | As of January 31, 2017. The Primary Pension Plan was remeasured as of March 31, 2017 using a discount rate of 4.34% and as of October 31, 2017 using a discount rate of 3.94%. |
The expected return on plan assets is based on the plan’s long-term asset allocation policy, historical returns for plan assets and overall capital market returns, taking into account current and expected market conditions.
The discount rate used to measure pension expense each year is the rate as of the beginning of the year (i.e., the prior measurement date). The discount rate used, determined by the plan actuary, was based on a hypothetical AA yield curve represented by a series of bonds maturing over the next 30 years, designed to match the corresponding pension benefit cash payments to retirees.
The salary progression rate to measure pension expense was based on age ranges and projected forward.
Funded Status
As of the end of 2019, the funded status of the Primary Pension Plan was 104 %. The Primary Benefit Obligation (PBO) is the present value of benefits earned to date by plan participants, including the effect of assumed future salary increases. Under the Employee Retirement Income Security Act of 1974 (ERISA), the funded status of the plan exceeded 100% as of December 31, 2019 and 2018, the qualified pension plan’s year end.
81
The following table provides a reconciliation of benefit obligations, plan assets and the funded status of the Primary Pension Plan and supplemental pension plans:
Primary Pension Plan | Supplemental Plans | |||||||||||||||
($ in millions) | 2019 | 2018 | 2019 | 2018 | ||||||||||||
Change in PBO | ||||||||||||||||
Beginning balance | $ | $ | $ | $ | ||||||||||||
Service cost | ||||||||||||||||
Interest cost | ||||||||||||||||
Settlements | ( | ) | ( | ) | ||||||||||||
Actuarial loss/(gain) | ( | ) | ( | ) | ||||||||||||
Benefits (paid) | ( | ) | ( | ) | ( | ) | ( | ) | ||||||||
Balance at measurement date | $ | $ | $ | $ | ||||||||||||
Change in fair value of plan assets | ||||||||||||||||
Beginning balance | $ | $ | $ | $ | ||||||||||||
Company contributions | ||||||||||||||||
Actual return on assets (1) | ( | ) | ||||||||||||||
Settlements | ( | ) | ( | ) | ||||||||||||
Benefits (paid) | ( | ) | ( | ) | ( | ) | ( | ) | ||||||||
Balance at measurement date | $ | $ | $ | $ | ||||||||||||
Funded status of the plan | $ | (2) | $ | (2) | $ | ( | ) | (3) | $ | ( | ) | (3) | ||||
(1) | Includes plan administrative expenses. |
(2) | $ |
(3) | $ |
In 2019, the funded status of the Primary Pension Plan decreased by $27 million primarily due to lower interest rates. The actual one-year return on pension plan assets at the measurement date was 20.3 % in 2019, bringing the annualized return since inception of the plan to 9.0 %.
The following pre-tax amounts were recognized in Accumulated other comprehensive income/(loss) in the Consolidated Balance Sheets as of the end of 2019 and 2018:
Primary Pension Plan | Supplemental Plans | ||||||||||||||
($ in millions) | 2019 | 2018 | 2019 | 2018 | |||||||||||
Net actuarial loss/(gain) | $ | $ | $ | $ | |||||||||||
Prior service cost/(credit) | ( | ) | ( | ) | |||||||||||
Total | $ | (1) | $ | $ | $ | ||||||||||
(1) | In 2020, approximately $ |
Assumptions to Determine Obligations
The weighted-average actuarial assumptions used to determine benefit obligations for each of the years below were as follows:
2019 | 2018 | 2017 | |||||||
Discount rate | % | % | % | ||||||
Salary progression rate | % | % | % | ||||||
Accumulated Benefit Obligation (ABO)
The ABO is the present value of benefits earned to date, assuming no future salary growth. The ABO for our Primary Pension Plan was $3.2 billion as of the end of 2019 and $2.9 billion as of the end of 2018. At the end of 2019, plan assets of $3.467
82
billion for the Primary Pension Plan were above the ABO. The ABO for our unfunded supplemental pension plans was $130 million and $141 million as of the end of 2019 and 2018, respectively.
Primary Pension Plan Asset Allocation
The target allocation ranges for each asset class as of the end of 2019 and the fair value of each asset class as a percent of the total fair value of pension plan assets were as follows:
2019 Target | Plan Assets | |||||||
Asset Class | Allocation Ranges | 2019 | 2018 | |||||
Equity | 10% - 25% | % | % | |||||
Fixed income | 60% - 75% | % | % | |||||
Real estate, cash and other investments | 0% - 25% | % | % | |||||
Total | % | % | ||||||
Asset Allocation Strategy
In 2009, we began implementing a liability-driven investment (LDI) strategy to lower the plan’s volatility risk and minimize the impact of interest rate changes on the plan funded status. The implementation of the LDI strategy is phased in over time by reallocating the plan’s assets more towards fixed income investments (i.e., debt securities) that are more closely matched in terms of duration to the plan liability. In 2018, we shifted 5% of the plan's target allocation from equities into fixed income.
The plan’s asset portfolio is actively managed and primarily invested in fixed income balanced with investments in equity securities and other asset classes to maintain an efficient risk/return diversification profile. The risk of loss in the plan’s equity portfolio is mitigated by investing in a broad range of equity securities across different sectors and countries. Investment types, including high-yield debt securities, illiquid assets such as real estate, the use of derivatives and Company securities are set forth in written guidelines established for each investment manager and monitored by the plan’s management team. The plan’s asset allocation policy is designed to meet the plan’s future pension benefit obligations. Under the policy, asset classes are periodically reviewed and rebalanced as necessary, to ensure that the mix continues to be appropriate relative to established targets and ranges.
We have an internal Benefit Plans Investment Committee (BPIC), which consists of senior executives who have established a review process of asset allocation and investment strategies and oversee risk management practices associated with the management of the plan’s assets. Key risk management practices include having an established and broad decision-making framework in place, focused on long-term plan objectives. This framework consists of the BPIC and various third parties, including investment managers, an investment consultant, an actuary and a trustee/custodian. The funded status of the plan is monitored on a continuous basis, including quarterly reviews with updated market and liability information. Actual asset allocations are monitored monthly and rebalancing actions are executed at least quarterly, if needed. To manage the risk associated with an actively managed portfolio, the plan’s management team reviews each manager’s portfolio on a quarterly basis and has written manager guidelines in place, which are adjusted as necessary to ensure appropriate diversification levels. Finally, to minimize operational risk, we utilize a master custodian for all plan assets, and each investment manager reconciles its account with the custodian at least quarterly.
83
Fair Value of Primary Pension Plan Assets
The tables below provide the fair values of the Primary Pension Plan’s assets as of the end of 2019 and 2018, by major class of asset.
Investments at Fair Value at February 1, 2020 | ||||||||||||||||
($ in millions) | Level 1 (1) | Level 2 (1) | Level 3 | Total | ||||||||||||
Assets | ||||||||||||||||
Cash | $ | $ | $ | $ | ||||||||||||
Common collective trusts | ||||||||||||||||
Cash and cash equivalents total | ||||||||||||||||
Common collective trusts – international | ||||||||||||||||
Equity securities – domestic | ||||||||||||||||
Equity securities – international | ||||||||||||||||
Equity securities total | ||||||||||||||||
Common collective trusts | ||||||||||||||||
Corporate bonds | ||||||||||||||||
Swaps | ||||||||||||||||
Government securities | ||||||||||||||||
Mortgage backed securities | ||||||||||||||||
Other fixed income | ||||||||||||||||
Fixed income total | ||||||||||||||||
Public REITs | ||||||||||||||||
Real estate total | ||||||||||||||||
Total investment assets at fair value | $ | $ | $ | $ | ||||||||||||
Liabilities | ||||||||||||||||
Swaps | $ | $ | ( | ) | $ | $ | ( | ) | ||||||||
Other fixed income | ( | ) | ( | ) | ( | ) | ||||||||||
Fixed income total | ( | ) | ( | ) | ( | ) | ||||||||||
Total liabilities at fair value | $ | ( | ) | $ | ( | ) | $ | $ | ( | ) | ||||||
Accounts payable, net | ( | ) | ||||||||||||||
Investments at Net Asset Value (NAV) (2) | ||||||||||||||||
Private equity | $ | |||||||||||||||
Private real estate | ||||||||||||||||
Hedge funds | ||||||||||||||||
Total investments at NAV | $ | |||||||||||||||
Total net assets | $ | |||||||||||||||
(1) | There were no significant transfers in or out of level 1 or 2 investments. |
(2) | Certain investments that are measured at fair value using the net asset value per share (or its equivalent) practical expedient have not been classified in the fair value hierarchy. The fair value amounts presented in this table are intended to permit reconciliation of the fair value hierarchy to the amounts presented in the Consolidated Balance Sheet. |
84
Investments at Fair Value at February 2, 2019 | ||||||||||||||||
($ in millions) | Level 1 (1) | Level 2 (1) | Level 3 | Total | ||||||||||||
Assets | ||||||||||||||||
Cash | $ | $ | $ | $ | ||||||||||||
Common collective trusts | ||||||||||||||||
Cash and cash equivalents total | ||||||||||||||||
Common collective trusts – international | ||||||||||||||||
Equity securities – domestic | ||||||||||||||||
Equity securities – international | ||||||||||||||||
Equity securities total | ||||||||||||||||
Common collective trusts | ||||||||||||||||
Corporate bonds | ||||||||||||||||
Swaps | ||||||||||||||||
Government securities | ||||||||||||||||
Mortgage backed securities | ||||||||||||||||
Other fixed income | ||||||||||||||||
Fixed income total | ||||||||||||||||
Public REITs | ||||||||||||||||
Real estate total | ||||||||||||||||
Total investment assets at fair value | $ | $ | $ | $ | ||||||||||||
Liabilities | ||||||||||||||||
Swaps | $ | $ | ( | ) | $ | $ | ( | ) | ||||||||
Other fixed income | ( | ) | ( | ) | ( | ) | ||||||||||
Fixed income total | ( | ) | ( | ) | ( | ) | ||||||||||
Total liabilities at fair value | $ | ( | ) | $ | ( | ) | $ | $ | ( | ) | ||||||
Accounts payable, net | ( | ) | ||||||||||||||
Investments at Net Asset Value (NAV) (2) | ||||||||||||||||
Private equity | $ | |||||||||||||||
Private real estate | ||||||||||||||||
Hedge funds | ||||||||||||||||
Total investments at NAV | $ | |||||||||||||||
Total net assets | $ | |||||||||||||||
(1) | There were no significant transfers in or out of level 1 or 2 investments. |
(2) | Certain investments that are measured at fair value using the net asset value per share (or its equivalent) practical expedient have not been classified in the fair value hierarchy. The fair value amounts presented in this table are intended to permit reconciliation of the fair value hierarchy to the amounts presented in the Consolidated Balance Sheet. |
Following is a description of the valuation methodologies used for Primary Pension Plan assets measured at fair value.
Cash – Cash is valued at cost which approximates fair value, and is classified as level 1 of the fair value hierarchy.
Common Collective Trusts – Common collective trusts are pools of investments within cash equivalents, equity and fixed income that are benchmarked relative to a comparable index. They are valued on the basis of the relative interest of each participating investor in the fair value of the underlying assets. The investments are valued at net asset value (NAV) as fair value and are classified as level 2 of the fair value hierarchy.
Equity Securities – Equity securities are common stocks and preferred stocks valued based on the price of the security as listed on an open active exchange and classified as level 1 of the fair value hierarchy, as well as warrants and preferred stock that are
85
valued at a price, which is based on a broker quote in an over-the-counter market, and are classified as level 2 of the fair value hierarchy.
Private Equity – Private equity is composed of interests in private equity funds valued on the basis of the relative interest of each participating investor in the fair value of the underlying assets and/or common stock of privately held companies. There are no observable market values for private equity funds. The valuations for the funds are derived using a combination of different methodologies including (1) the market approach, which consists of analyzing market transactions for comparable assets, (2) the income approach using the discounted cash flow model, or (3) cost method. Private equity funds also provide audited financial statements. Private equity investments are valued at NAV as a practical expedient.
Corporate Bonds – Corporate bonds and Corporate loans are valued at a price which is based on observable market information in primary markets or a broker quote in an over-the-counter market, and are classified as level 2 or level 3 of the fair value hierarchy.
Swaps – swap contracts are based on broker quotes in an over-the-counter market and are classified as level 2 of the fair value hierarchy.
Government, Municipal Bonds and Mortgaged Backed Securities – Government and municipal securities are valued at a price based on a broker quote in an over-the-counter market and classified as level 2 of the fair value hierarchy. Mortgage backed securities are valued at a price based on observable market information or a broker quote in an over-the-counter market and classified as level 2 of the fair value hierarchy.
Other Fixed Income – non-mortgage asset backed securities, collateral held in short-term investments for derivative contract and derivatives composed of futures contracts, option contracts and other fixed income derivatives valued at a price based on observable market information or a broker quote in an over-the-counter market and classified as level 2 of the fair value hierarchy.
Real Estate – Real estate is comprised of public and private real estate investments. Real estate investments through registered investment companies that trade on an exchange are classified as level 1 of the fair value hierarchy. Investments through open end private real estate funds, depending on the type of investment, are valued at the reported NAV as fair value or are classified as level 2 of the fair value hierarchy. Private real estate investments through partnership interests that are valued based on different methodologies including discounted cash flow, direct capitalization and market comparable analysis are valued at NAV as a practical expedient.
Hedge Fund – Hedge funds exposure is through fund of funds, which are made up of over 30 different hedge fund managers diversified over different hedge strategies. The fair value of the hedge fund is determined by the fund's administrator using valuation provided by the third party administrator for each of the underlying funds. Hedge fund investments are valued at NAV as a practical expedient.
The following tables set forth a summary of changes in the fair value of the Primary Pension Plan’s level 3 investment assets:
2019 | |||||||
($ in millions) | Corporate Loans | Corporate Bonds | |||||
Balance, beginning of year | $ | $ | |||||
Purchases and issuances | |||||||
Sales, maturities and settlements | |||||||
Balance, end of year | $ | $ | |||||
86
2018 | |||||||
($ in millions) | Corporate Loans | Corporate Bonds | |||||
Balance, beginning of year | $ | $ | |||||
Purchases and issuances | |||||||
Sales, maturities and settlements | ( | ) | ( | ) | |||
Balance, end of year | $ | $ | |||||
Contributions
Our policy with respect to funding the Primary Pension Plan is to fund at least the minimum required by ERISA rules, as amended by the Pension Protection Act of 2006, and not more than the maximum amount deductible for tax purposes. Due to our past funding of the pension plan and overall positive growth in plan assets since plan inception, there will not be any required cash contribution for funding of plan assets in 2020 under ERISA.
Our contributions to the unfunded non-qualified supplemental retirement plans are equal to the amount of benefit payments made to retirees throughout the year and for 2020 are anticipated to be approximately $27 million. Benefits are paid in the form of five equal annual installments to participants and no election as to the form of benefit is provided for in the unfunded plans. The following sets forth our estimated future benefit payments:
($ in millions) | Primary Plan Benefits | Supplemental Plan Benefits | ||||||
2020 | $ | $ | ||||||
2021 | ||||||||
2022 | ||||||||
2023 | ||||||||
2024 | ||||||||
2025-2029 | ||||||||
Other Benefit Plans
Defined Contribution Plans
The Savings, Profit-Sharing and Stock Ownership Plan (Savings Plan) is a qualified defined contribution plan, a 401(k) plan, available to all eligible employees. Effective January 1, 2007, all employees who are age 21 or older are immediately eligible to participate in and contribute a percentage of their pay to the Savings Plan. Eligible employees, who have completed one year and at least 1,000 hours of service within an eligibility period, are offered a fixed matching contribution each pay period equal to 50 % of up to 6 % of pay contributed by the employee. Matching contributions are credited to employees’ accounts in accordance with their investment elections and fully vest after three years. We may make additional discretionary matching contributions.
Effective January 1, 2017, the Company added a Safe Harbor 401(k) Plan that was made available for active employees hired on or after January 1, 2007. The Company matching contributions under the Safe Harbor Plan are equal to 100% of up to 5% of pay contributed by the employee. Matching contributions are credited to employees' accounts in accordance with their investment elections and fully vest immediately. The Safe Harbor Plan replaces the non-contributory retirement account.
In addition to the Savings Plan, we sponsor the Mirror Savings Plan, which is a non-qualified contributory unfunded defined contribution plan offered to certain management employees. This plan supplements retirement savings under the Savings Plan for eligible management employees who choose to participate in it. The plan’s investment options generally mirror the traditional Savings Plan investment options. Similar to the supplemental retirement plans, the Mirror Savings Plan benefits are paid from our operating cash flow and cash investments.
The expense for these plans was included in SG&A expenses in the Consolidated Statements of Operations, was $43 million in 2019, $43 million in 2018 and $46 million in 2017.
87
18. Restructuring and Management Transition
In the first quarter of 2019, the Company finalized plans to close 18 full-line stores and 9 ancillary home and furniture stores, further aligning the Company's brick-and-mortar presence with its omnichannel network, and enabling capital resources to be reallocated to locations and initiatives that offer the greatest long-term value potential. The planned store closures resulted in a $14 million asset impairment charge for store assets with limited future use and a $1 million severance charge for the expected displacement of store associates. During the second half of 2019, impairment charges of $5 million were recorded for the planned closure of 6 stores in 2020.
On March 17, 2017, the Company finalized its plans to close 138 stores to help align the Company's brick-and-mortar presence with its omnichannel network, thereby redirecting capital resources to invest in locations and initiatives that offer the greatest revenue potential. The store closures resulted in a $77 million asset impairment charge for store assets with limited future use and a $14 million severance charge for the expected displacement of store associates. During 2017, $52 million in store related closing and other costs such as certain lease obligations were recorded as a result of each respective store ceasing operations.
The components of Restructuring and management transition include:
• | Home office and stores -- charges for actions to reduce our store and home office expenses including employee termination benefits, store lease termination and impairment charges; |
• | Management transition -- charges related to implementing changes within our management leadership team for both incoming and outgoing members of management; and |
• | Other -- charges related primarily to costs related to the closure of certain supply chain locations. |
The composition of restructuring and management transition charges was as follows:
Cumulative Amount From Program Inception Through | ||||||||||||||||
($ in millions) | 2019 | 2018 | 2017 | 2019 | ||||||||||||
Home office and stores | $ | $ | $ | $ | ||||||||||||
Management transition | ||||||||||||||||
Other | ||||||||||||||||
Total | $ | $ | $ | $ | ||||||||||||
Activity for the restructuring and management transition liability for 2019 and 2018 was as follows:
($ in millions) | Home Office and Stores | Management Transition | Other | Total | ||||||||||||
February 3, 2018 | $ | $ | $ | $ | ||||||||||||
Charges | ||||||||||||||||
Cash payments | ( | ) | ( | ) | ( | ) | ( | ) | ||||||||
February 2, 2019 | ||||||||||||||||
Impact of ASC 842 adoption (Note 3) | ( | ) | ( | ) | ( | ) | ||||||||||
Charges | ||||||||||||||||
Cash payments | ( | ) | ( | ) | ( | ) | ( | ) | ||||||||
February 1, 2020 | $ | $ | $ | $ | ||||||||||||
88
19. Real Estate and Other, Net
Real estate and other primarily includes net gains from the sale of facilities and equipment that are no longer used in operations, asset impairments, accruals for certain litigation and other non-operating charges and credits. Prior to 2019, real estate and other also consisted of ongoing income from our real estate subsidiaries. During the first quarter of 2014, we formed a joint venture to develop property adjacent to our home office facility in Plano, Texas (Home Office Land Joint Venture) in which we contributed approximately 220 acres of property. The joint venture was formed to develop the contributed property and our proportional share of the joint venture's activities is recorded in Real estate and other, net. During the third quarter of 2018, we sold our interest to the other partner and are no longer a member of the joint venture.
The composition of real estate and other, net was as follows:
($ in millions) | 2019 | 2018 | 2017 | |||||||||
Net gain from sale of non-operating assets | $ | ( | ) | $ | $ | |||||||
Investment income from Home Office Land Joint Venture | ( | ) | ( | ) | ||||||||
Net gain from sale of operating assets | ( | ) | ( | ) | ( | ) | ||||||
Impairments | ||||||||||||
Other | ( | ) | ||||||||||
Total expense/(income) | $ | ( | ) | $ | ( | ) | $ | ( | ) | |||
Investment Income from Joint Ventures
In 2018 and 2017, the Company had $4 million and $31 million, respectively, in income related to its proportional share of the net income in the Home Office Land Joint Venture and received aggregate cash distributions of $4 million and $40 million, respectively.
Net Gain from Sale of Operating Assets
In 2018, we completed the sale-leasebacks of our Milwaukee, Wisconsin and Manchester, Connecticut distribution facilities for net sales prices of $30 million and $68 million, respectively and recognized net gains of $12 million and $38 million, respectively.
In 2017, we completed the sale of our Buena Park, California distribution facility for a net sale price of $131 million and recorded a net gain of $111 million.
Impairments
During 2018, we recorded an impairment charge of $52 million related to management's decision to sell three airplanes. Two of the airplanes were sold during the second quarter of 2018 at their fair value of $12 million and the third airplane was sold during the third quarter of 2018 at its fair value of $8 million.
20. Income Taxes
The components of our income tax expense/(benefit) were as follows:
($ in millions) | 2019 | 2018 | 2017 | |||||||||
Current | ||||||||||||
Federal and foreign | $ | $ | ( | ) | $ | ( | ) | |||||
State and local | ||||||||||||
Total current | ( | ) | ( | ) | ||||||||
Deferred | ||||||||||||
Federal and foreign | ( | ) | ( | ) | ( | ) | ||||||
State and local | ( | ) | ( | ) | ||||||||
Total deferred | ( | ) | ( | ) | ( | ) | ||||||
Total income tax expense/(benefit) | $ | $ | ( | ) | $ | ( | ) | |||||
89
The following table summarizes a reconciliation of income tax expense/(benefit) compared with the amounts at the U.S. federal statutory income tax rate:
($ in millions) | 2019 | 2018 | 2017 | |||||||||
Federal income tax at statutory rate | $ | ( | ) | $ | ( | ) | $ | ( | ) | |||
State and local income tax, less federal income tax benefit | ( | ) | ( | ) | ( | ) | ||||||
Increase/(decrease) in valuation allowance | ||||||||||||
Effect of U.S. tax reform | ( | ) | ||||||||||
Other, including permanent differences and credits | ||||||||||||
Total income tax expense/(benefit) | $ | $ | ( | ) | $ | ( | ) | |||||
Our deferred tax assets and liabilities were as follows:
($ in millions) | 2019 | 2018 | ||||||
Assets | ||||||||
Merchandise inventory | $ | $ | ||||||
Accrued vacation pay | ||||||||
Gift cards | ||||||||
Stock-based compensation | ||||||||
State taxes | ||||||||
Workers’ compensation/general liability | ||||||||
Accrued rent | ||||||||
Litigation exposure | ||||||||
Interest expense limitation | ||||||||
Mirror savings plan | ||||||||
Pension and other retiree obligations | ||||||||
Operating lease liabilities | ||||||||
Net operating loss and tax credit carryforwards | ||||||||
Other | ||||||||
Total deferred tax assets | ||||||||
Valuation allowance | ( | ) | ( | ) | ||||
Total net deferred tax assets | ||||||||
Liabilities | ||||||||
Depreciation and amortization | ( | ) | ( | ) | ||||
Tax benefit transfers | ( | ) | ( | ) | ||||
Long-lived intangible assets | ( | ) | ( | ) | ||||
Operating lease assets | ( | ) | ||||||
Total deferred tax liabilities | ( | ) | ( | ) | ||||
Total net deferred tax liabilities | $ | ( | ) | $ | ( | ) | ||
As of February 1, 2020 , a valuation allowance of $869 million has been recorded against our deferred tax assets. In assessing the need for the valuation allowance, we considered both positive and negative evidence related to the likelihood of realization of the deferred tax assets. As a result of our assessment, we concluded that, beginning in the second quarter of 2013, our estimate of the realization of deferred tax assets would be based solely on the future reversals of existing taxable temporary differences and tax planning strategies that we would make use of to accelerate taxable income to utilize expiring net operating loss (NOL) and tax credit carryforwards.
90
We are required to allocate a portion of our tax provision between operating losses and Accumulated other comprehensive income/(loss). In 2019, the Company did not benefit any of its operating loss and incurred an actuarial loss in Other comprehensive income/(loss), the tax benefit on which was fully offset by a valuation allowance within Other comprehensive income/(loss). Accordingly, there is a valuation allowance offsetting the tax benefit attributable to other comprehensive income included in the total valuation allowance of $869 million noted above.
The Company has federal net operating loss (NOL) carryforwards of $2.1 billion and $76 million of federal tax credit carryforwards as of February 1, 2020 that expire in 2032 through 2034. These NOL carryforwards arose prior to December 31, 2017 and are available to offset future taxable income. The Company may recognize additional NOLs in the future which, under the Tax Act, would not expire but would only be available to offset up to 80% of the Company’s future taxable income.
The Company has $341 million of federal unused interest deductions that do not expire but can be used in the future only to the extent the Company has interest limitation (explained below) in excess of its interest expense. Additionally, the Company has state NOLs that are subject to various limitations and expiration dates beginning in 2020 through 2040 and are offset fully by valuation allowances.
The NOL and credit carryforwards have a potential to be used to offset future taxable income and reduce future cash tax liabilities by approximately $710 million. The Company’s ability to utilize these carryforwards will depend upon the availability of future taxable income during the carryforward period and, as such, there is no assurance the Company will be able to realize such tax savings.
Interest Limitation: The Tax Act limits the Company’s interest deduction to 30% of tax earnings before interest, tax, depreciation and amortization beginning in 2018 through 2021. Thereafter, the interest deduction is limited to 30% of tax earnings before interest and taxes. Any disallowed interest in a year becomes a separate deferred tax asset with an indefinite carryforward period that can be utilized by the Company in a future tax year by an amount equal to its interest limitation in excess of its interest expense for that year. In 2019, the Company had net interest expense of $119 million disallowed which became a $35 million deferred tax asset on which a full valuation allowance was recorded.
The Company’s ability to utilize NOL and credit carryforwards and unused interest deductions could be further limited if it were to experience an “ownership change,” as defined in Section 382 of the Code and similar state provisions. An ownership change can occur whenever there is a cumulative shift in the ownership of a company by more than 50 percentage points by one or more “5% stockholders” within a three-year period. The occurrence of such a change generally limits the amount of carryforwards a company could utilize in a given year to the aggregate fair market value of the company’s common stock immediately prior to the ownership change, multiplied by the long-term tax-exempt interest rate in effect for the month of the ownership change.
As discussed in Note 14, on January 27, 2014, the Board adopted the Amended Rights Agreement to help prevent acquisitions of the Company’s common stock that could result in an ownership change under Section 382 which helps preserve the Company’s ability to use its NOL and tax credit carryforwards. The Amended Rights Agreement was ratified by the shareholder vote on May 16, 2014. On May 19, 2017, stockholders approved the extension of the term of the agreement to January 26, 2020. On January 24, 2020, the term of the Amended Rights Agreement was extended to January 25, 2023. The Company expects to submit the extension of the Amended Rights Agreement to stockholders for approval at its 2020 annual meeting of stockholders. If stockholders do not approve the extension of the Amended Rights Agreement, the Amended Rights Agreement will terminate.
The Amended Rights Agreement is designed to prevent acquisitions of the Company’s common stock that would result in a stockholder owning 4.9 % or more of the Company’s common stock (as calculated under Section 382), or any existing holder of 4.9 % or more of the Company’s common stock acquiring additional shares, by substantially diluting the ownership interest of any such stockholder unless the stockholder obtains an exemption from the Board.
91
A reconciliation of unrecognized tax benefits is as follows:
($ in millions) | 2019 | 2018 | 2017 | |||||||||
Beginning balance | $ | $ | $ | |||||||||
Additions for tax positions of prior years | ||||||||||||
Reductions for tax positions of prior years | ( | ) | ( | ) | ||||||||
Settlements and effective settlements with tax authorities | ( | ) | ( | ) | ( | ) | ||||||
Balance at end of year | $ | $ | $ | |||||||||
Unrecognized tax benefits included in our Consolidated Balance Sheets were as follows:
($ in millions) | 2019 | 2018 | ||||||
Deferred taxes (noncurrent liability) | $ | $ | ||||||
Accounts payable and accrued expenses (Note 8) | ||||||||
Other liabilities (Note 9) | ||||||||
Total | $ | $ | ||||||
As of the end of 2019, 2018 and 2017, the unrecognized tax benefits balance included $33 million, that, if recognized, would be a benefit in the income tax provision after giving consideration to the offsetting effect of $7 million, $7 million and $7 million, respectively, related to the federal tax deduction of state taxes. The remaining amounts reflect tax positions for which the ultimate deductibility is highly certain, but for which there is uncertainty about the timing. Accrued interest and penalties related to unrecognized tax benefits included in income tax expense as of the end of 2019, 2018 and 2017 were $2 million, $1 million and $1 million, respectively.
We file income tax returns in U.S. federal and state jurisdictions and certain foreign jurisdictions. Our U.S. federal returns have been examined through 2016. We are audited by the taxing authorities of many states and certain foreign countries and are subject to examination by these taxing jurisdictions for years generally after 2008. The tax authorities may have the right to examine prior periods where federal and state NOL and tax credit carryforwards were generated, and make adjustments up to the amount of the NOL and credit carryforward amounts.
21. Supplemental Cash Flow Information
($ in millions) | 2019 | 2018 | 2017 | |||||||||
Supplemental cash flow information | ||||||||||||
Income taxes received/(paid), net | $ | ( | ) | $ | ( | ) | $ | ( | ) | |||
Interest received/(paid), net | ( | ) | ( | ) | ( | ) | ||||||
Supplemental non-cash investing and financing activity | ||||||||||||
Increase/(decrease) in other accounts payable related to purchases of property and equipment and software | ( | ) | ( | ) | ||||||||
Purchase of property and equipment and software through a financing obligation | ( | ) | ||||||||||
Remeasurement of leased assets and lease obligations | ||||||||||||
22. Litigation and Other Contingencies
Litigation
Shareholder Derivative Litigation and Demand
On October 19, 2018, a shareholder of the Company, Juan Rojas, filed a shareholder derivative action against certain present and former members of the Company’s Board of Directors in the Delaware Court of Chancery. The Company was named as a nominal defendant. The lawsuit asserted claims for breaches of fiduciary duties based on alleged failures to prevent the Company from engaging in allegedly unlawful promotional pricing practices. On July 29, 2019, the Court granted defendants' motion to dismiss and dismissed plaintiff’s complaint with prejudice. On October 21, 2019, the Company’s Board of Directors received a demand from Rojas to conduct an investigation of alleged breaches of fiduciary duties similar to those made in the
92
dismissed derivative action regarding alleged failures to prevent the Company from engaging in allegedly unlawful promotional pricing practices. The Board of Directors has appointed a committee of independent directors to review the demand and make a recommendation to the Board of Directors regarding a response to the demand. While no assurance can be given as to the ultimate outcome of this matter, we believe that the final resolution of this action will not have a material adverse effect on our results of operations, financial position, liquidity or capital resources.
Other Legal Proceedings
We are subject to various other legal and governmental proceedings involving routine litigation incidental to our business. Accruals have been established based on our best estimates of our potential liability in certain of these matters, which we believe aggregate to an amount that is not material to the Consolidated Financial Statements. These estimates were developed in consultation with in-house and outside counsel. While no assurance can be given as to the ultimate outcome of these matters, we currently believe that the final resolution of these actions, individually or in the aggregate, will not have a material adverse effect on our results of operations, financial position, liquidity or capital resources.
Contingencies
As of February 1, 2020, we have an estimated accrual of $19 million related to potential environmental liabilities that is recorded in Other liabilities in the Consolidated Balance Sheet. This estimate covered potential liabilities primarily related to underground storage tanks and remediation of environmental conditions involving our former drugstore locations. We continue to assess required remediation and the adequacy of environmental reserves as new information becomes available and known conditions are further delineated. If we were to incur losses at the estimated amount, we do not believe that such losses would have a material effect on our results of operations, financial position, liquidity or capital resources.
23. Subsequent Event
During March 2020, a global pandemic was declared by the World Health Organization related to the rapidly growing outbreak of a novel strain of coronavirus (COVID-19). The pandemic has significantly impacted the economic conditions in the U.S., accelerating during the first half of March, as federal, state and local governments react to the public health crisis, creating significant uncertainties in the U.S. economy. The Company has announced that all stores will close through April 1, 2020. As a result of these developments, the Company expects a material adverse impact on its sales, results of operations and cash flows. This situation is rapidly changing and additional impacts to the business may arise that we are not aware of currently. While the disruption is currently expected to be temporary, there is uncertainty around the duration. The ultimate impact of the pandemic on the Company’s results of operations, financial position, liquidity or capital resources cannot be reasonably estimated at this time.
On March 16 and March 19, 2020, the Company borrowed $800 million and $450 million, respectively, from the Revolving Facility (see Note 12) as a precautionary measure to increase its cash position and preserve financial flexibility considering uncertainty in the U.S. and global markets resulting from COVID-19. Borrowings under the Revolving Facility will bear interest, at the Company’s option, at a base rate or LIBOR, plus an applicable interest rate margin varying depending on the Company’s utilization of the Revolving Facility. The current rates on the borrowings will range from 2.75% to 4.0%. The proceeds from the Revolving Facility draw may be used for working capital needs or general corporate purposes.
93
24. Quarterly Results of Operations (Unaudited)
The following is a summary of our quarterly unaudited consolidated results of operations for 2019 and 2018:
2019 | |||||||||||||||
($ in millions, except EPS) | First Quarter | Second Quarter | Third Quarter | Fourth Quarter | |||||||||||
Total net sales | $ | $ | $ | $ | |||||||||||
Credit income and other | |||||||||||||||
Total revenues | |||||||||||||||
Cost of goods sold (exclusive of depreciation and amortization) | |||||||||||||||
SG&A expenses | |||||||||||||||
Restructuring and management transition (1) | |||||||||||||||
Net income/(loss) | ( | ) | ( | ) | ( | ) | |||||||||
Diluted earnings/(loss) per share (2) | $ | ( | ) | $ | ( | ) | $ | ( | ) | $ | |||||
2018 | |||||||||||||||
($ in millions, except EPS) | First Quarter | Second Quarter | Third Quarter | Fourth Quarter | |||||||||||
Total net sales | $ | $ | $ | $ | |||||||||||
Credit income and other | |||||||||||||||
Total revenues | |||||||||||||||
Cost of goods sold (exclusive of depreciation and amortization) | |||||||||||||||
SG&A expenses | |||||||||||||||
Restructuring and management transition (3) | |||||||||||||||
Net income/(loss) | ( | ) | ( | ) | ( | ) | |||||||||
Diluted earnings/(loss) per share (2) | $ | ( | ) | $ | ( | ) | $ | ( | ) | $ | |||||
(1) | Restructuring and management transition charges (Note 18) by quarter for 2019 consisted of the following: |
($ in million) | First Quarter | Second Quarter | Third Quarter | Fourth Quarter | |||||||||||
Home office and stores | $ | $ | $ | $ | |||||||||||
Management transition | |||||||||||||||
Total | $ | $ | $ | $ | |||||||||||
(2) |
(3) | Restructuring and management transition charges (Note 18) by quarter for 2018 consisted of the following: |
($ in millions) | First Quarter | Second Quarter | Third Quarter | Fourth Quarter | |||||||||||
Home office and stores | $ | $ | $ | $ | |||||||||||
Management transition | |||||||||||||||
Total | $ | $ | $ | $ | |||||||||||
94