Exhibit 10.1
Investor Presentation September 2025 Nasdaq: SUNE Powering the Energy Transition Since 2003
Forward Looking Statements 2 / Powering the Energy Transition Past performance is not indicative of future results. There is no guarantee that any specific objective will be achieved. Investments may be illiquid, highly speculative and there is risk of the total loss of your investment. Our prospects here at SUNation Energy Inc . are subject to uncertainties and risks . This presentation contains forward - looking statements within the meaning of the Private Securities Litigation Reform Act of 1995 , Section 27 A of the Securities Act of 1933 , as amended, and Section 21 E of the Securities Exchange Act of 1934 , as amended . The Company intends that such forward - looking statements be subject to the safe harbor provided by the foregoing Sections . You should not place undue reliance on forward looking statements as they are based upon our current expectations, forecasts and assumptions . These forward - looking statements are based largely on the expectations or forecasts of future events, can be affected by inaccurate assumptions, and are subject to various business risks and known and unknown uncertainties, a number of which are beyond the control of management . Therefore, actual results could differ materially from the forward - looking statements contained in this presentation . Any statements contained in this presentation that are not statements of historical fact may be deemed to be forward looking statements . The Company cannot predict or determine after the fact what factors would cause actual results to differ materially from those indicated by the forward - looking statements or other statements, including the negative effects, if any, resulting from the loss of residential tax credits and other substantial changes that may result following the enactment of the One Big Beautiful Bill Act of July 2025 . The reader should consider statements that include the words "believes", "expects", "anticipates", "intends", "estimates", "plans", "projects", "should", or other expressions that are predictions of or indicate future events or trends, to be uncertain and forward - looking . We caution readers not to place undue reliance upon any such forward - looking statements . The Company does not undertake to publicly update or revise forward - looking statements, whether because of new information, future events or otherwise . Additional information respecting factors that could materially affect the Company and its operations are contained in the Company's filings with the SEC which can be found on the SEC's website at www . sec . gov . The information contained in this presentation is for informational purposes only . It is not intended to form the basis of any investment decision and it does not constitute an offer or solicitation to sell shares or securities in the Company or any related or associated entity . Information in this presentation, including, but not limited to, financial guidance, is not complete and should be carefully read in conjunction with the Company’s most recent Form 10 - Q for the period ended March 31 , 2025 , including the subsequent events and risk factors updated therein, as well as the Company’s other reports that have been filed with the SEC . Non - GAAP Financial Measures This presentation includes non - GAAP financial measures that differ from financial measures calculated in accordance with United States generally accepted accounting principles (“GAAP”) . Adjusted EBITDA is a non - GAAP financial measure provided in this presentation, and is net (loss) income calculated in accordance with GAAP, adjusted for interest, income taxes, depreciation, amortization, stock compensation, gain on sale of assets, financing fees, loss on debt remeasurement, and non - cash fair value remeasurement adjustments as detailed in the reconciliations presented in this presentation . These non - GAAP financial measures are presented because the Company believes they are useful indicators of its operating performance . Management uses these measures principally as measures of the Company’s operating performance and for planning purposes, including the preparation of the Company’s annual operating plan and financial projections . The Company believes these measures are useful to investors as supplemental information and because they are frequently used by analysts, investors, and other interested parties to evaluate companies in its industry . The Company also believes these non - GAAP financial measures are useful to its management and investors as a measure of comparative operating performance from period to period . These non - GAAP financial measures should not be considered as an alternative to, or superior to, their respective GAAP financial measures, as measures o f financial performance or cash flows from operations as a measure o f liquidity, or any other performance measure derived in accordance with GAAP, and they should not be construed to imply that the Company’s future results will be unaffected b y unusual or non - recurring items . In addition, these measures do not reflect certain cash requirements such as tax payments, debt service requirements, capital expenditures and certain other cash costs that may recur in the future . Adjusted EBITDA contains certain other limitations, including the failure to reflect our cash expenditures, cash requirements for working capital needs and cash costs to replace assets being depreciated and amortized . In evaluating non - GAAP financial measures, you should be aware that in the future the Company may incur expenses that are the same as or similar to some of the adjustments in this presentation . The Company’s presentation of non - GAAP financial measures should not be construed to imply that its future results will be unaffected b y any such adjustments . Management compensates for these limitations by primarily relying on the Company’s GAAP results in addition to using non - GAAP financial measures on a supplemental basis . The Company’s definition of these non - GAAP financial measures is not necessarily comparable to other similarly titled captions of other companies due to different methods of calculation .
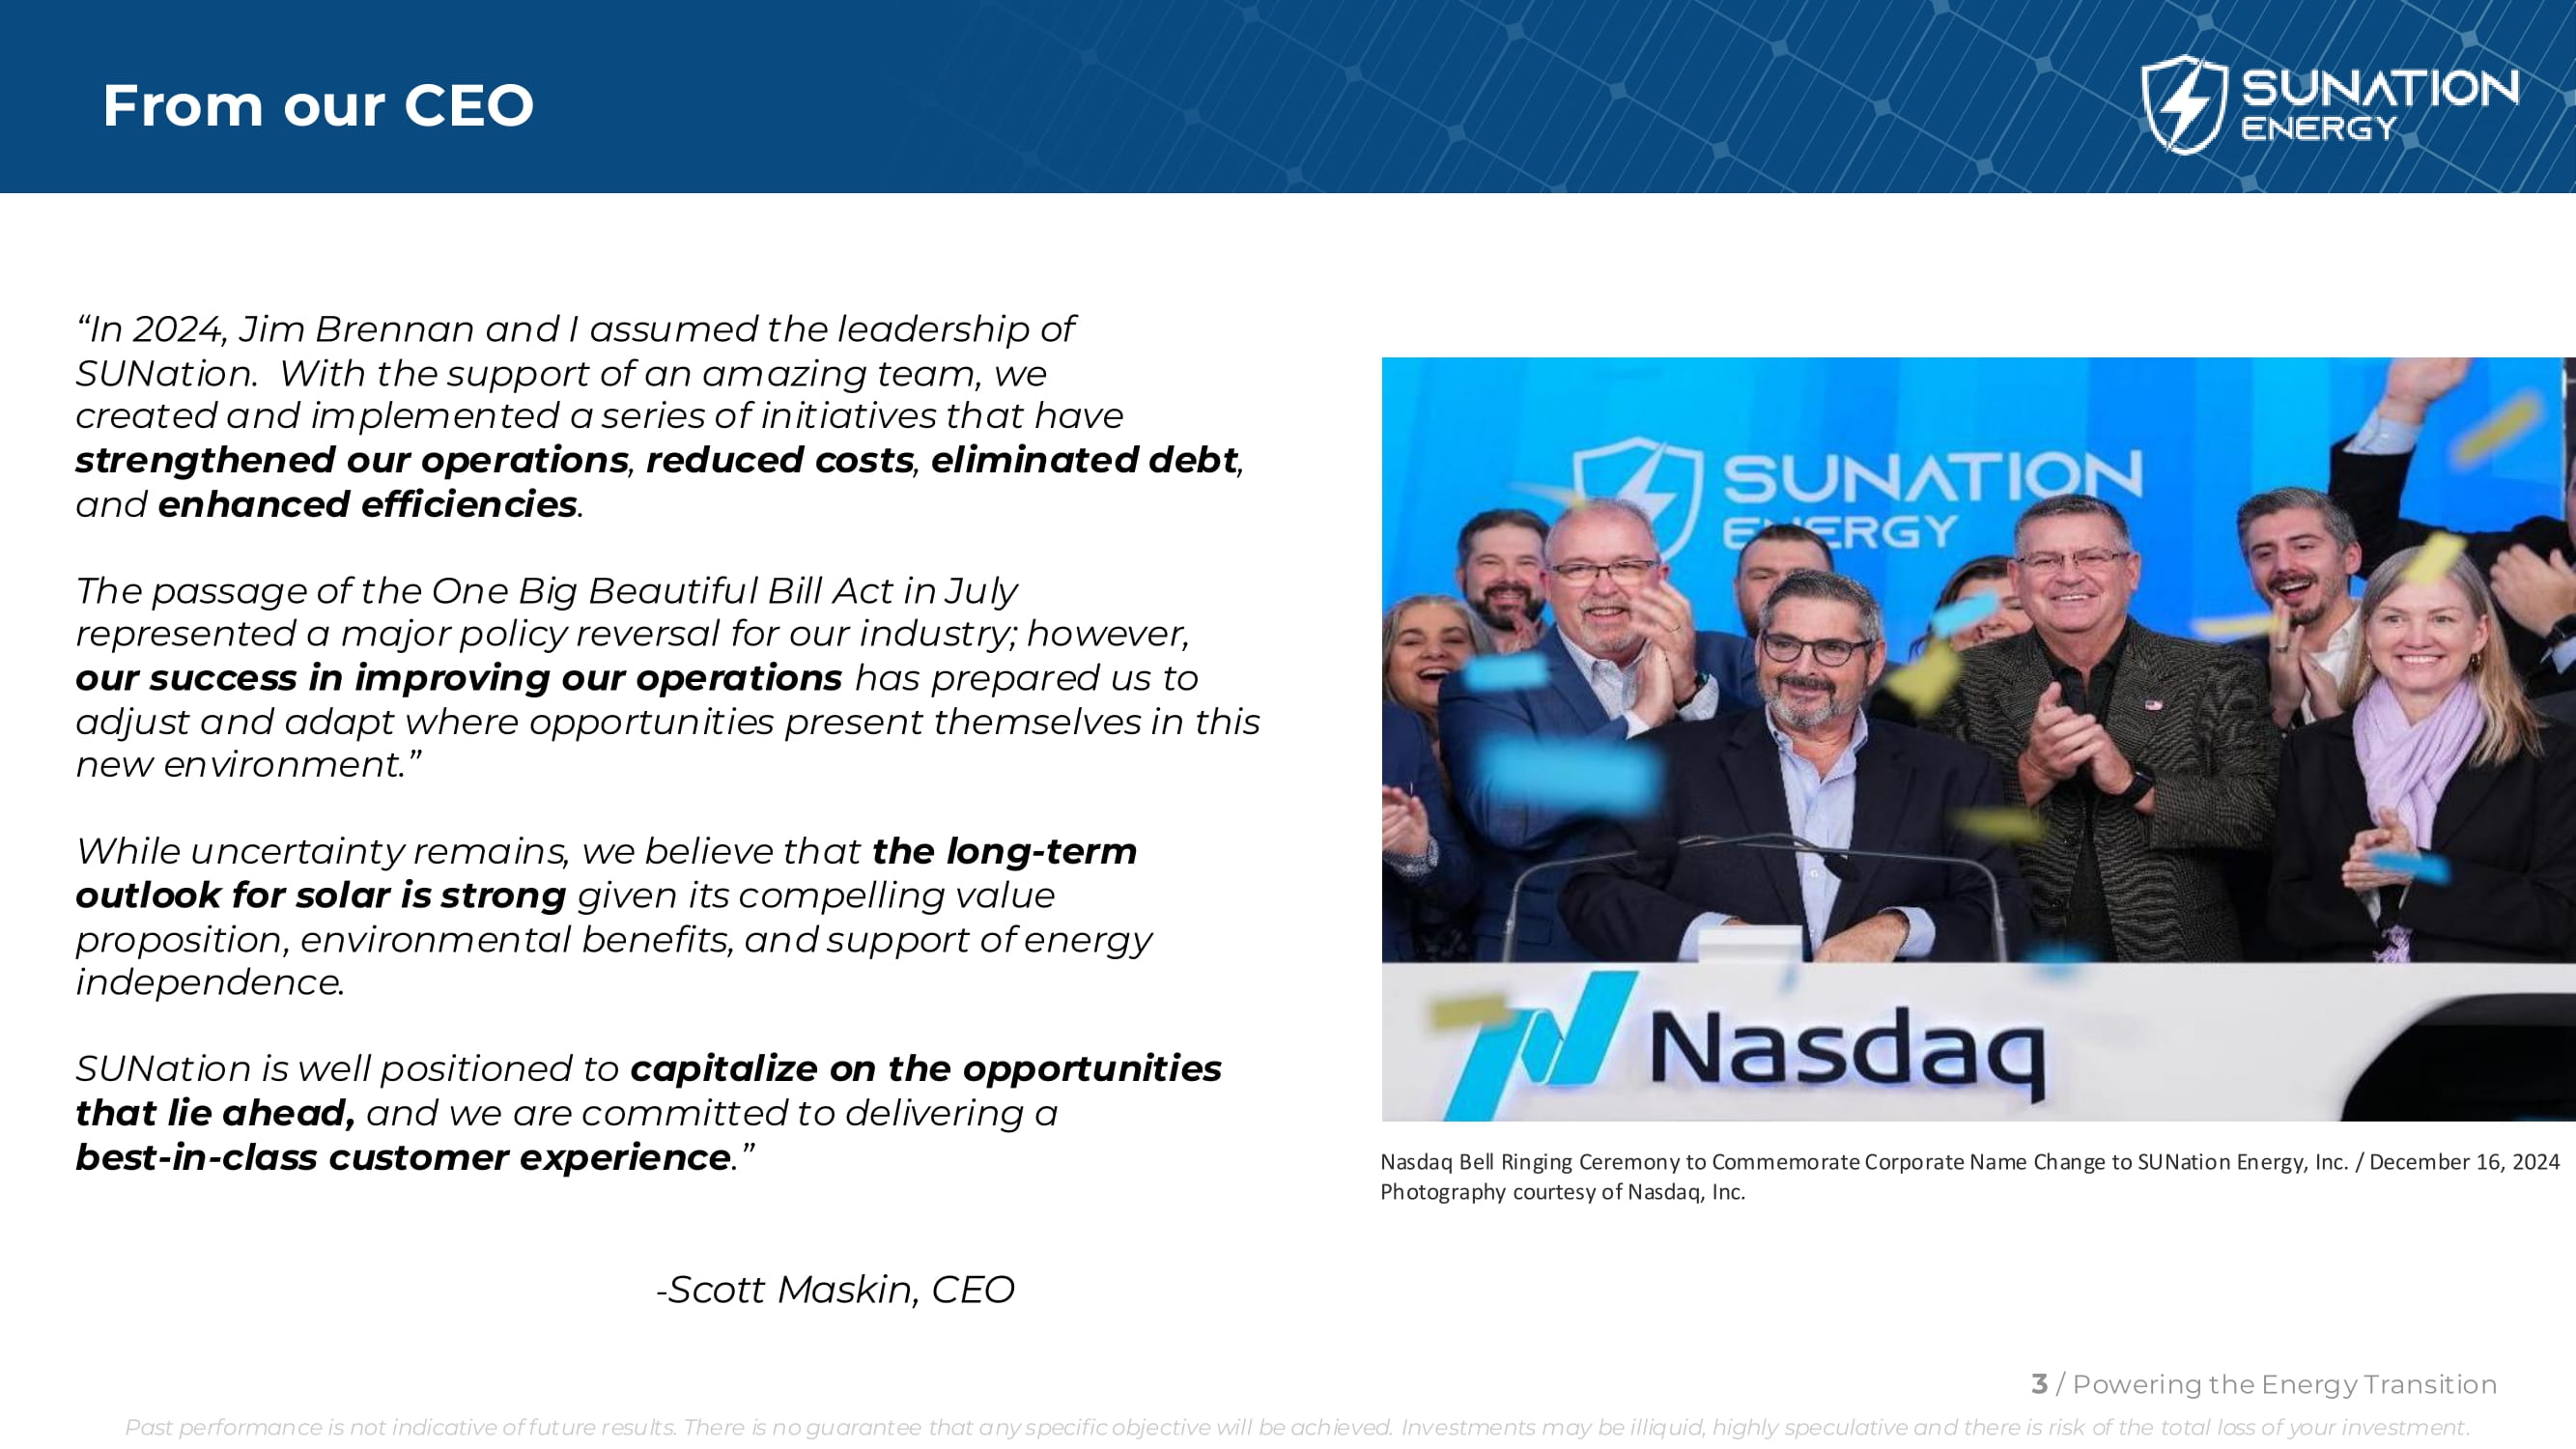
From our CEO “In 2024, Jim Brennan and I assumed the leadership of SUNation. With the support of an amazing team, we created and implemented a series of initiatives that have strengthened our operations , reduced costs , eliminated debt , and enhanced efficiencies . The passage of the One Big Beautiful Bill Act in July represented a major policy reversal for our industry; however, our success in improving our operations has prepared us to adjust and adapt where opportunities present themselves in this new environment.” While uncertainty remains, we believe that the long - term outlook for solar is strong given its compelling value proposition, environmental benefits, and support of energy independence. 3 / Powering the Energy Transition Past performance is not indicative of future results. There is no guarantee that any specific objective will be achieved. Investments may be illiquid, highly speculative and there is risk of the total loss of your investment. SUNation is well positioned to capitalize on the opportunities that lie ahead, and we are committed to delivering a best - in - class customer experience .” - Scott Maskin, CEO Nasdaq Bell Ringing Ceremony to Commemorate Corporate Name Change to SUNation Energy, Inc. / December 16, 2024 Photography courtesy of Nasdaq, Inc .
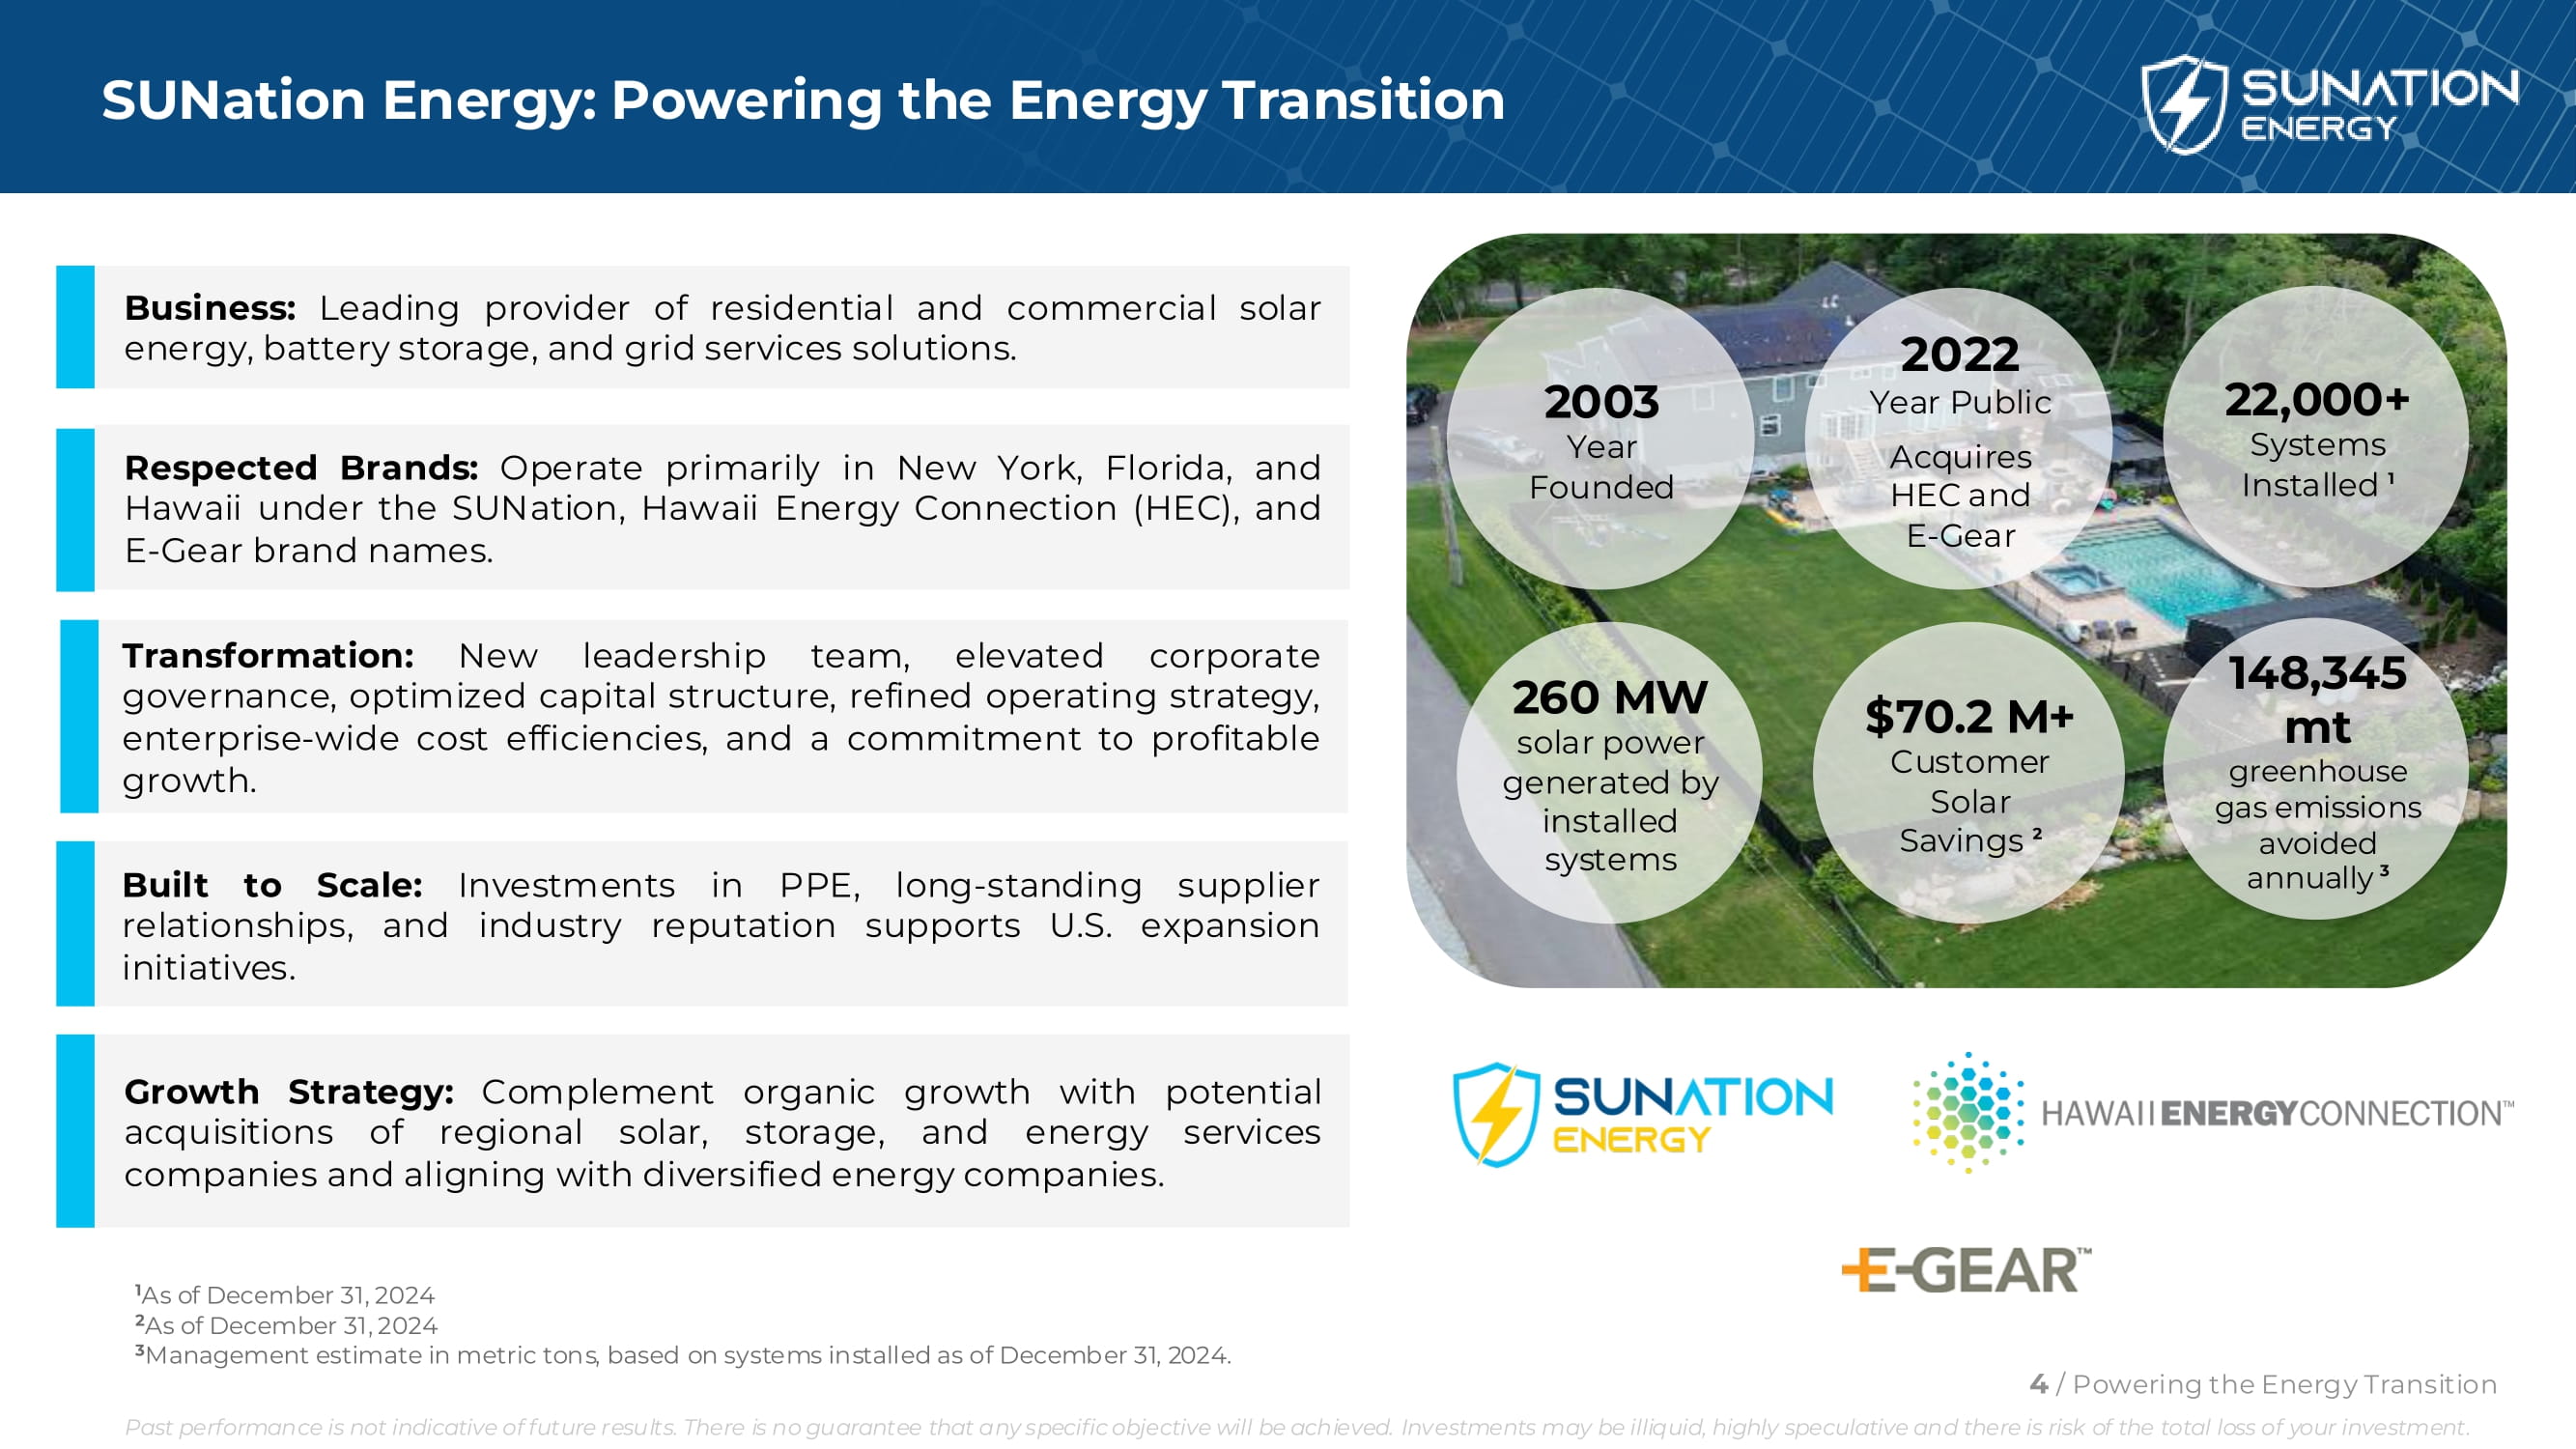
SUNation Energy: Powering the Energy Transition 2022 Year Public Acquires HEC and E - Gear 22,000+ Systems Installed 1 2003 Year Founded $70.2 M+ Customer Solar Savings 2 1 As of December 31, 2024 2 As of December 31, 2024 3 Management estimate in metric tons, based on systems installed as of December 31, 2024. Business: Leading provider of residential and commercial solar energy, battery storage, and grid services solutions. Transformation : New leadership team, elevated corporate governance, optimized capital structure, refined operating strategy, enterprise - wide cost efficiencies, and a commitment to profitable growth . Respected Brands : Operate primarily in New York, Florida, and Hawaii under the SUNation, Hawaii Energy Connection (HEC), and E - Gear brand names . Growth Strategy : Complement organic growth with potential acquisitions of regional solar, storage, and energy services companies and aligning with diversified energy companies . 260 MW solar power generated by installed systems 148,345 mt greenhouse gas emissions avoided annually 3 Built to Scale : Investments in PPE, long - standing supplier relationships, and industry reputation supports U . S . expansion initiatives . 4 / Powering the Energy Transition Past performance is not indicative of future results. There is no guarantee that any specific objective will be achieved. Investments may be illiquid, highly speculative and there is risk of the total loss of your investment.
Riding the “Solar Coaster” Macro Events • After an historic performance in 2022, the beginning of 2023 brought about significant industry challenges: • Silicon Valley Bank bankruptcy » Triggered an overnight change in solar payments to EPCs nationally and financial market uncertainty regarding FDIC secured accounts • California NEM 3.0 • Inflation • Interest rates • Bankruptcies from major industry players • Disruptive legislation in 2025 (OBBBA) “We’ve avoided more than a few icebergs - navigating through fabricated headwinds and economic noise - and SUNation has come out stronger. We’re stable, we’re lean, and in my view, we’re set up to outperform our peers.” - Scott Maskin, CEO August 2025 5 / Powering the Energy Transition Past performance is not indicative of future results. There is no guarantee that any specific objective will be achieved. Investments may be illiquid, highly speculative and there is risk of the total loss of your investment.
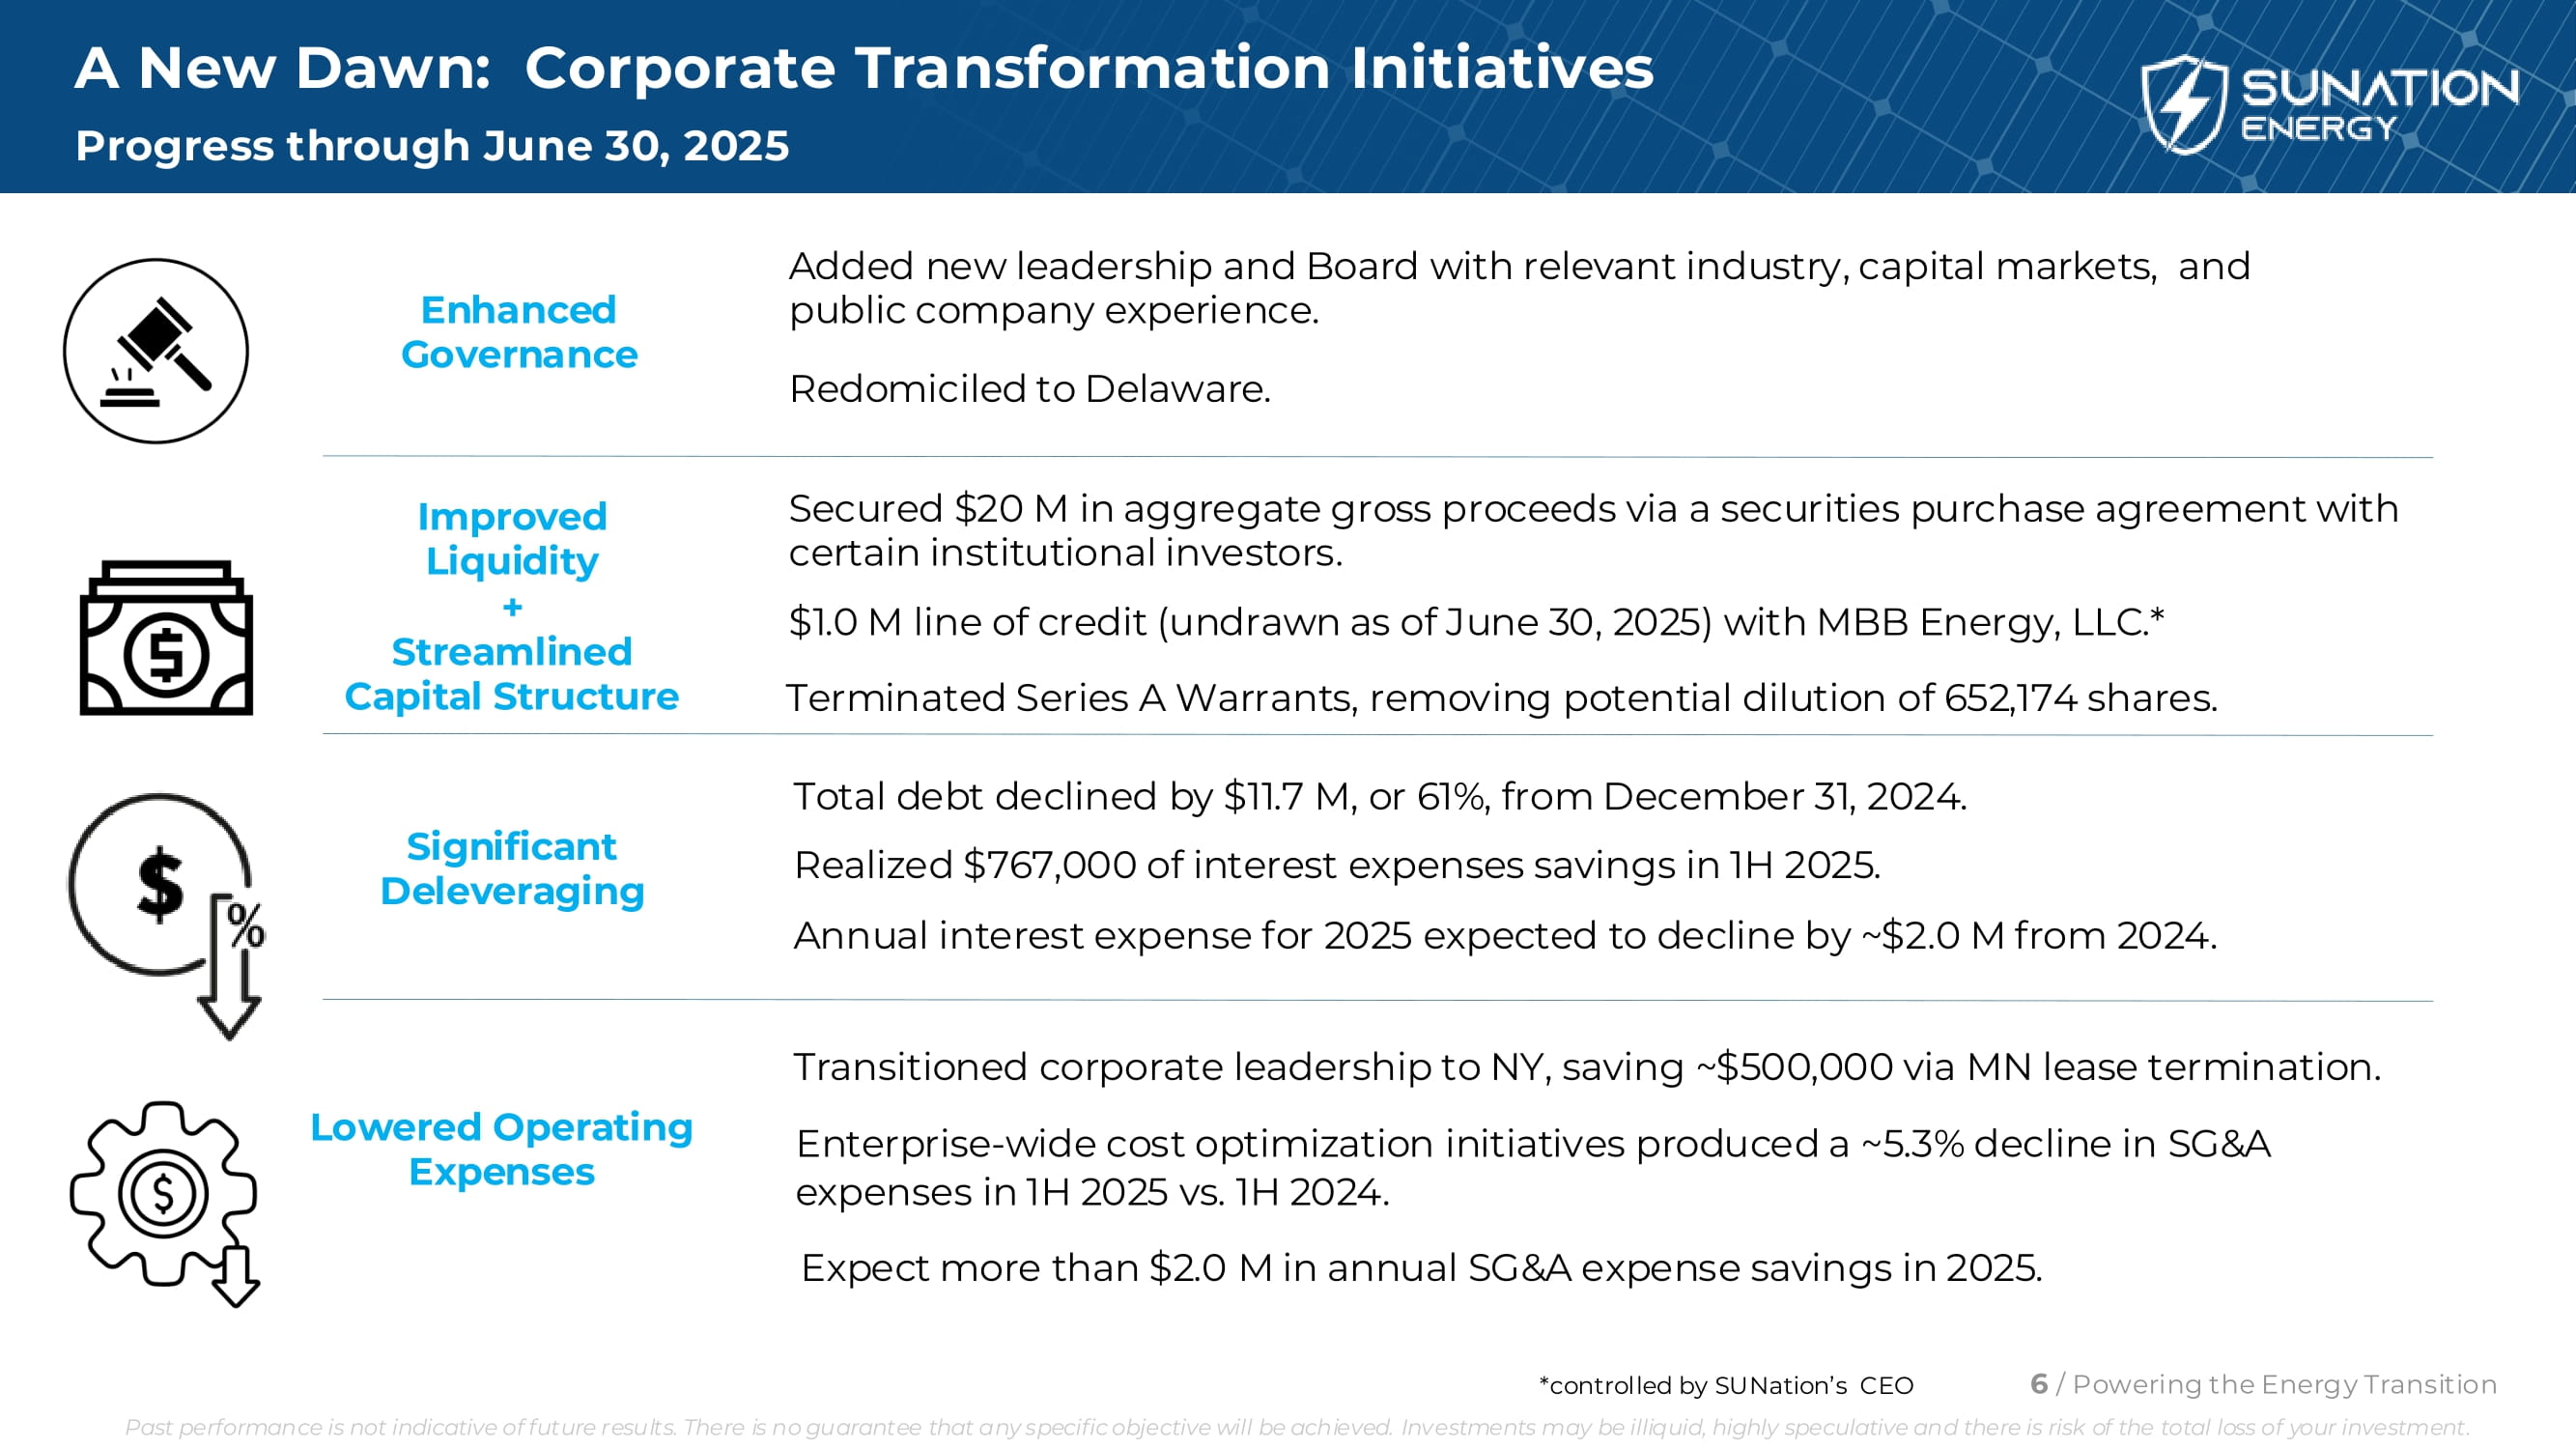
Enhanced Governance Improved Liquidity + Streamlined Capital Structure Significant Deleveraging Lowered Operating Expenses Added new leadership and Board with relevant industry, capital markets, and public company experience. Redomiciled to Delaware. Secured $20 M in aggregate gross proceeds via a securities purchase agreement with certain institutional investors. $1.0 M line of credit (undrawn as of June 30, 2025) with MBB Energy, LLC.* Terminated Series A Warrants, removing potential dilution of 652,174 shares. Total debt declined by $11.7 M, or 61%, from December 31, 2024. Realized $767,000 of interest expenses savings in 1H 2025. Annual interest expense for 2025 expected to decline by ~$2.0 M from 2024. Transitioned corporate leadership to NY, saving ~$500,000 via MN lease termination. Enterprise - wide cost optimization initiatives produced a ~5.3% decline in SG&A expenses in 1H 2025 vs. 1H 2024. Expect more than $2.0 M in annual SG&A expense savings in 2025. A New Dawn: Corporate Transformation Initiatives Progress through June 30, 2025 6 / Powering the Energy Transition *controlled by SUNation’s CEO Past performance is not indicative of future results. There is no guarantee that any specific objective will be achieved. Investments may be illiquid, highly speculative and there is risk of the total loss of your investment.
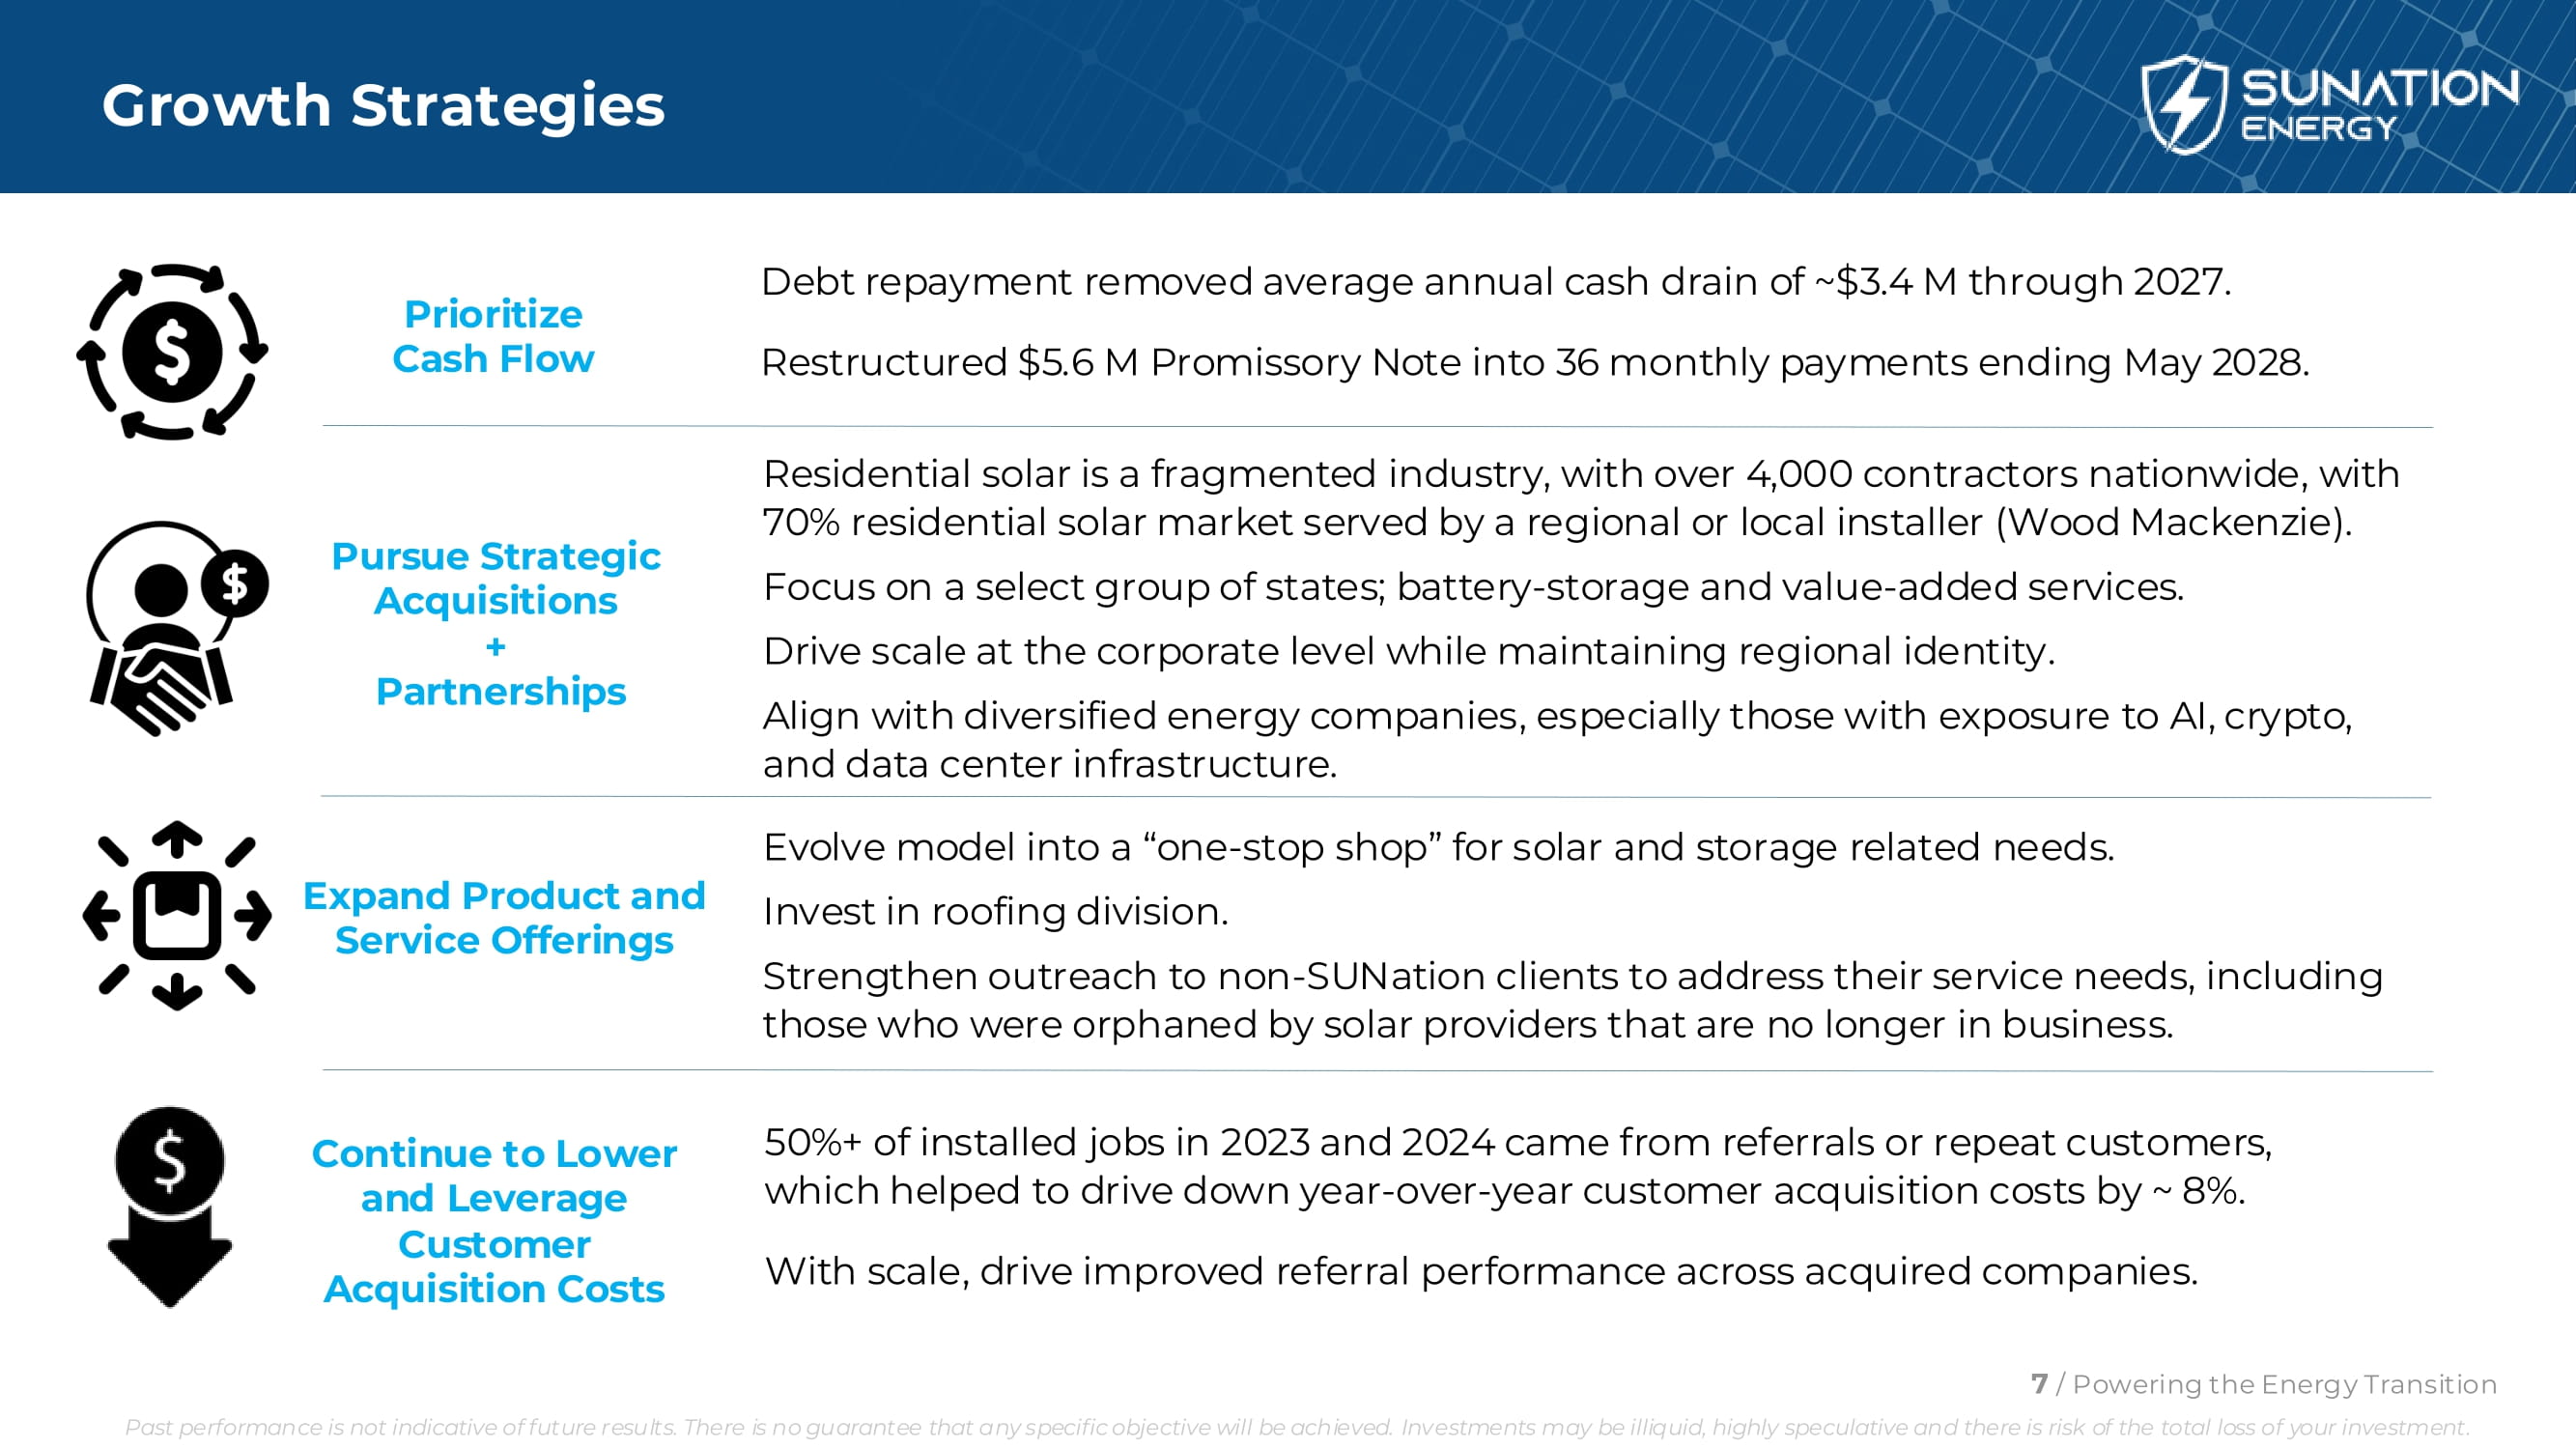
Prioritize Cash Flow Continue to Lower and Leverage Customer Acquisition Costs Pursue Strategic Acquisitions + Partnerships Expand Product and Service Offerings Debt repayment removed average annual cash drain of ~$3.4 M through 2027. Restructured $5.6 M Promissory Note into 36 monthly payments ending May 2028. Growth Strategies Residential solar is a fragmented industry, with over 4,000 contractors nationwide, with 70% residential solar market served by a regional or local installer (Wood Mackenzie). Focus on a select group of states; battery - storage and value - added services. Drive scale at the corporate level while maintaining regional identity. Align with diversified energy companies, especially those with exposure to AI, crypto, and data center infrastructure. 50%+ of installed jobs in 2023 and 2024 came from referrals or repeat customers, which helped to drive down year - over - year customer acquisition costs by ~ 8%. With scale, drive improved referral performance across acquired companies. 7 / Powering the Energy Transition Past performance is not indicative of future results. There is no guarantee that any specific objective will be achieved. Investments may be illiquid, highly speculative and there is risk of the total loss of your investment. Evolve model into a “one - stop shop” for solar and storage related needs. Invest in roofing division. Strengthen outreach to non - SUNation clients to address their service needs, including those who were orphaned by solar providers that are no longer in business.
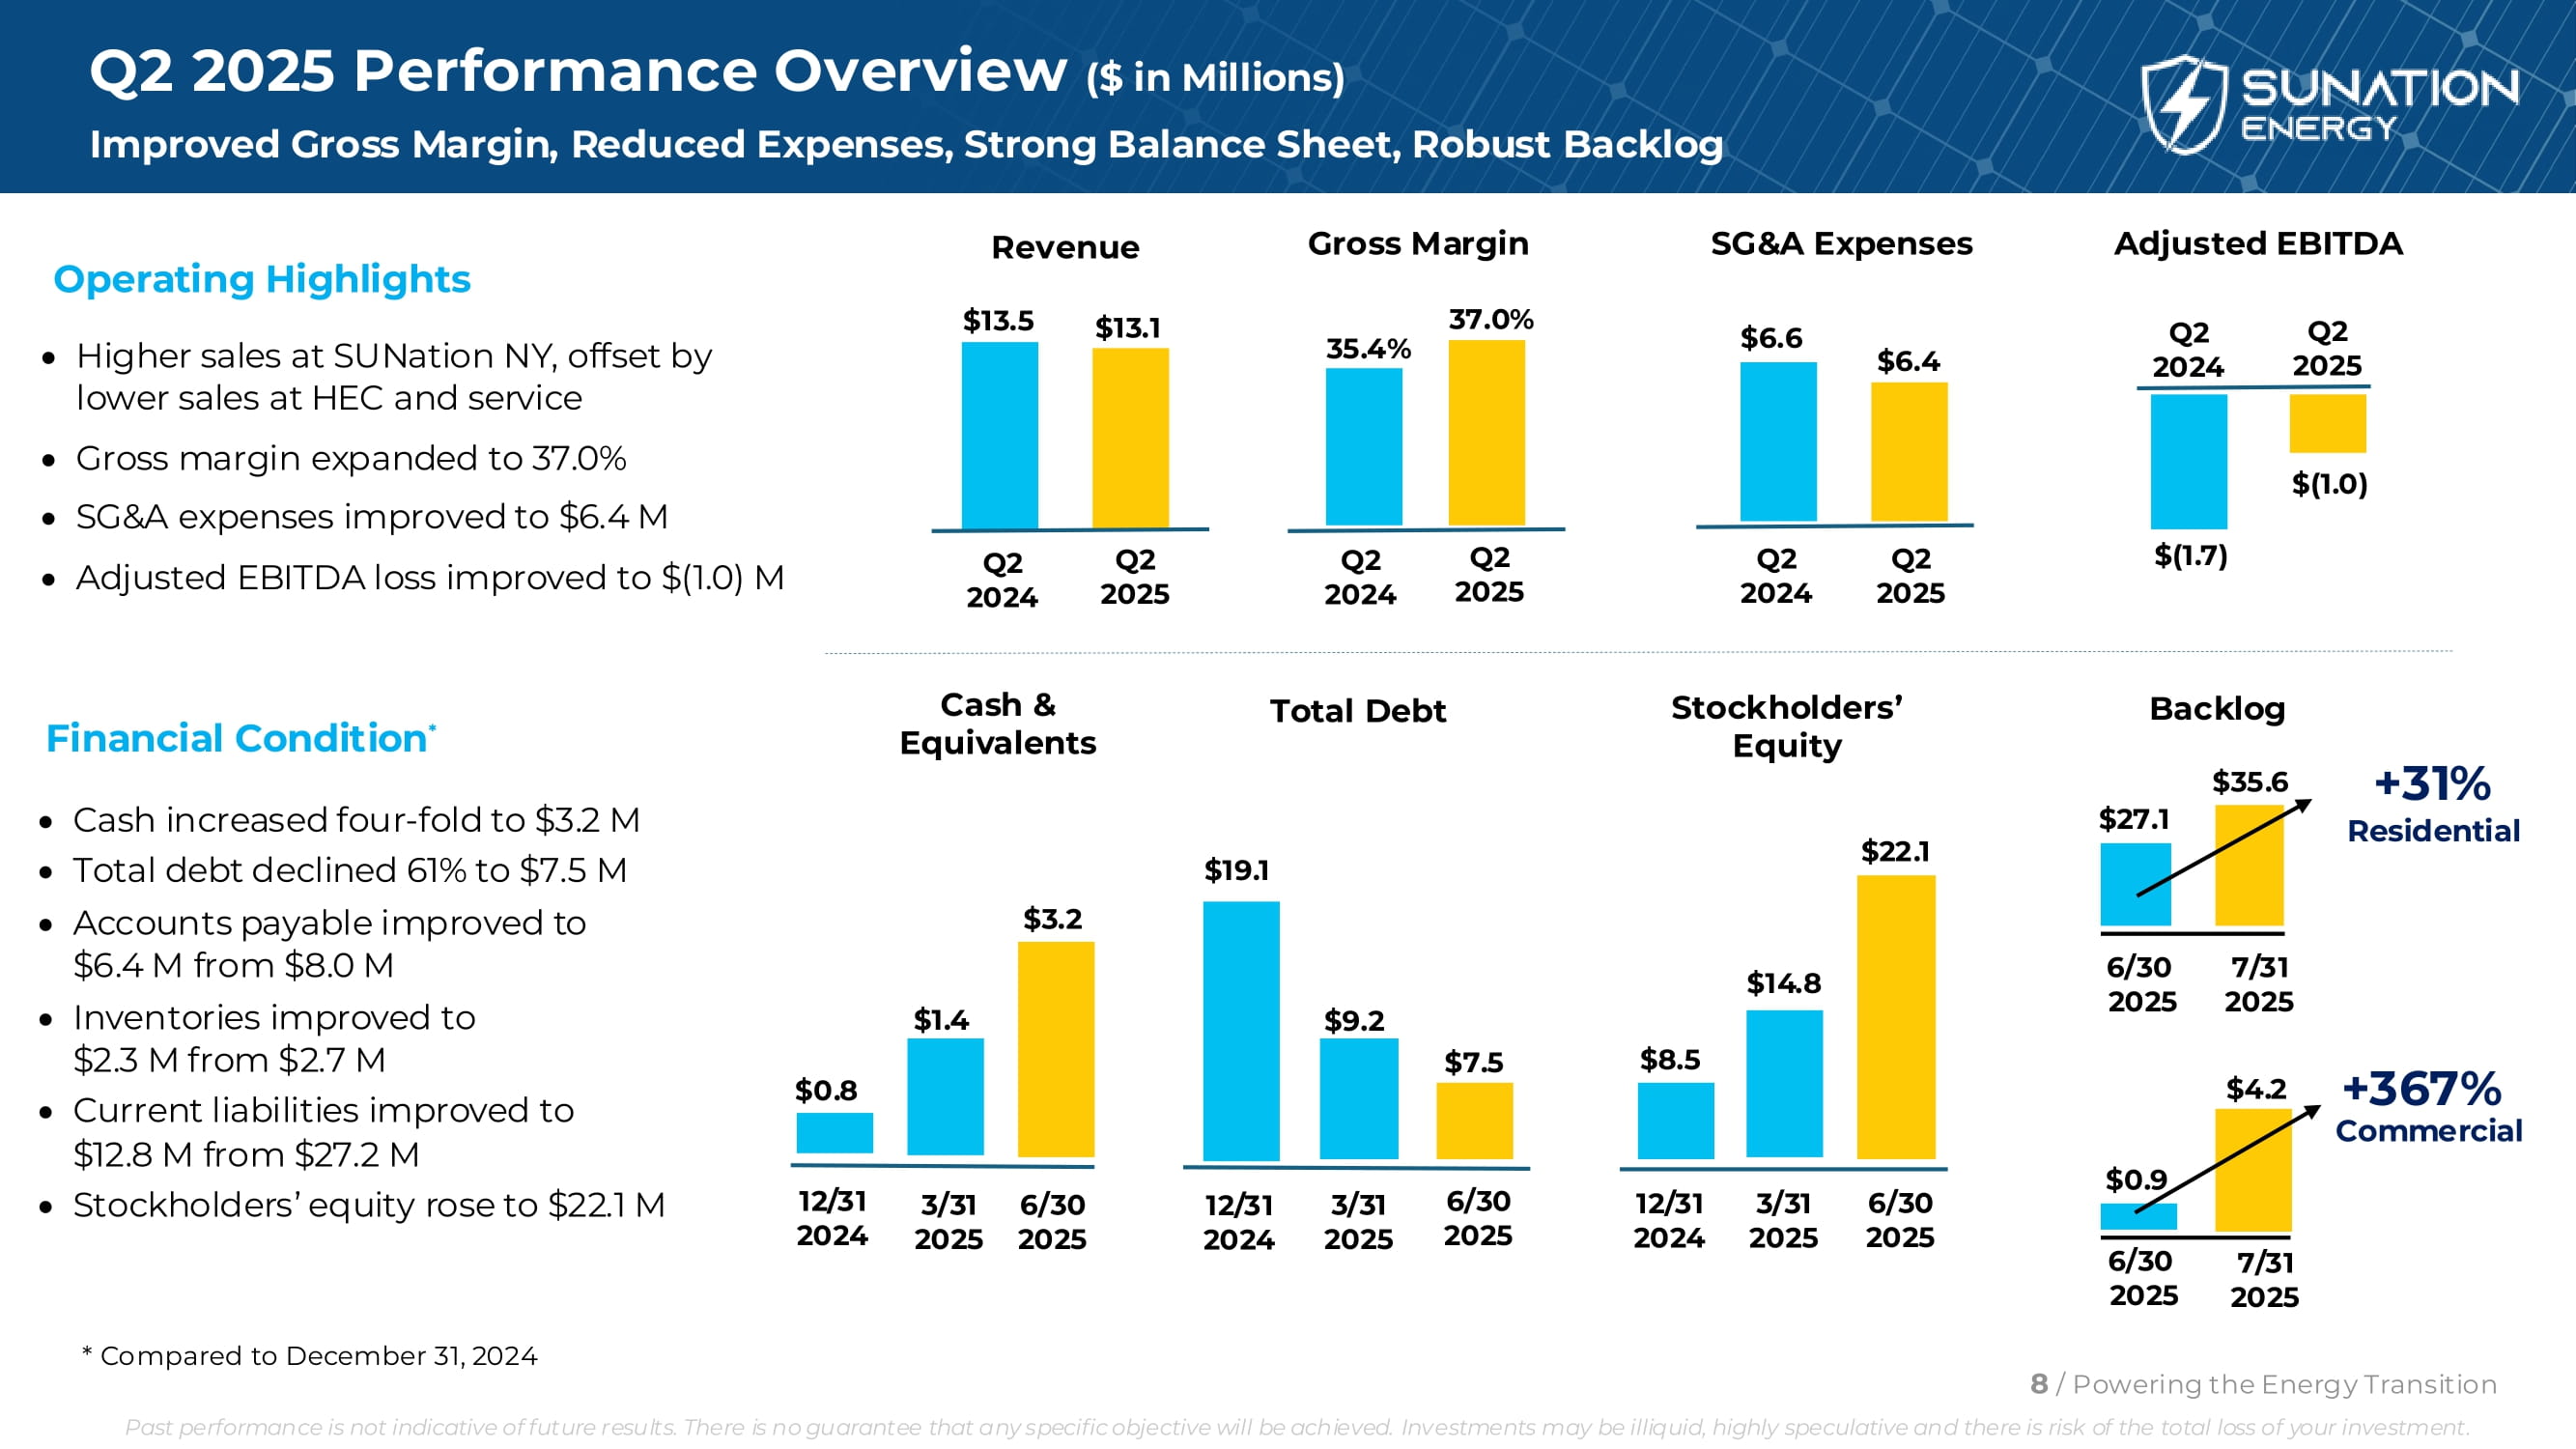
Q2 2025 Performance Overview ($ in Millions) Improved Gross Margin, Reduced Expenses, Strong Balance Sheet, Robust Backlog Revenue Gross Margin SG&A Expenses Adjusted EBITDA 35.4% 37.0% $13.5 $13.1 Q2 2024 Q2 2025 $6.6 $6.4 $(1.0) Q2 2024 Q2 2025 $(1.7) Q2 2024 Q2 2025 Q2 2024 Q2 2025 Cash & Equivalents Total Debt Stockholders’ Equity $0.8 $1.4 12/31 2024 3/31 2025 6/30 2025 $3.2 $19.1 $9.2 $7.5 $8.5 $14.8 $22.1 Operating Highlights Higher sales at SUNation NY, offset by lower sales at HEC and service Gross margin expanded to 37.0% SG&A expenses improved to $6.4 M Adjusted EBITDA loss improved to $(1.0) M 12/31 2024 3/31 2025 6/30 2025 Backlog 6/30 2025 7/31 2025 $27.1 $35.6 6/30 2025 7/31 2025 $0.9 $4.2 Financial Condition * Cash increased four - fold to $3.2 M Total debt declined 61% to $7.5 M Accounts payable improved to $6.4 M from $8.0 M Inventories improved to $2.3 M from $2.7 M Current liabilities improved to $12.8 M from $27.2 M Stockholders’ equity rose to $22.1 M 12/31 2024 3/31 6/30 2025 2025 * Compared to December 31, 2024 +31% Residential +367% Commercial 8 / Powering the Energy Transition Past performance is not indicative of future results. There is no guarantee that any specific objective will be achieved. Investments may be illiquid, highly speculative and there is risk of the total loss of your investment.
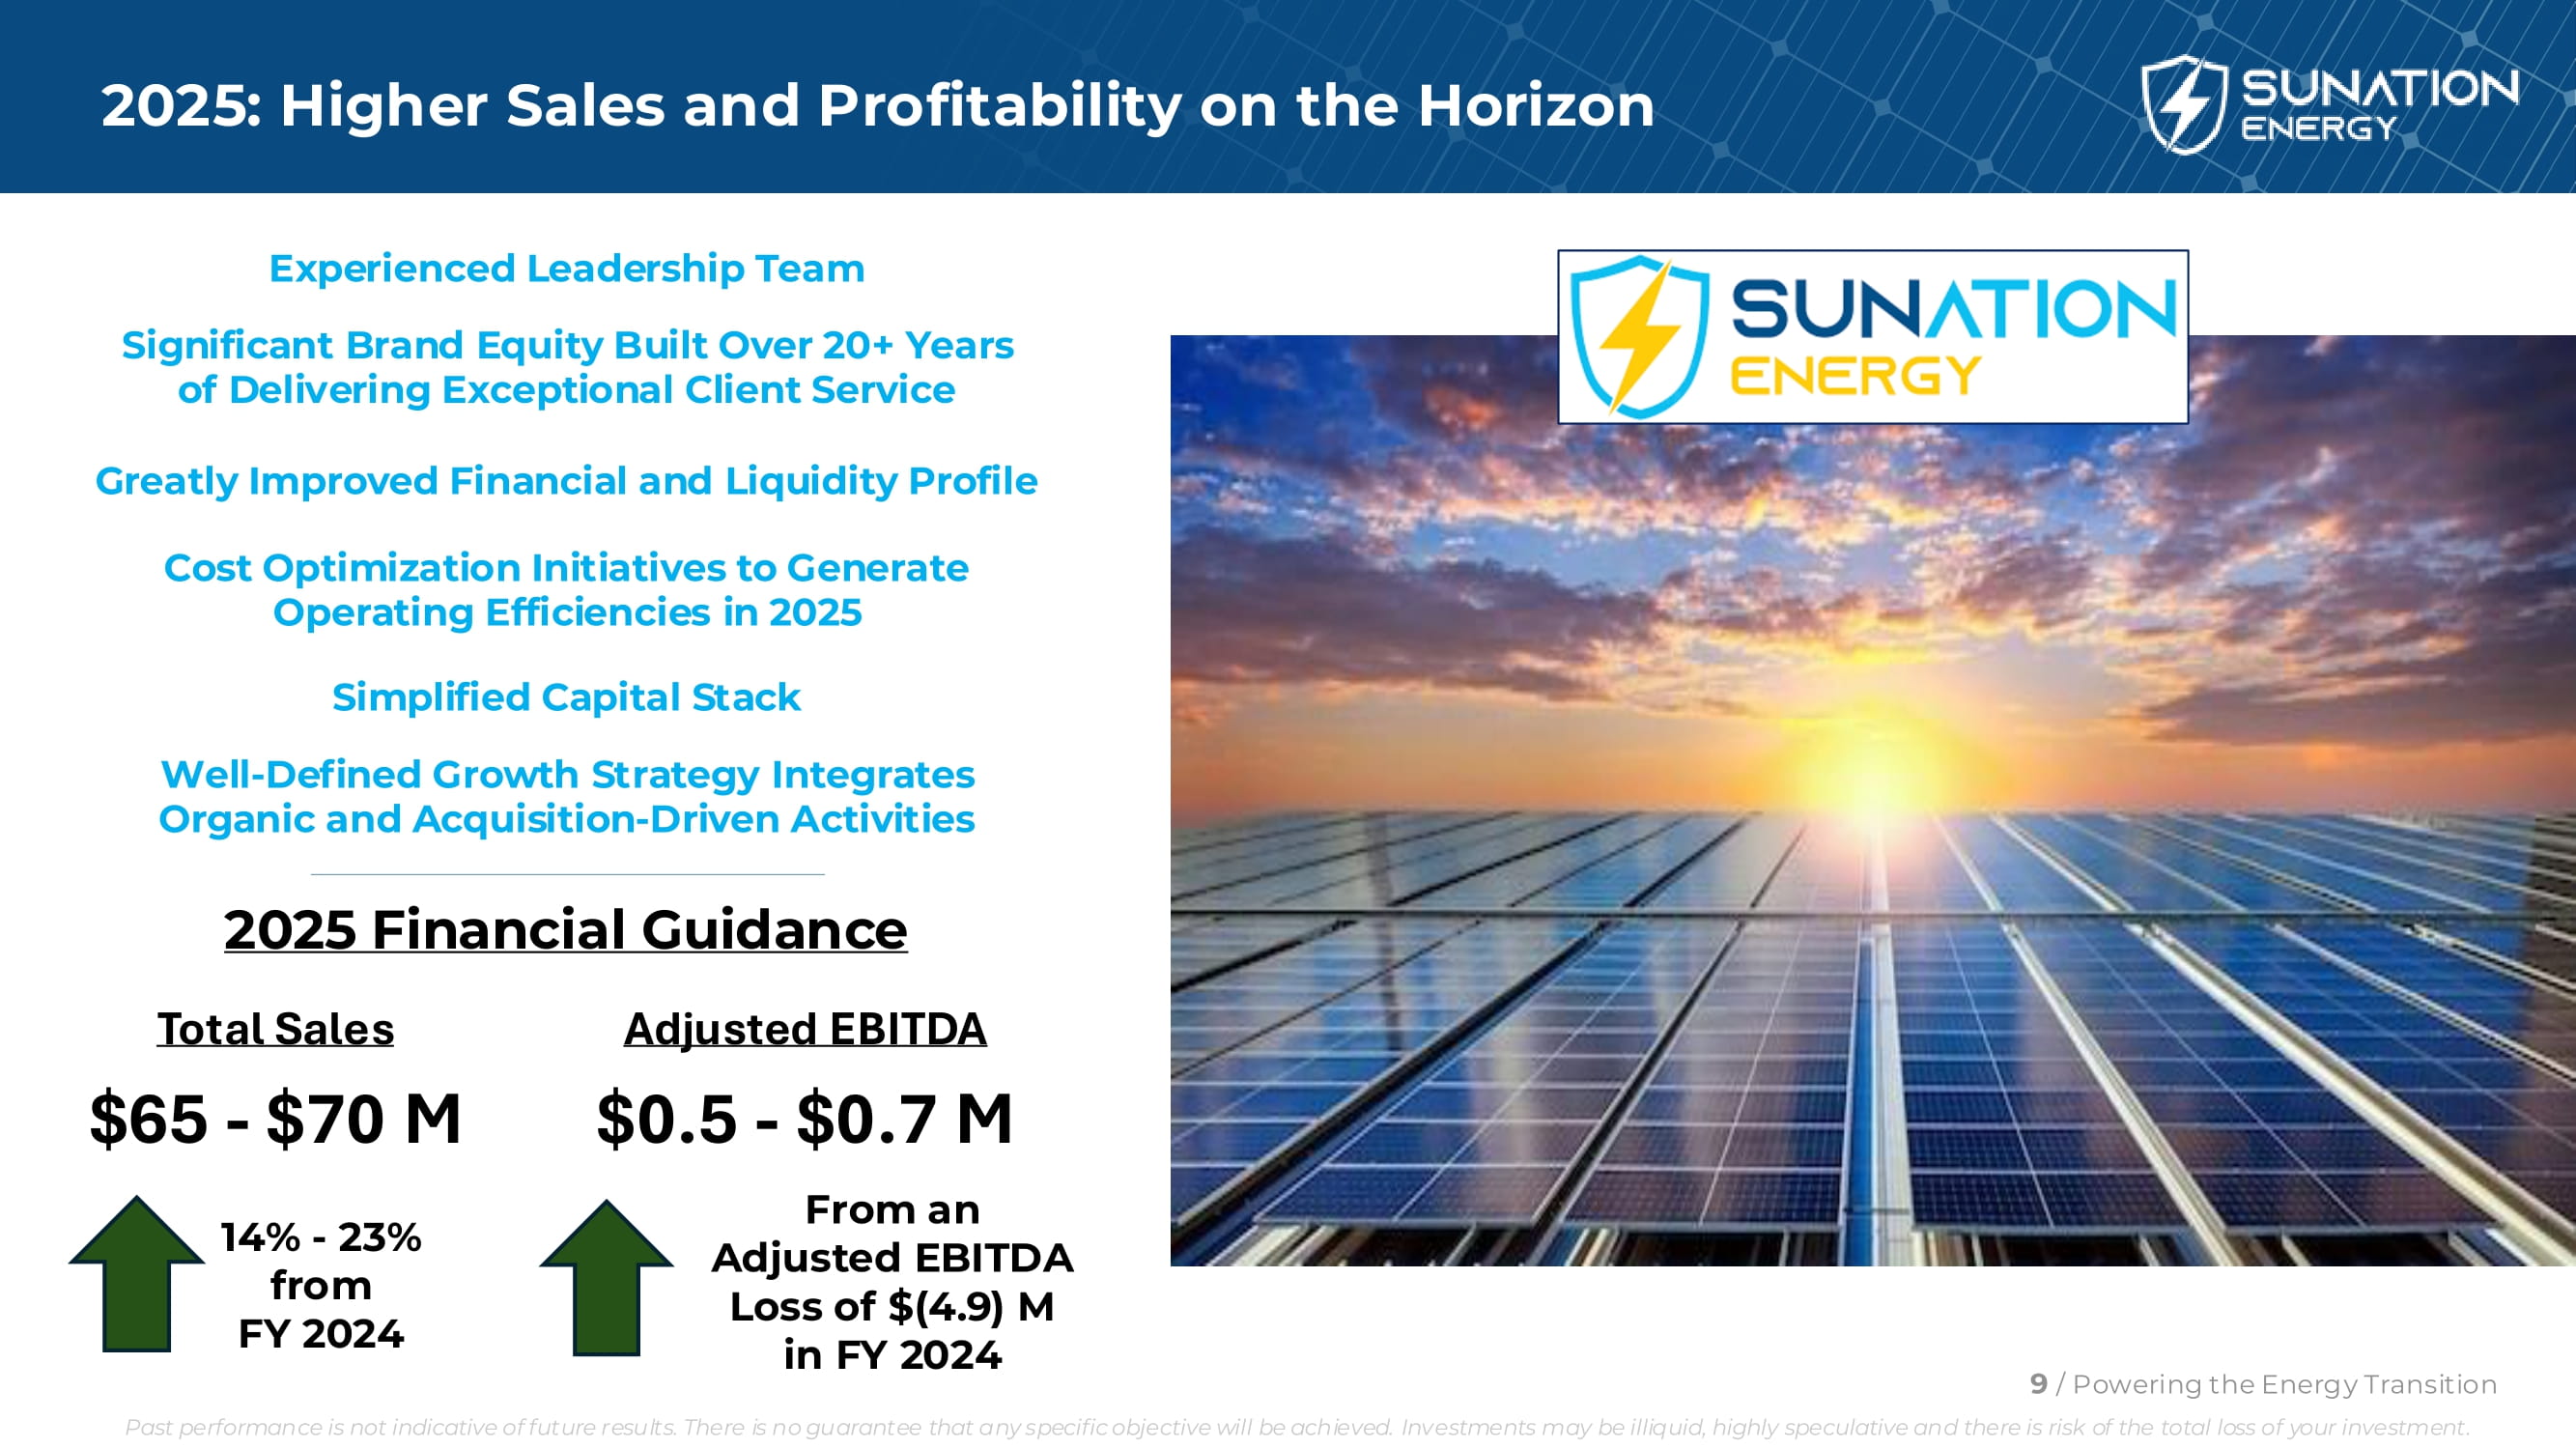
2025: Higher Sales and Profitability on the Horizon Experienced Leadership Team Significant Brand Equity Built Over 20+ Years of Delivering Exceptional Client Service Greatly Improved Financial and Liquidity Profile Cost Optimization Initiatives to Generate Operating Efficiencies in 2025 Simplified Capital Stack Well - Defined Growth Strategy Integrates Organic and Acquisition - Driven Activities 2025 Financial Guidance Total Sales $65 - $70 M 14% - 23% from FY 2024 Adjusted EBITDA $0.5 - $0.7 M From an Adjusted EBITDA Loss of $(4.9) M in FY 2024 9 / Powering the Energy Transition Past performance is not indicative of future results. There is no guarantee that any specific objective will be achieved. Investments may be illiquid, highly speculative and there is risk of the total loss of your investment.
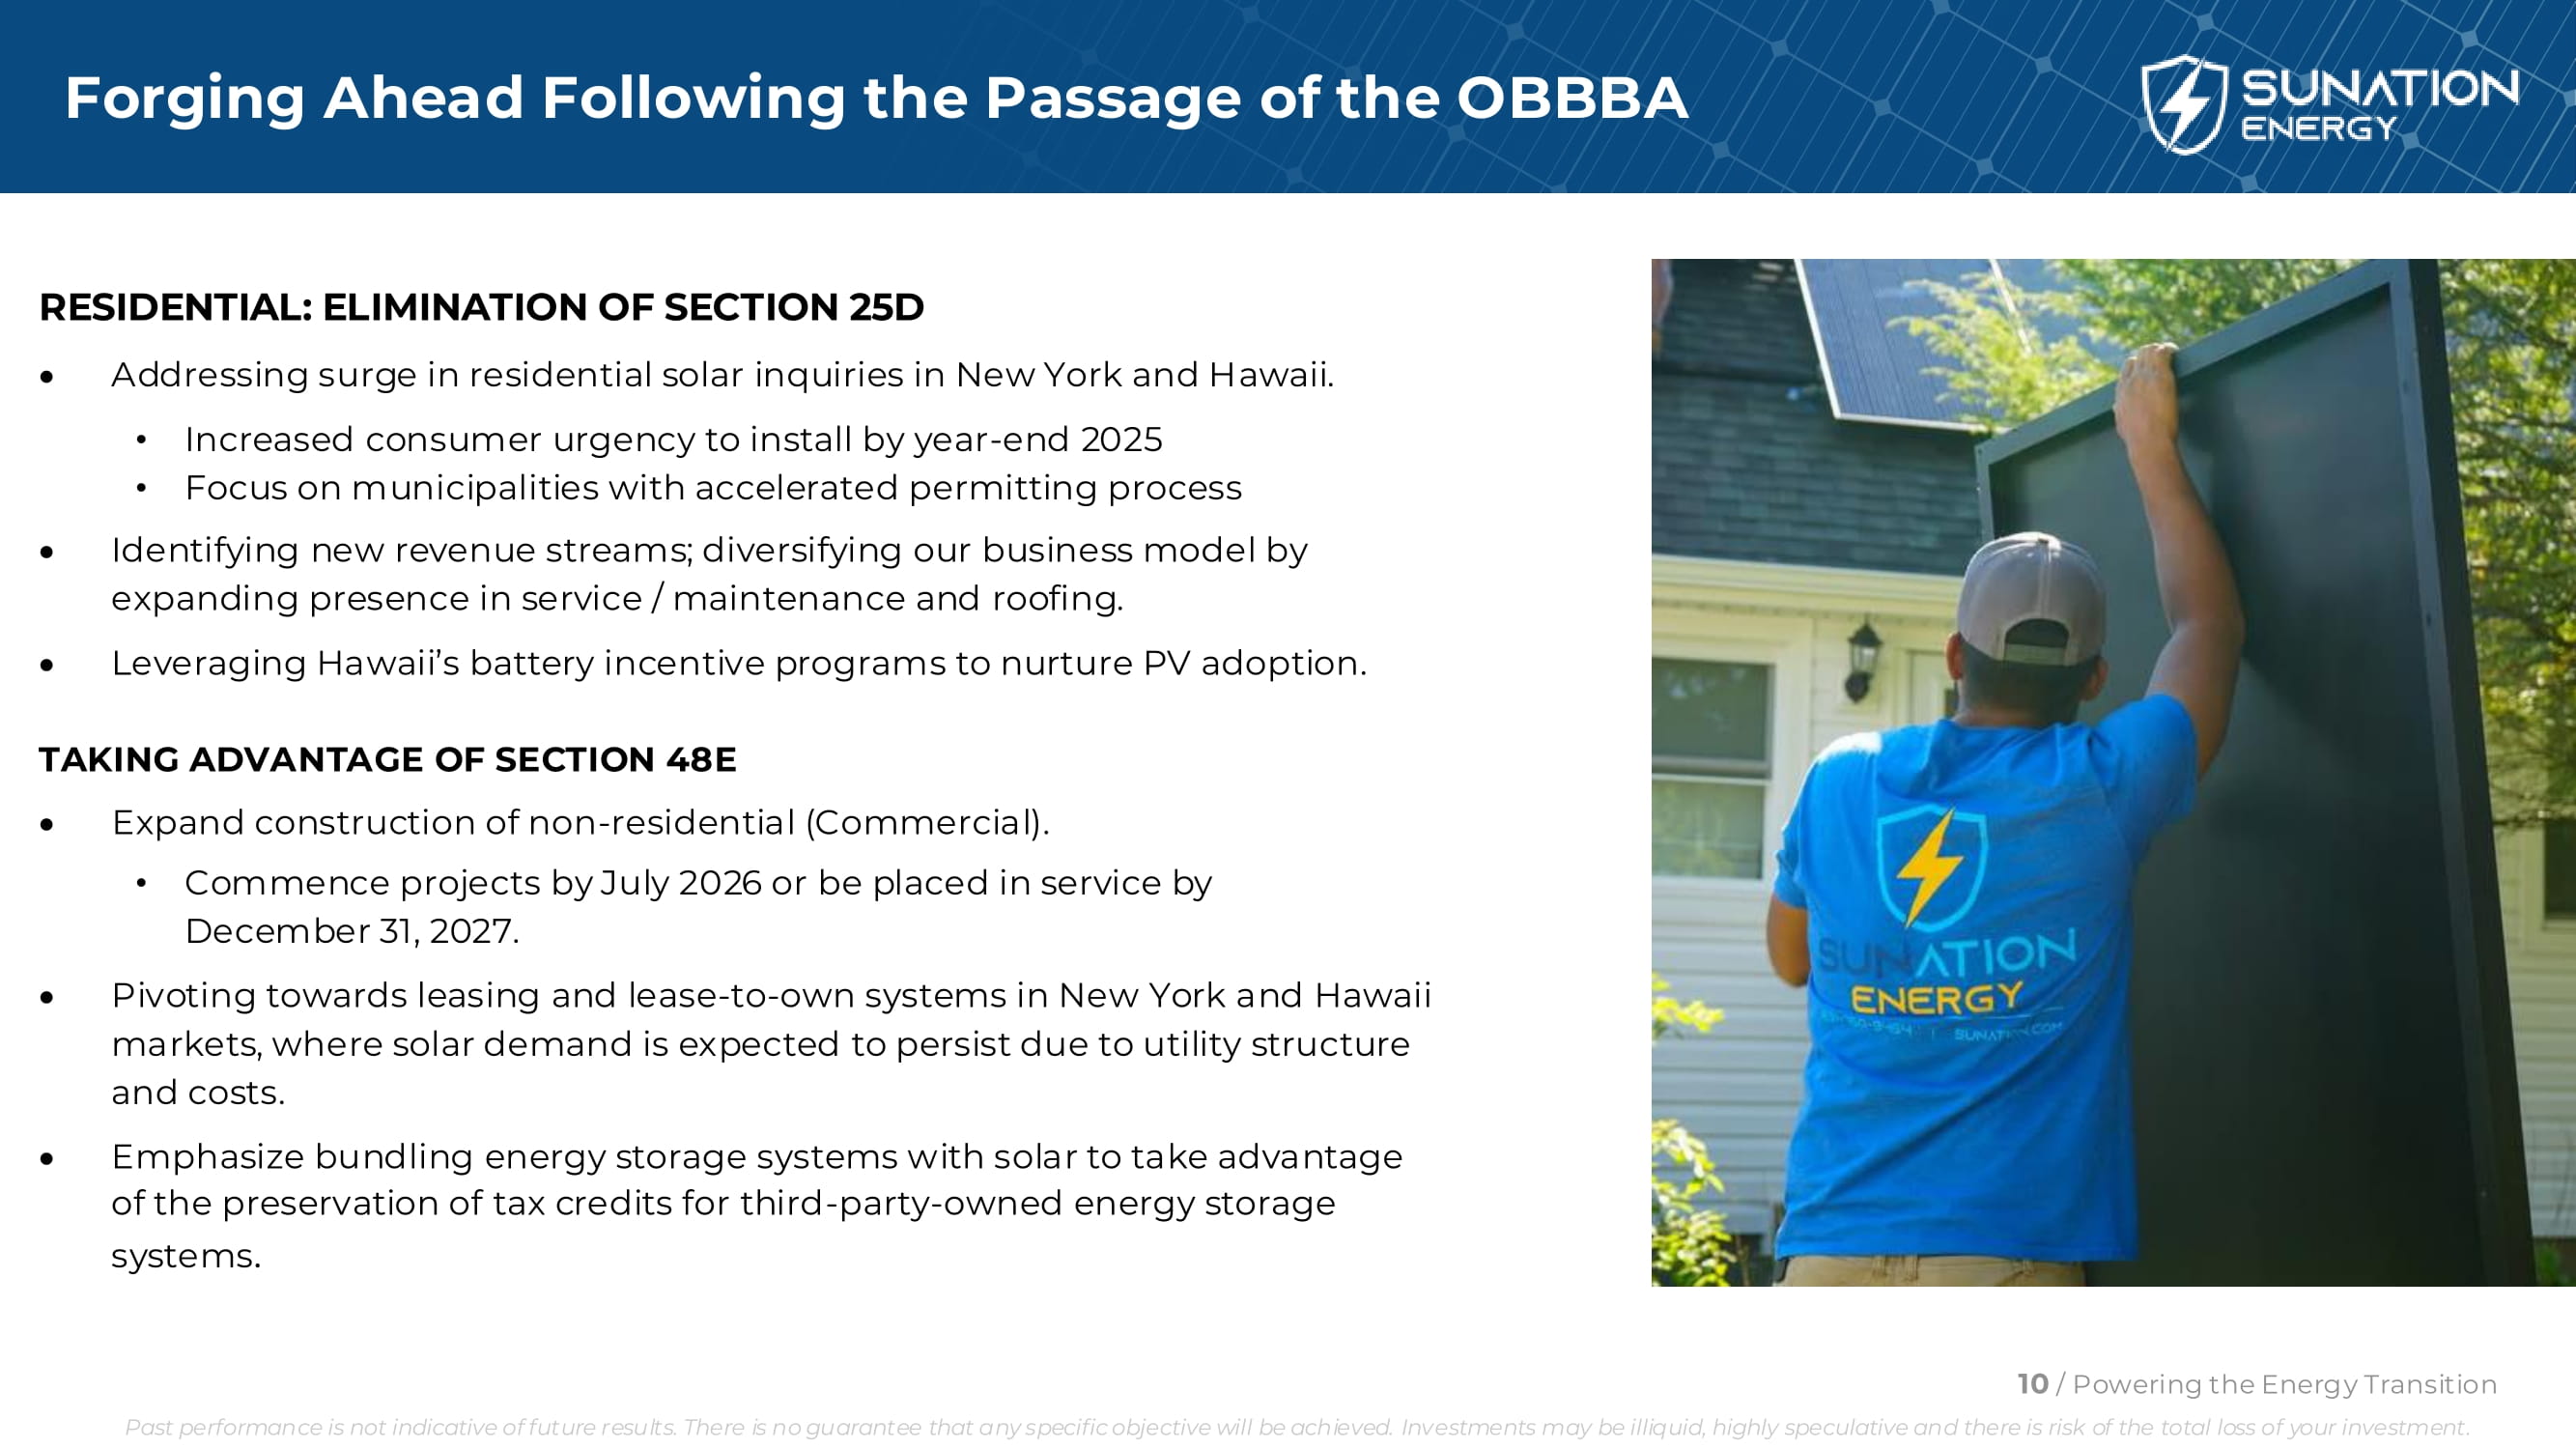
Forging Ahead Following the Passage of the OBBBA RESIDENTIAL: ELIMINATION OF SECTION 25D Addressing surge in residential solar inquiries in New York and Hawaii. • Increased consumer urgency to install by year - end 2025 • Focus on municipalities with accelerated permitting process Identifying new revenue streams; diversifying our business model by expanding presence in service / maintenance and roofing. Leveraging Hawaii’s battery incentive programs to nurture PV adoption. TAKING ADVANTAGE OF SECTION 48E Expand construction of non - residential (Commercial). • Commence projects by July 2026 or be placed in service by December 31, 2027. Pivoting towards leasing and lease - to - own systems in New York and Hawaii markets, where solar demand is expected to persist due to utility structure and costs. Emphasize bundling energy storage systems with solar to take advantage of the preservation of tax credits for third - party - owned energy storage systems . 10 / Powering the Energy Transition Past performance is not indicative of future results. There is no guarantee that any specific objective will be achieved. Investments may be illiquid, highly speculative and there is risk of the total loss of your investment.
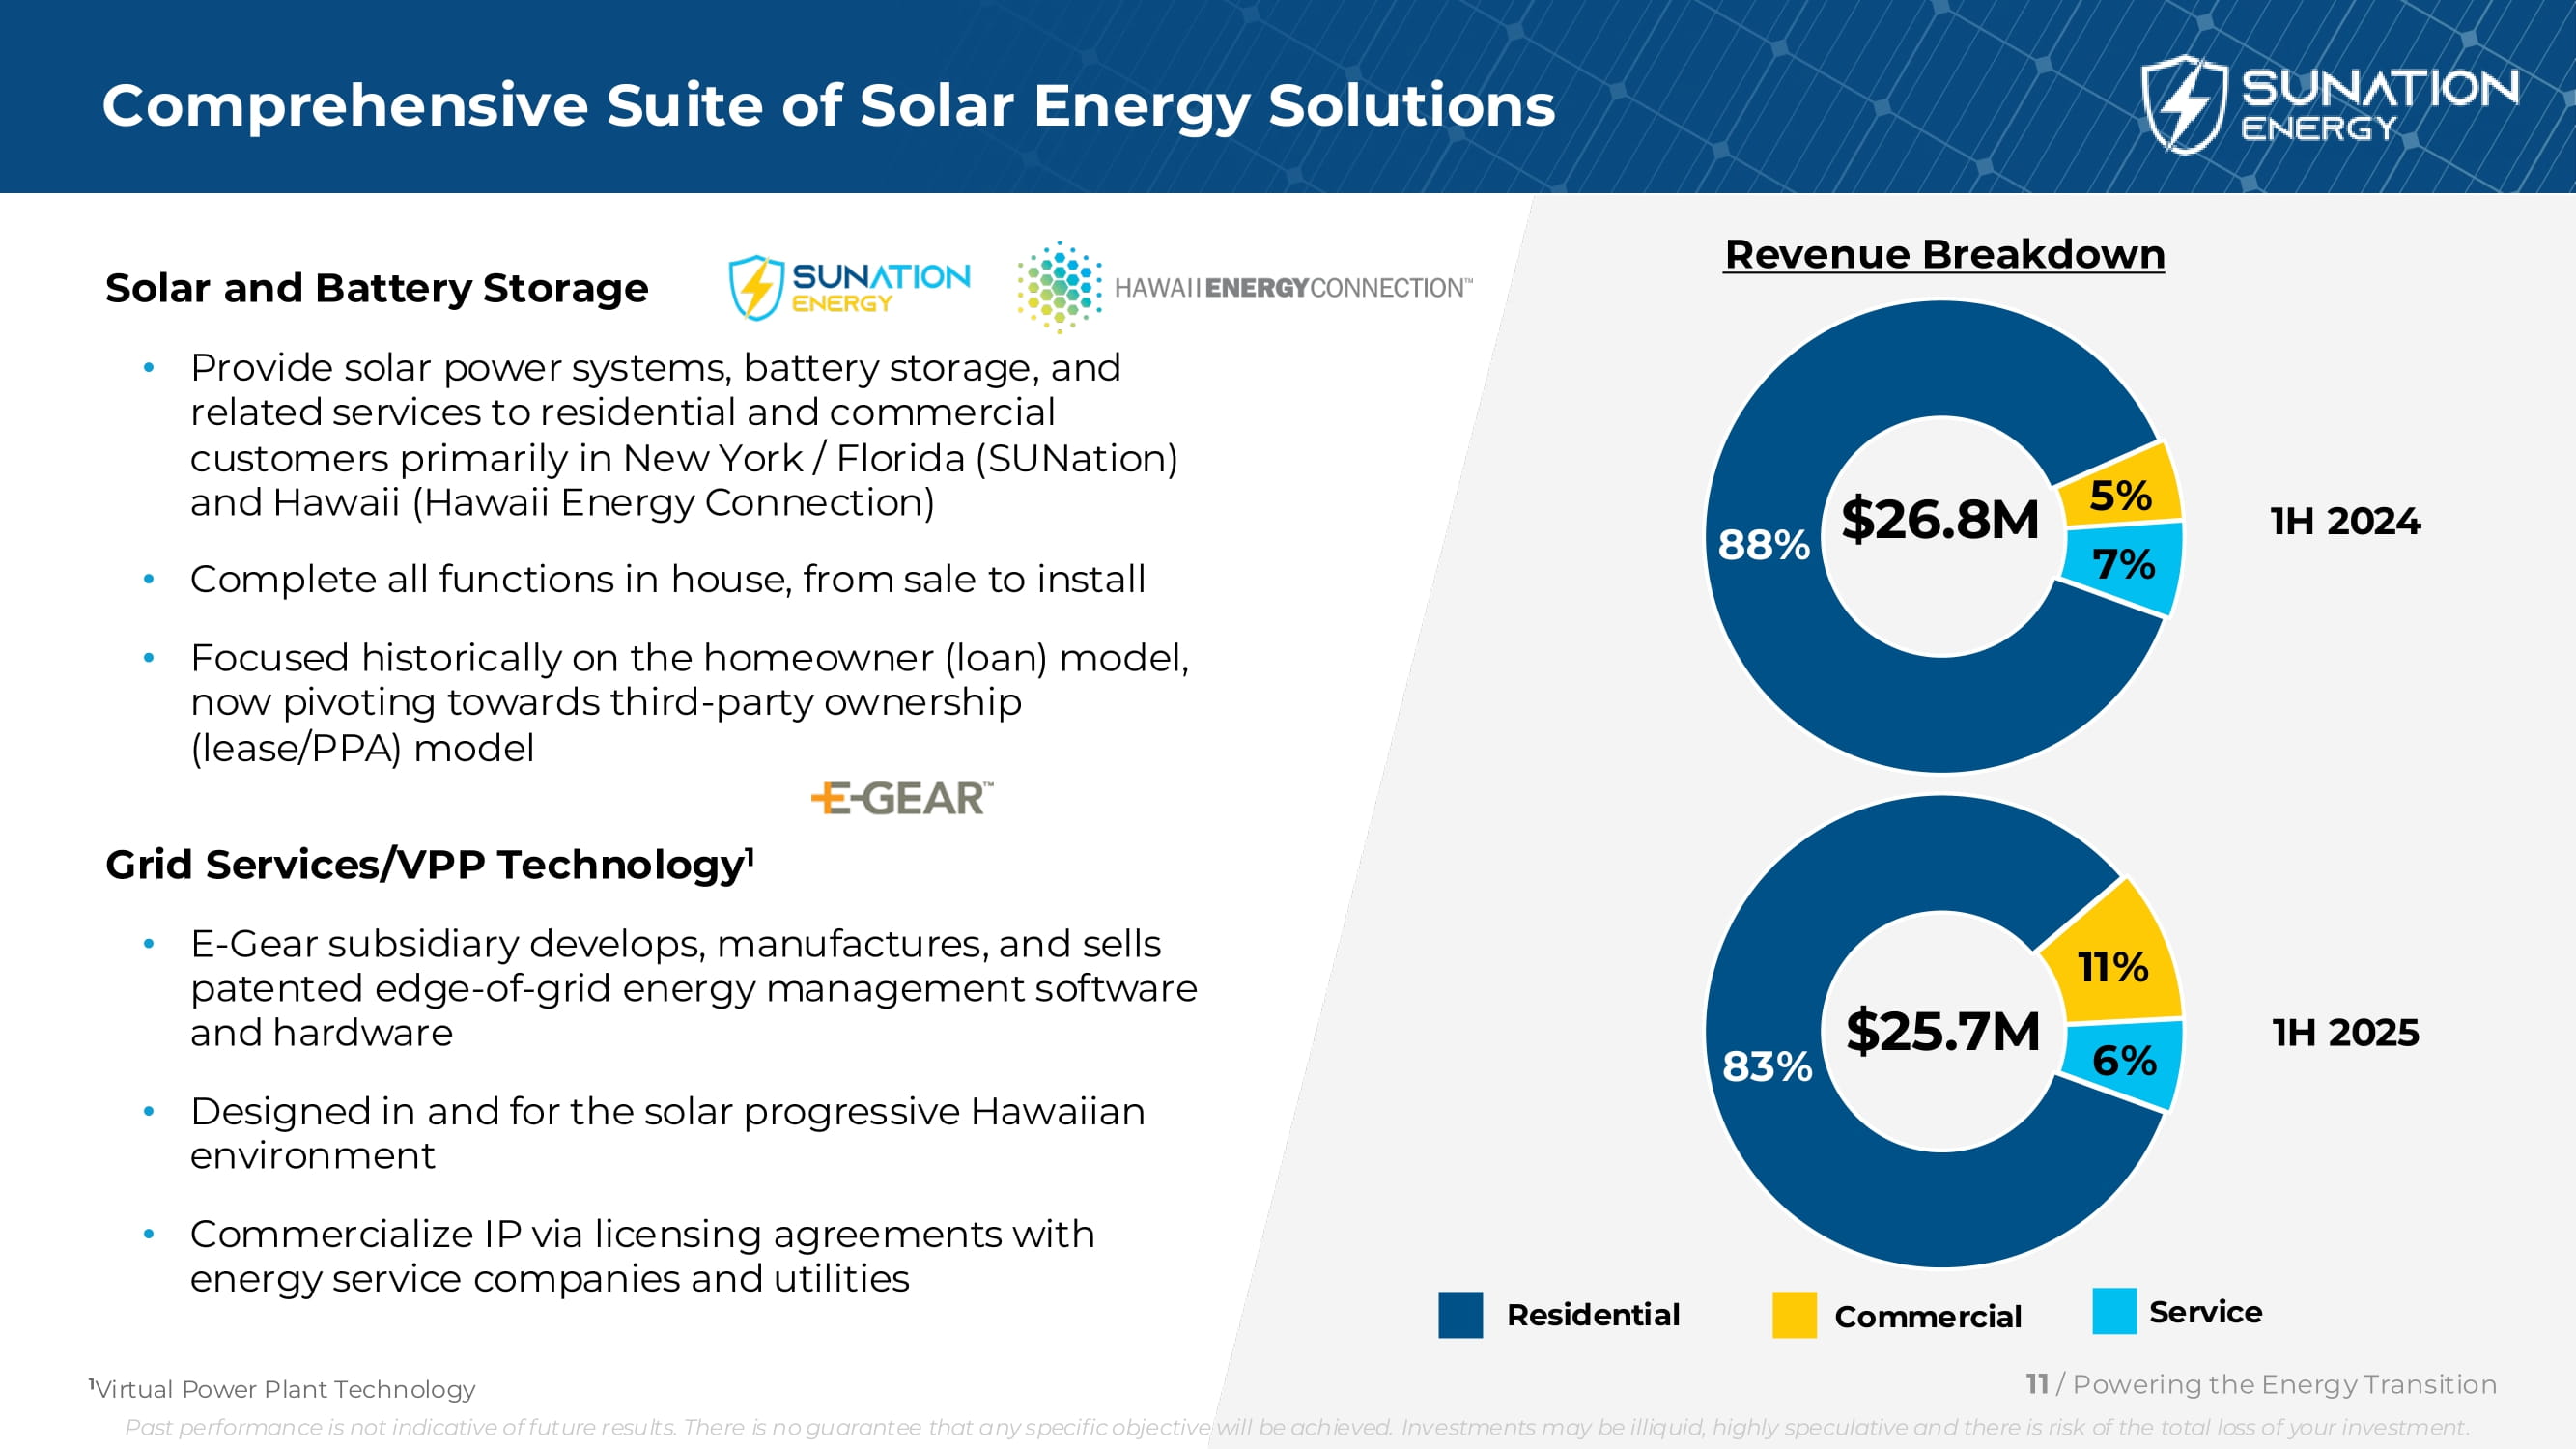
Solar and Battery Storage • Provide solar power systems, battery storage, and related services to residential and commercial customers primarily in New York / Florida (SUNation) and Hawaii (Hawaii Energy Connection) • Complete all functions in house, from sale to install • Focused historically on the homeowner (loan) model, now pivoting towards third - party ownership (lease/PPA) model Grid Services/VPP Technology 1 • E - Gear subsidiary develops, manufactures, and sells patented edge - of - grid energy management software and hardware • Designed in and for the solar progressive Hawaiian environment • Commercialize IP via licensing agreements with energy service companies and utilities Comprehensive Suite of Solar Energy Solutions Residential Commercial Service Revenue Breakdown 5% 7% 88% $26.8M 1H 2024 1H 2025 83% 11 / Powering the Energy Transition 1 Virtual Power Plant Technology Past performance is not indicative of future results. There is no guarantee that any specific objective will be achieved. Investments may be illiquid, highly speculative and there is risk of the total loss of your investment. 11% 6% $25.7M
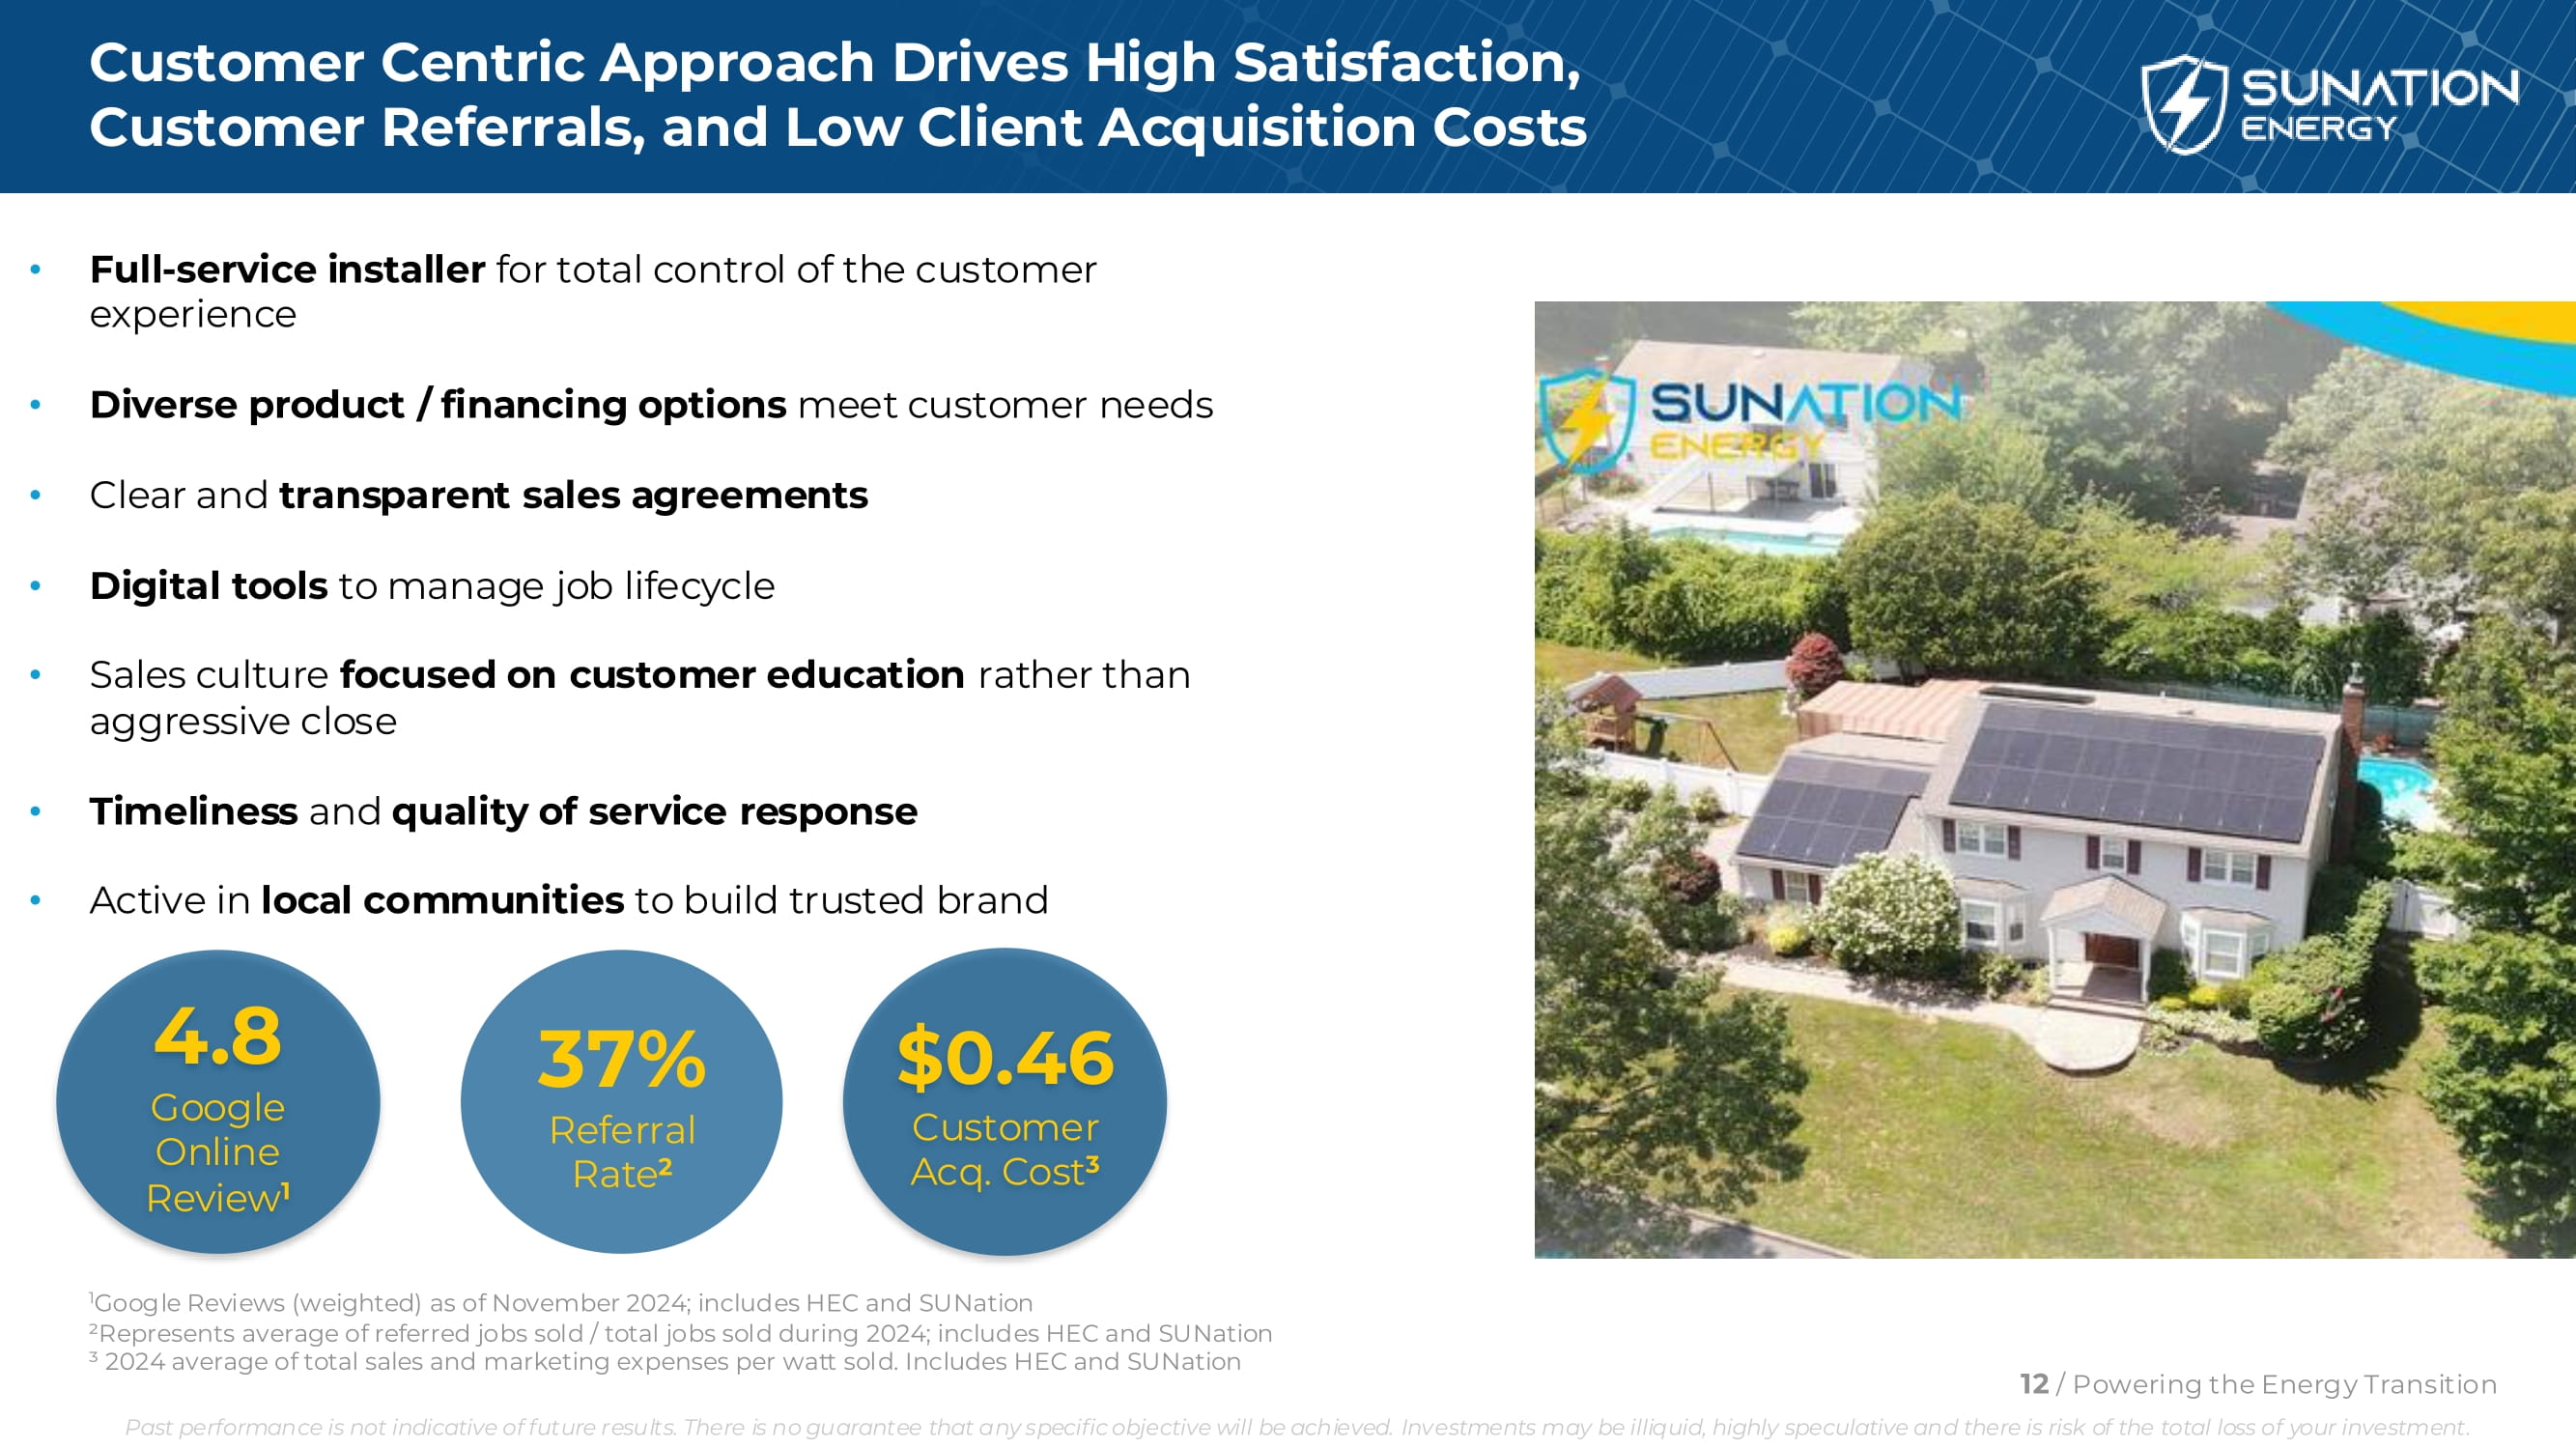
Customer Centric Approach Drives High Satisfaction, Customer Referrals, and Low Client Acquisition Costs • Full - service installer for total control of the customer experience • Diverse product / financing options meet customer needs • Clear and transparent sales agreements • Digital tools to manage job lifecycle • Sales culture focused on customer education rather than aggressive close • Timeliness and quality of service response • Active in local communities to build trusted brand 4.8 Google Online Review 1 37% Referral Rate 2 $0.46 Customer Acq. Cost 3 1 Google Reviews (weighted) as of November 2024; includes HEC and SUNation ²Represents average of referred jobs sold / total jobs sold during 2024; includes HEC and SUNation ³ 2024 average of total sales and marketing expenses per watt sold. Includes HEC and SUNation 12 / Powering the Energy Transition Past performance is not indicative of future results. There is no guarantee that any specific objective will be achieved. Investments may be illiquid, highly speculative and there is risk of the total loss of your investment.
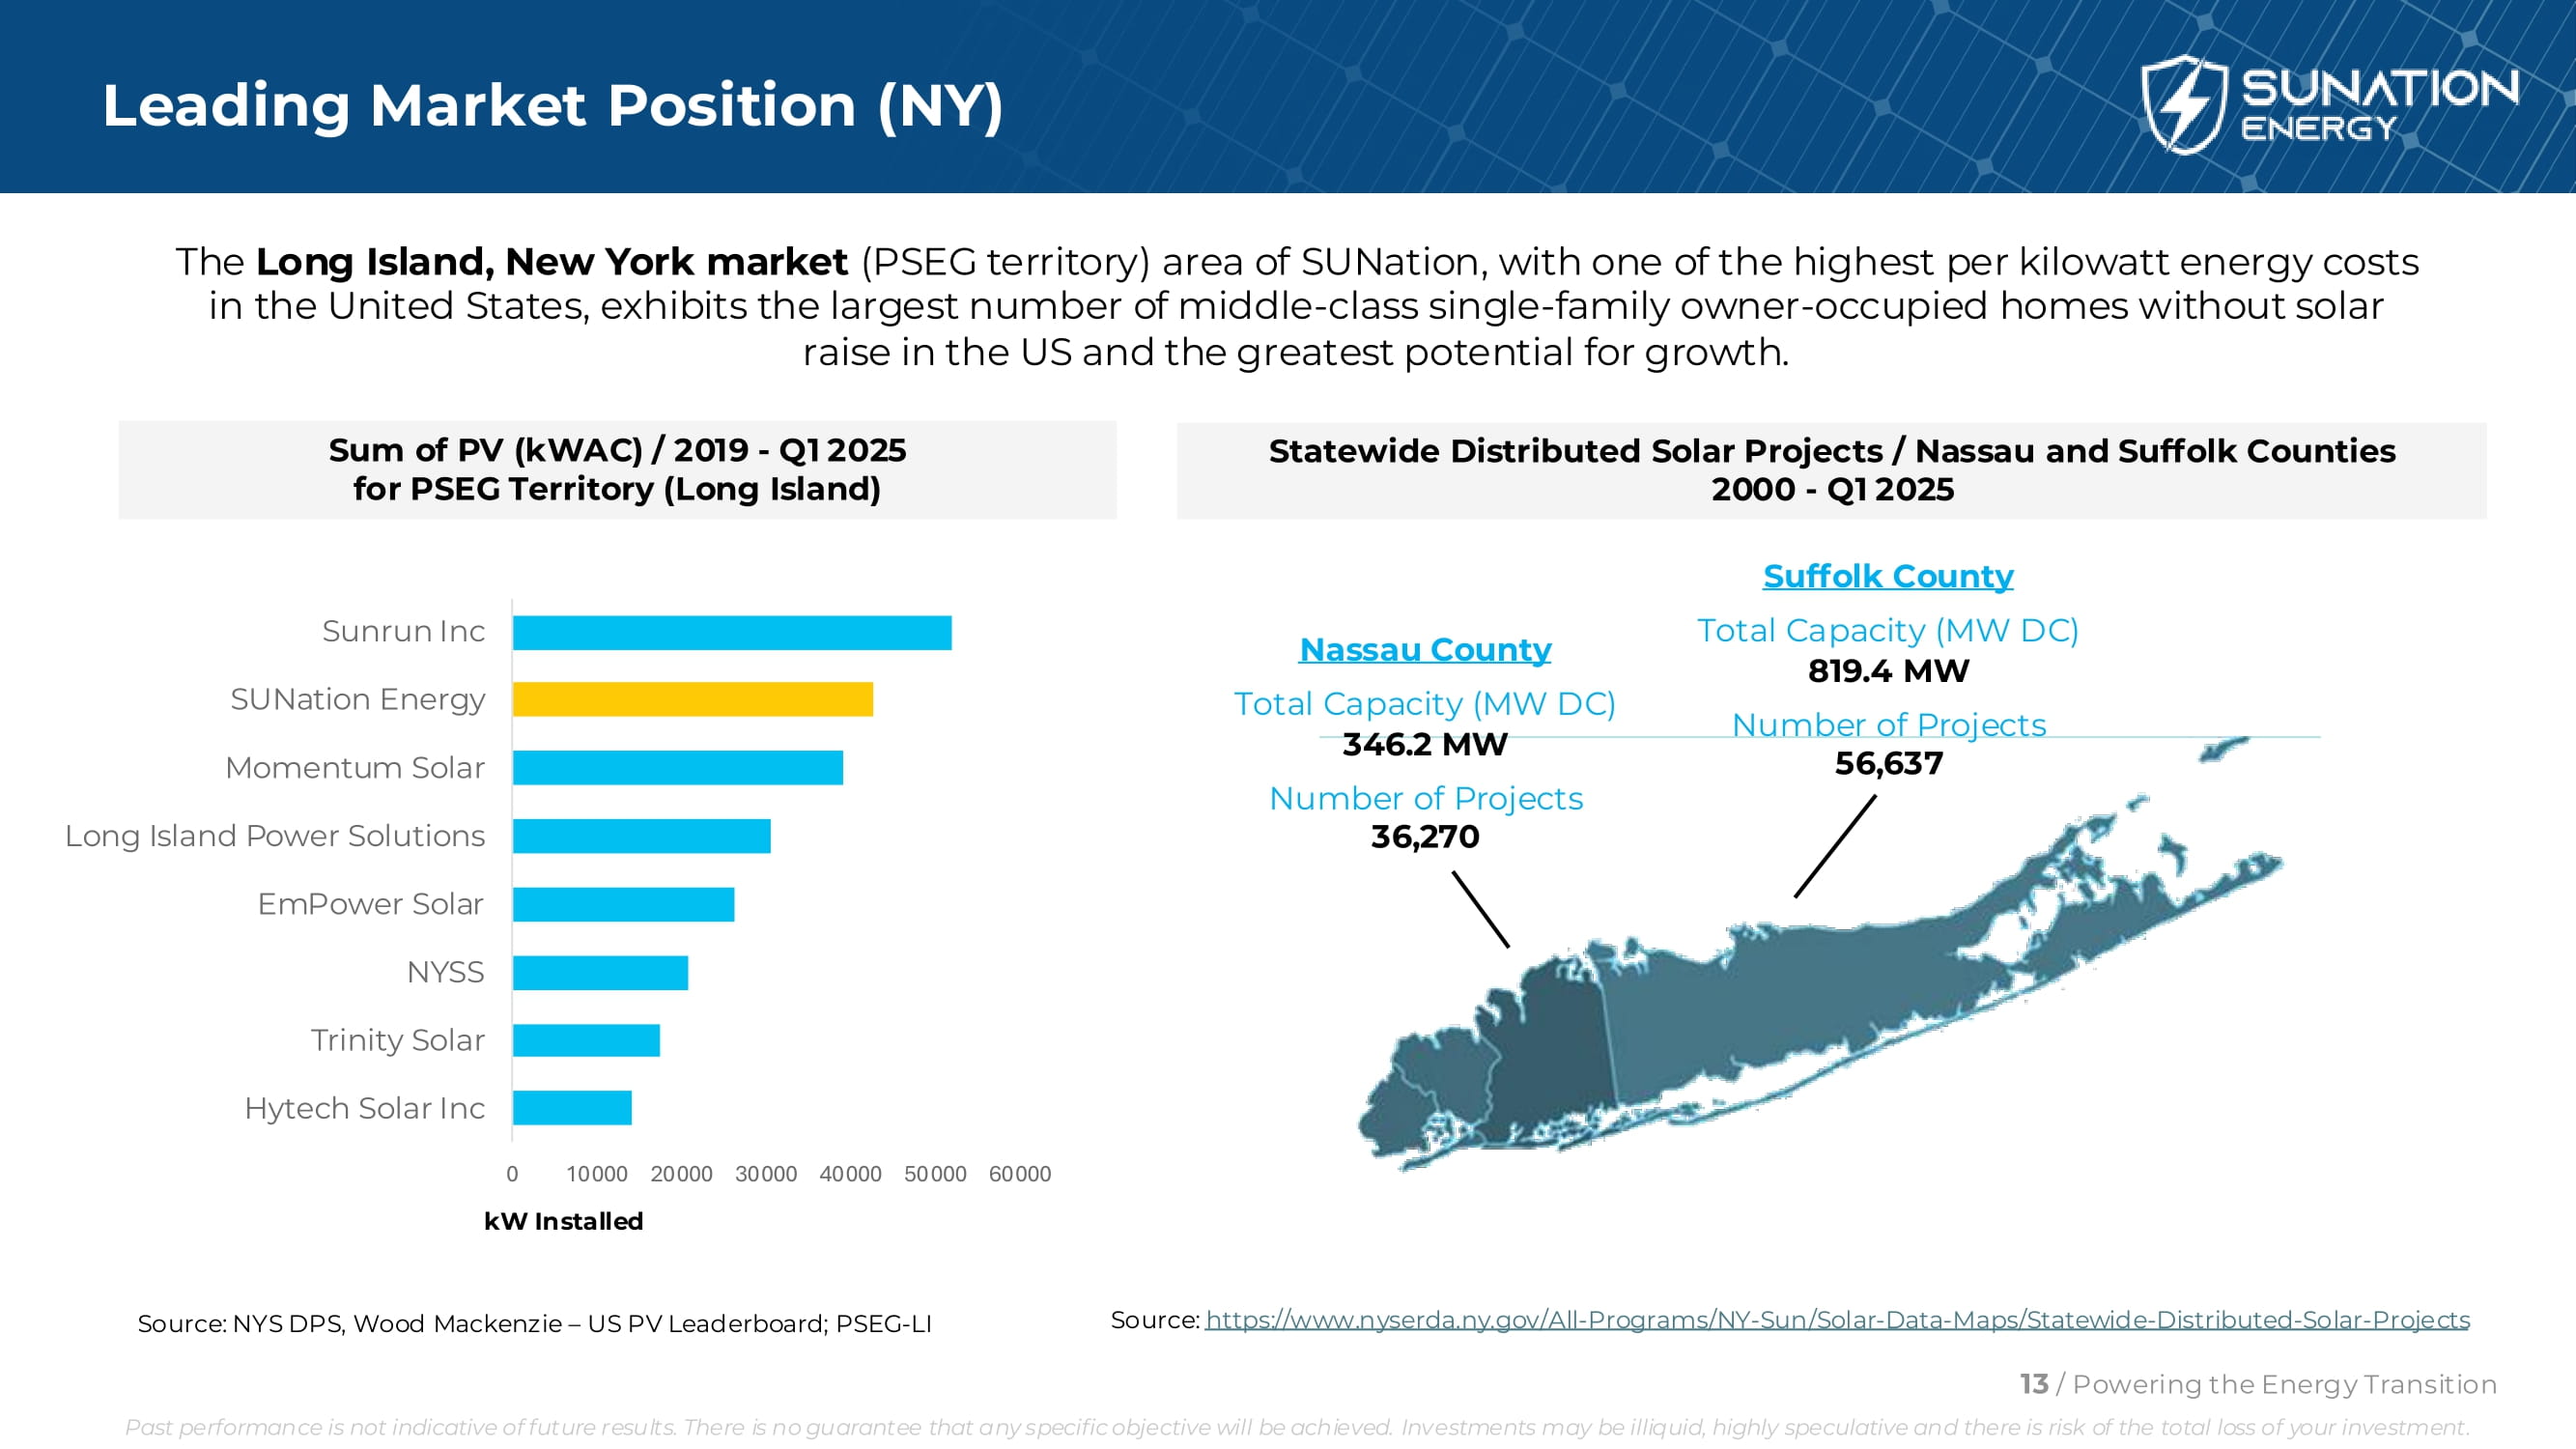
Leading Market Position (NY) The Long Island, New York market (PSEG territory) area of SUNation, with one of the highest per kilowatt energy costs in the United States, exhibits the largest number of middle - class single - family owner - occupied homes without solar raise in the US and the greatest potential for growth. EmPower Solar NYSS Trinity Solar Hytech Solar Inc 0 10000 20000 30000 40000 50000 60000 kW Installed SUNation Energy Momentum Solar Long Island Power Solutions Sunrun Inc Sum of PV (kWAC) / 2019 - Q1 2025 for PSEG Territory (Long Island) Source: NYS DPS, Wood Mackenzie – US PV Leaderboard; PSEG - LI Suffolk County Total Capacity (MW DC) 819.4 MW Number of Projects 56,637 Nassau County Total Capacity (MW DC) 346.2 MW Number of Projects 36,270 Past performance is not indicative of future results. There is no guarantee that any specific objective will be achieved. Investments may be illiquid, highly speculative and there is risk of the total loss of your investment. Statewide Distributed Solar Projects / Nassau and Suffolk Counties 2000 - Q1 2025 Source: https://www.nyserda.ny.gov/Al l - Programs/NY - Sun/Solar - Data - Maps/Statewide - Distributed - Solar - Projects 13 / Powering the Energy Transition
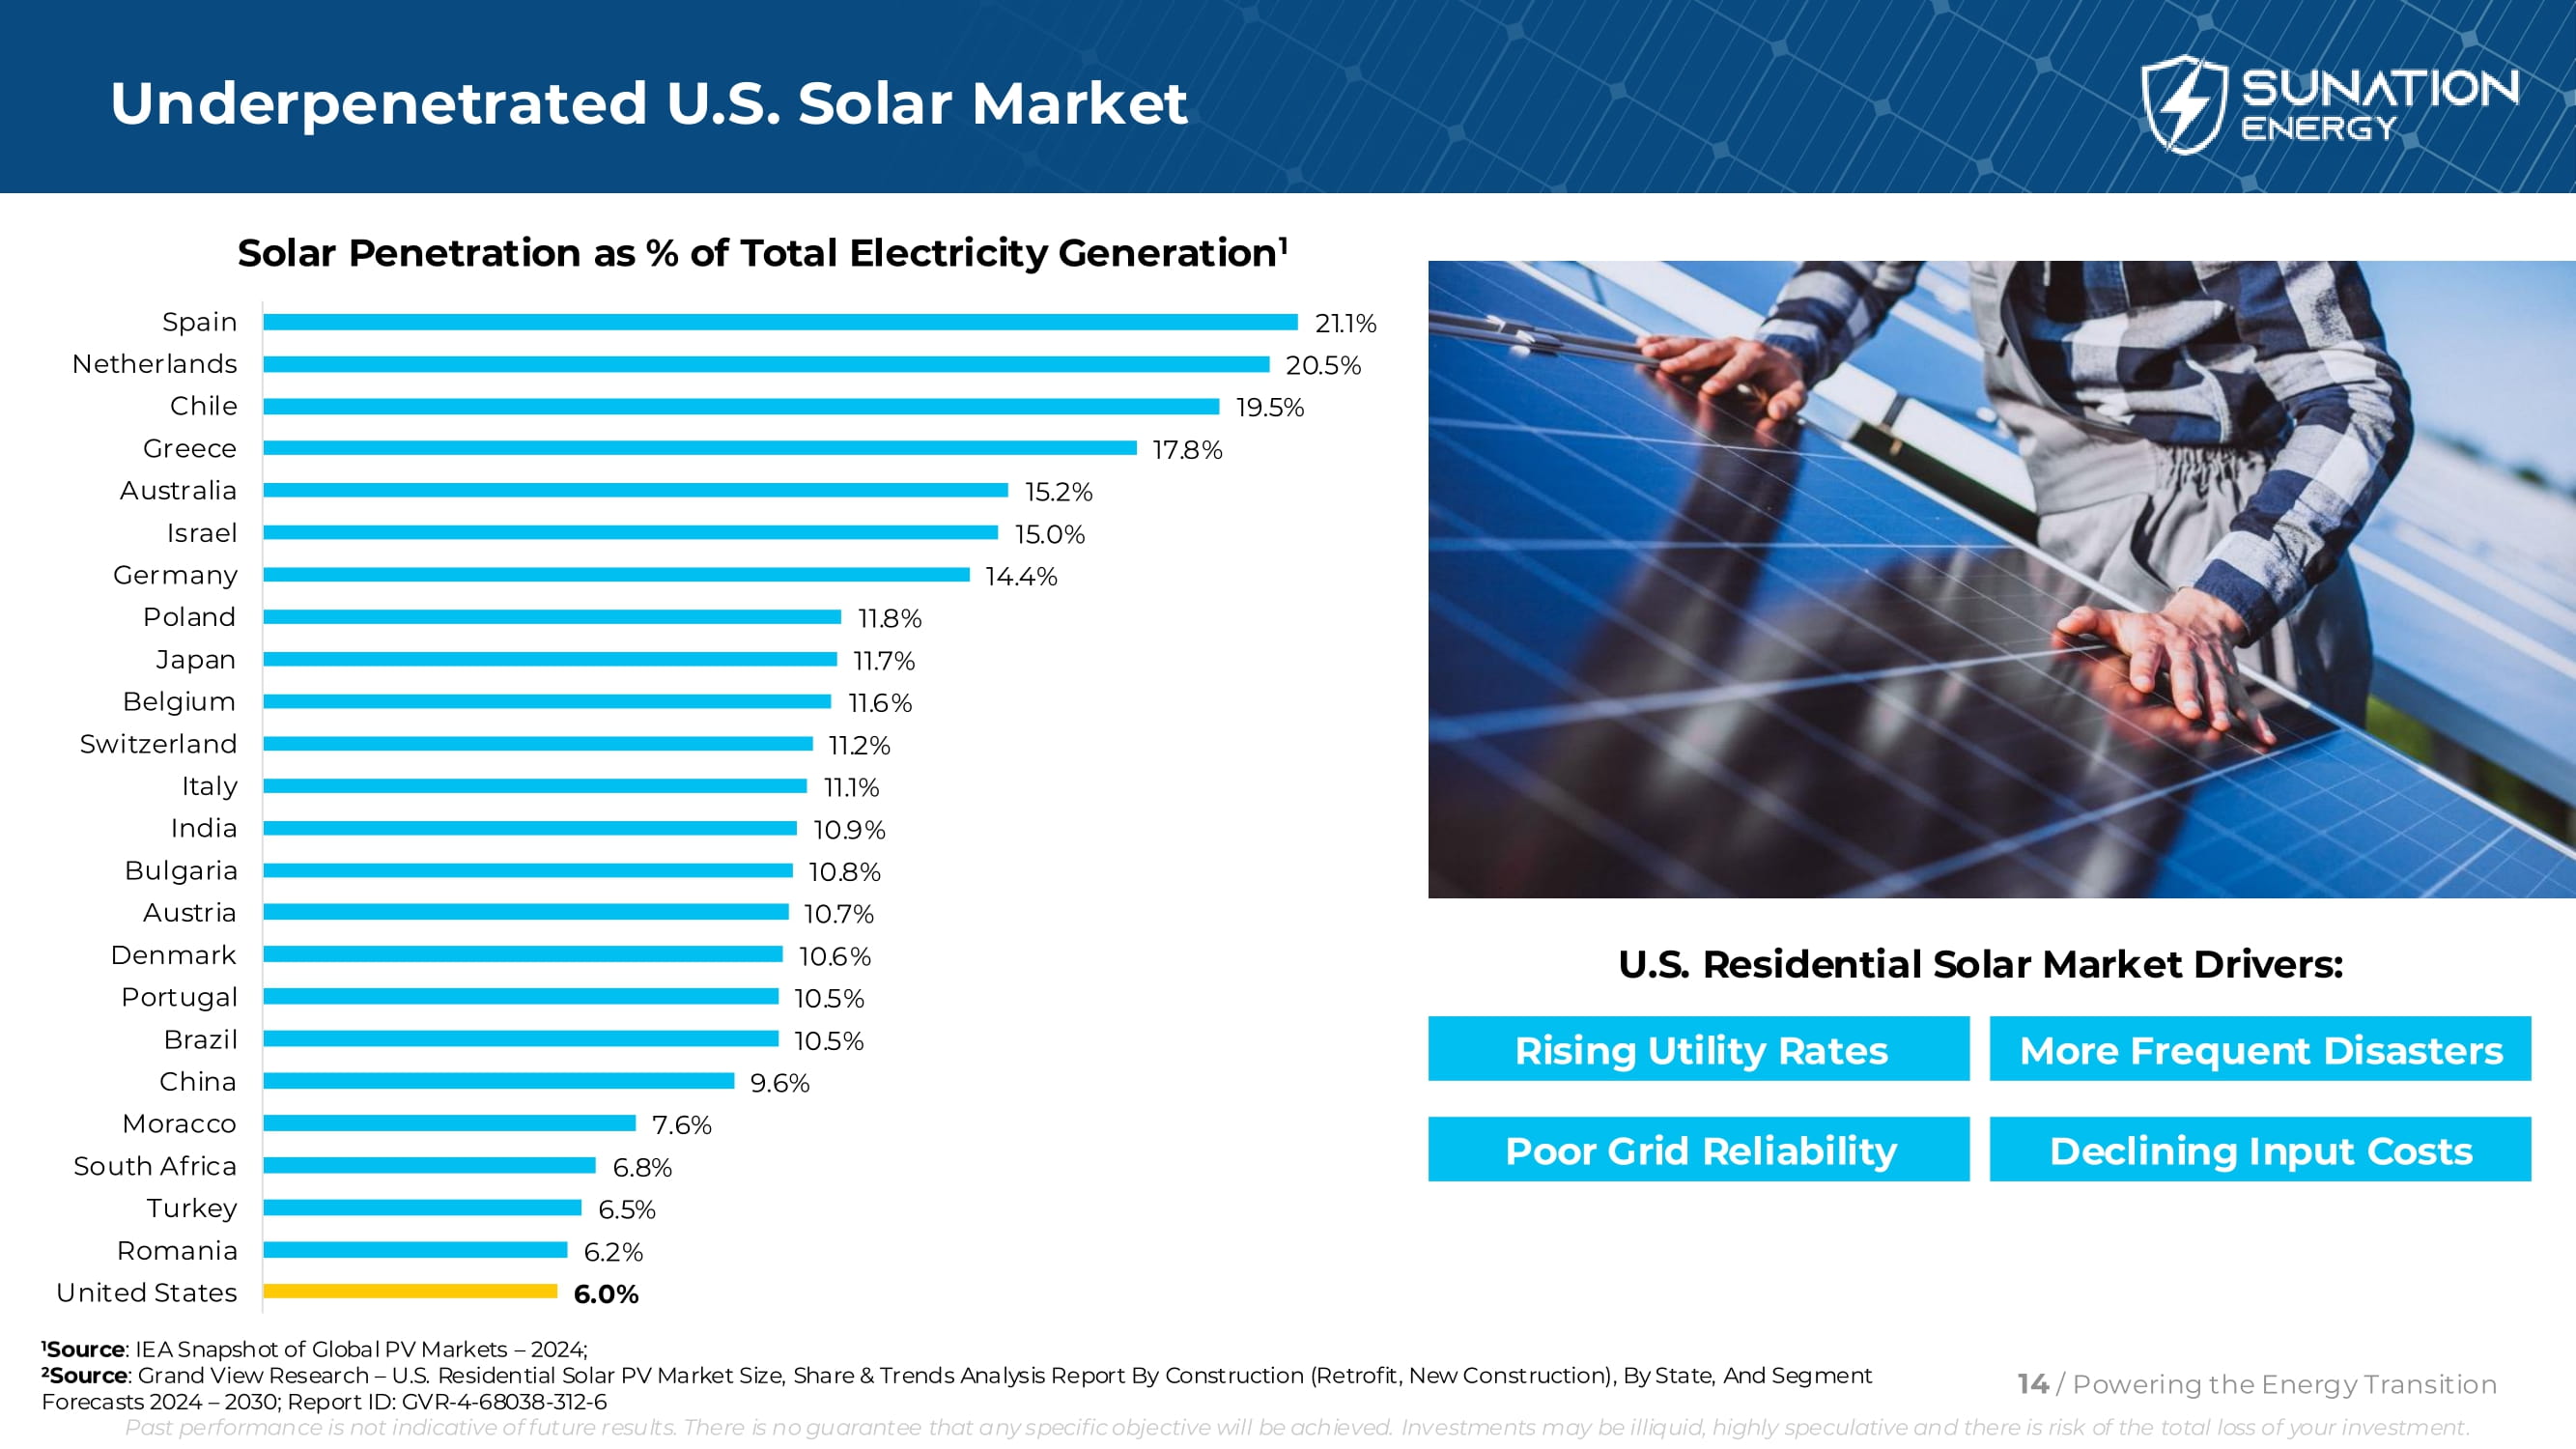
Underpenetrated U.S. Solar Market 6.0% 6.2% 6.5% 6.8% 7.6% 9.6% 10.6% 10.5% 10.5% 10.9% 10.8% 10.7% 11.2% 11.1% 11.6% 11.8% 11.7% 14.4% 15.0% 15.2% 17.8% 19.5% 20.5% 21.1% Spain Netherlands Chile Greece Australia Israel Germany Poland Japan Belgium Switzerland Italy India Bulgaria Austria Denmark Portugal Brazil China Moracco South Africa Turkey Romania United States 1 Source : IEA Snapshot of Global PV Markets – 2024; 2 Source : Grand View Research – U.S. Residential Solar PV Market Size, Share & Trends Analysis Report By Construction (Retrofit, New Construction), By State, And Segment Forecasts 2024 – 2030; Report ID: GVR - 4 - 68038 - 312 - 6 Solar Penetration as % of Total Electricity Generation 1 U.S. Residential Solar Market Drivers: Rising Utility Rates Poor Grid Reliability More Frequent Disasters Declining Input Costs 14 / Powering the Energy Transition Past performance is not indicative of future results. There is no guarantee that any specific objective will be achieved. Investments may be illiquid, highly speculative and there is risk of the total loss of your investment.
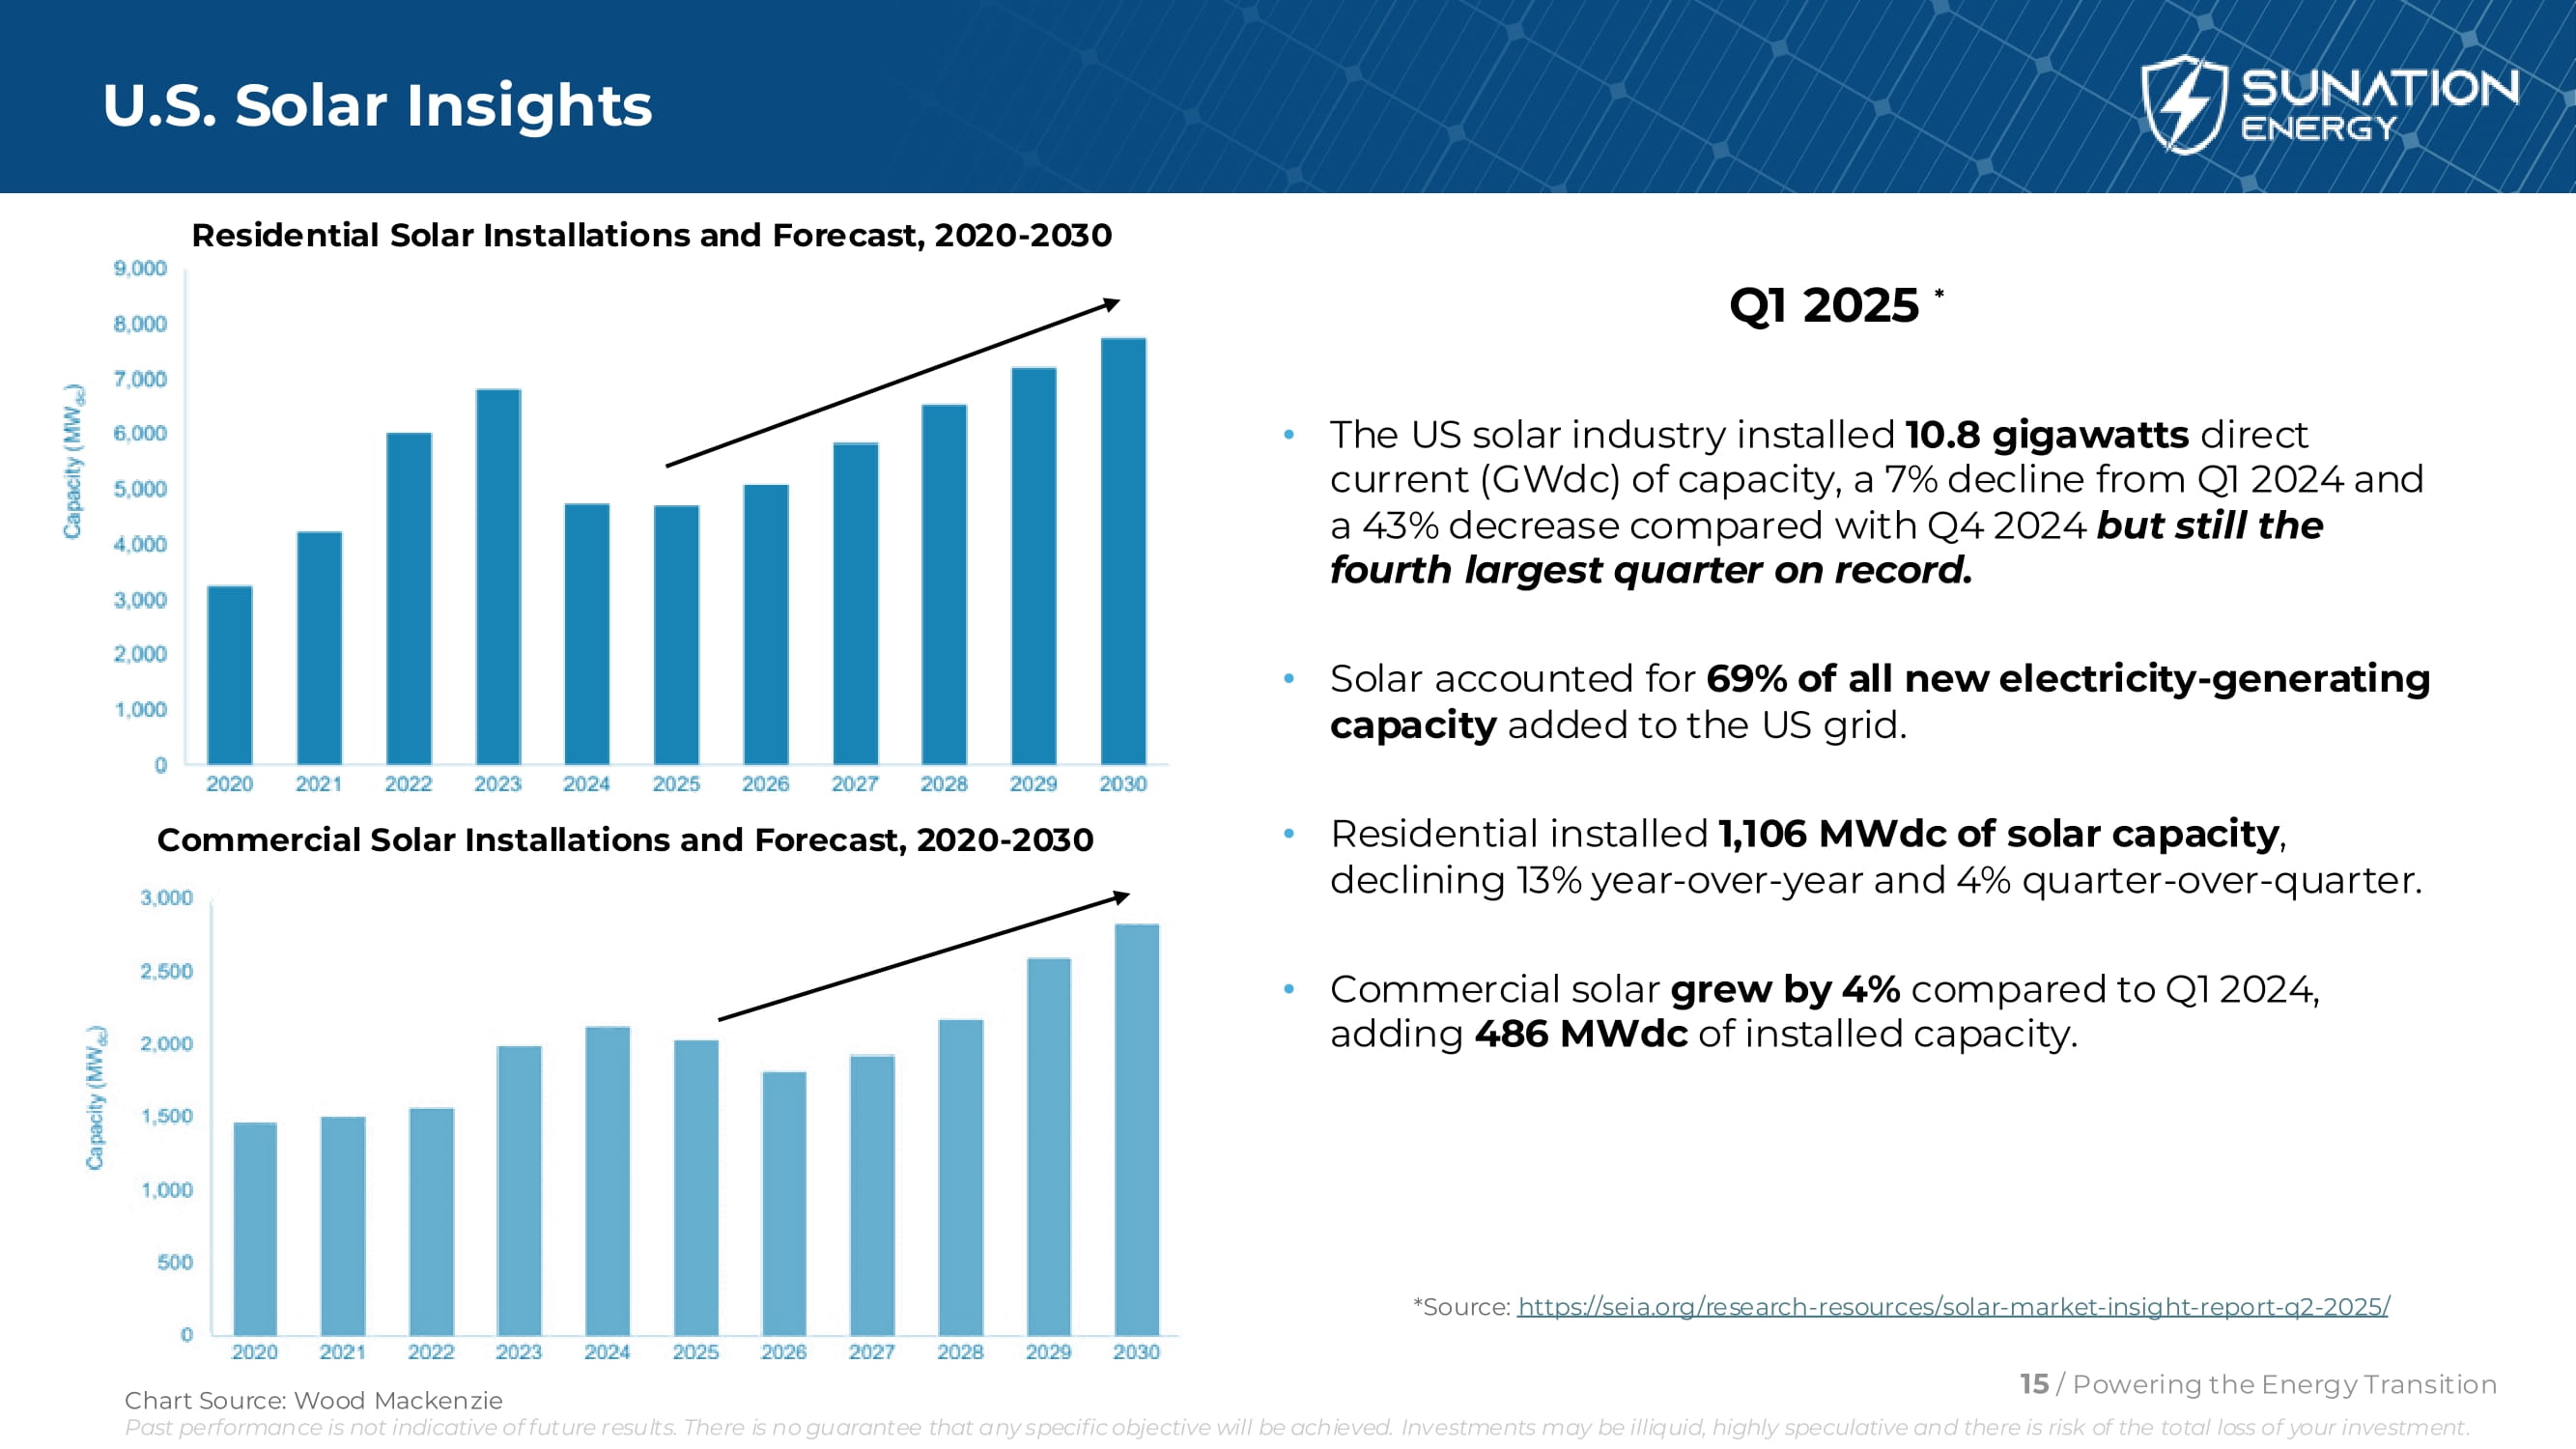
U.S. Solar Insights Q1 2025 * • The US solar industry installed 10.8 gigawatts direct current (GWdc) of capacity, a 7% decline from Q1 2024 and a 43% decrease compared with Q4 2024 but still the fourth largest quarter on record. • Solar accounted for 69% of all new electricity - generating capacity added to the US grid. • Residential installed 1,106 MWdc of solar capacity , declining 13% year - over - year and 4% quarter - over - quarter. • Commercial solar grew by 4% compared to Q1 2024, adding 486 MWdc of installed capacity. *Source: https://seia.org/research - resources/solar - market - insight - report - q2 - 2025/ 15 / Powering the Energy Transition Residential Solar Installations and Forecast, 2020 - 2030 Past performance is not indicative of future results. There is no guarantee that any specific objective will be achieved. Investments may be illiquid, highly speculative and there is risk of the total loss of your investment. Commercial Solar Installations and Forecast, 2020 - 2030 Chart Source: Wood Mackenzie
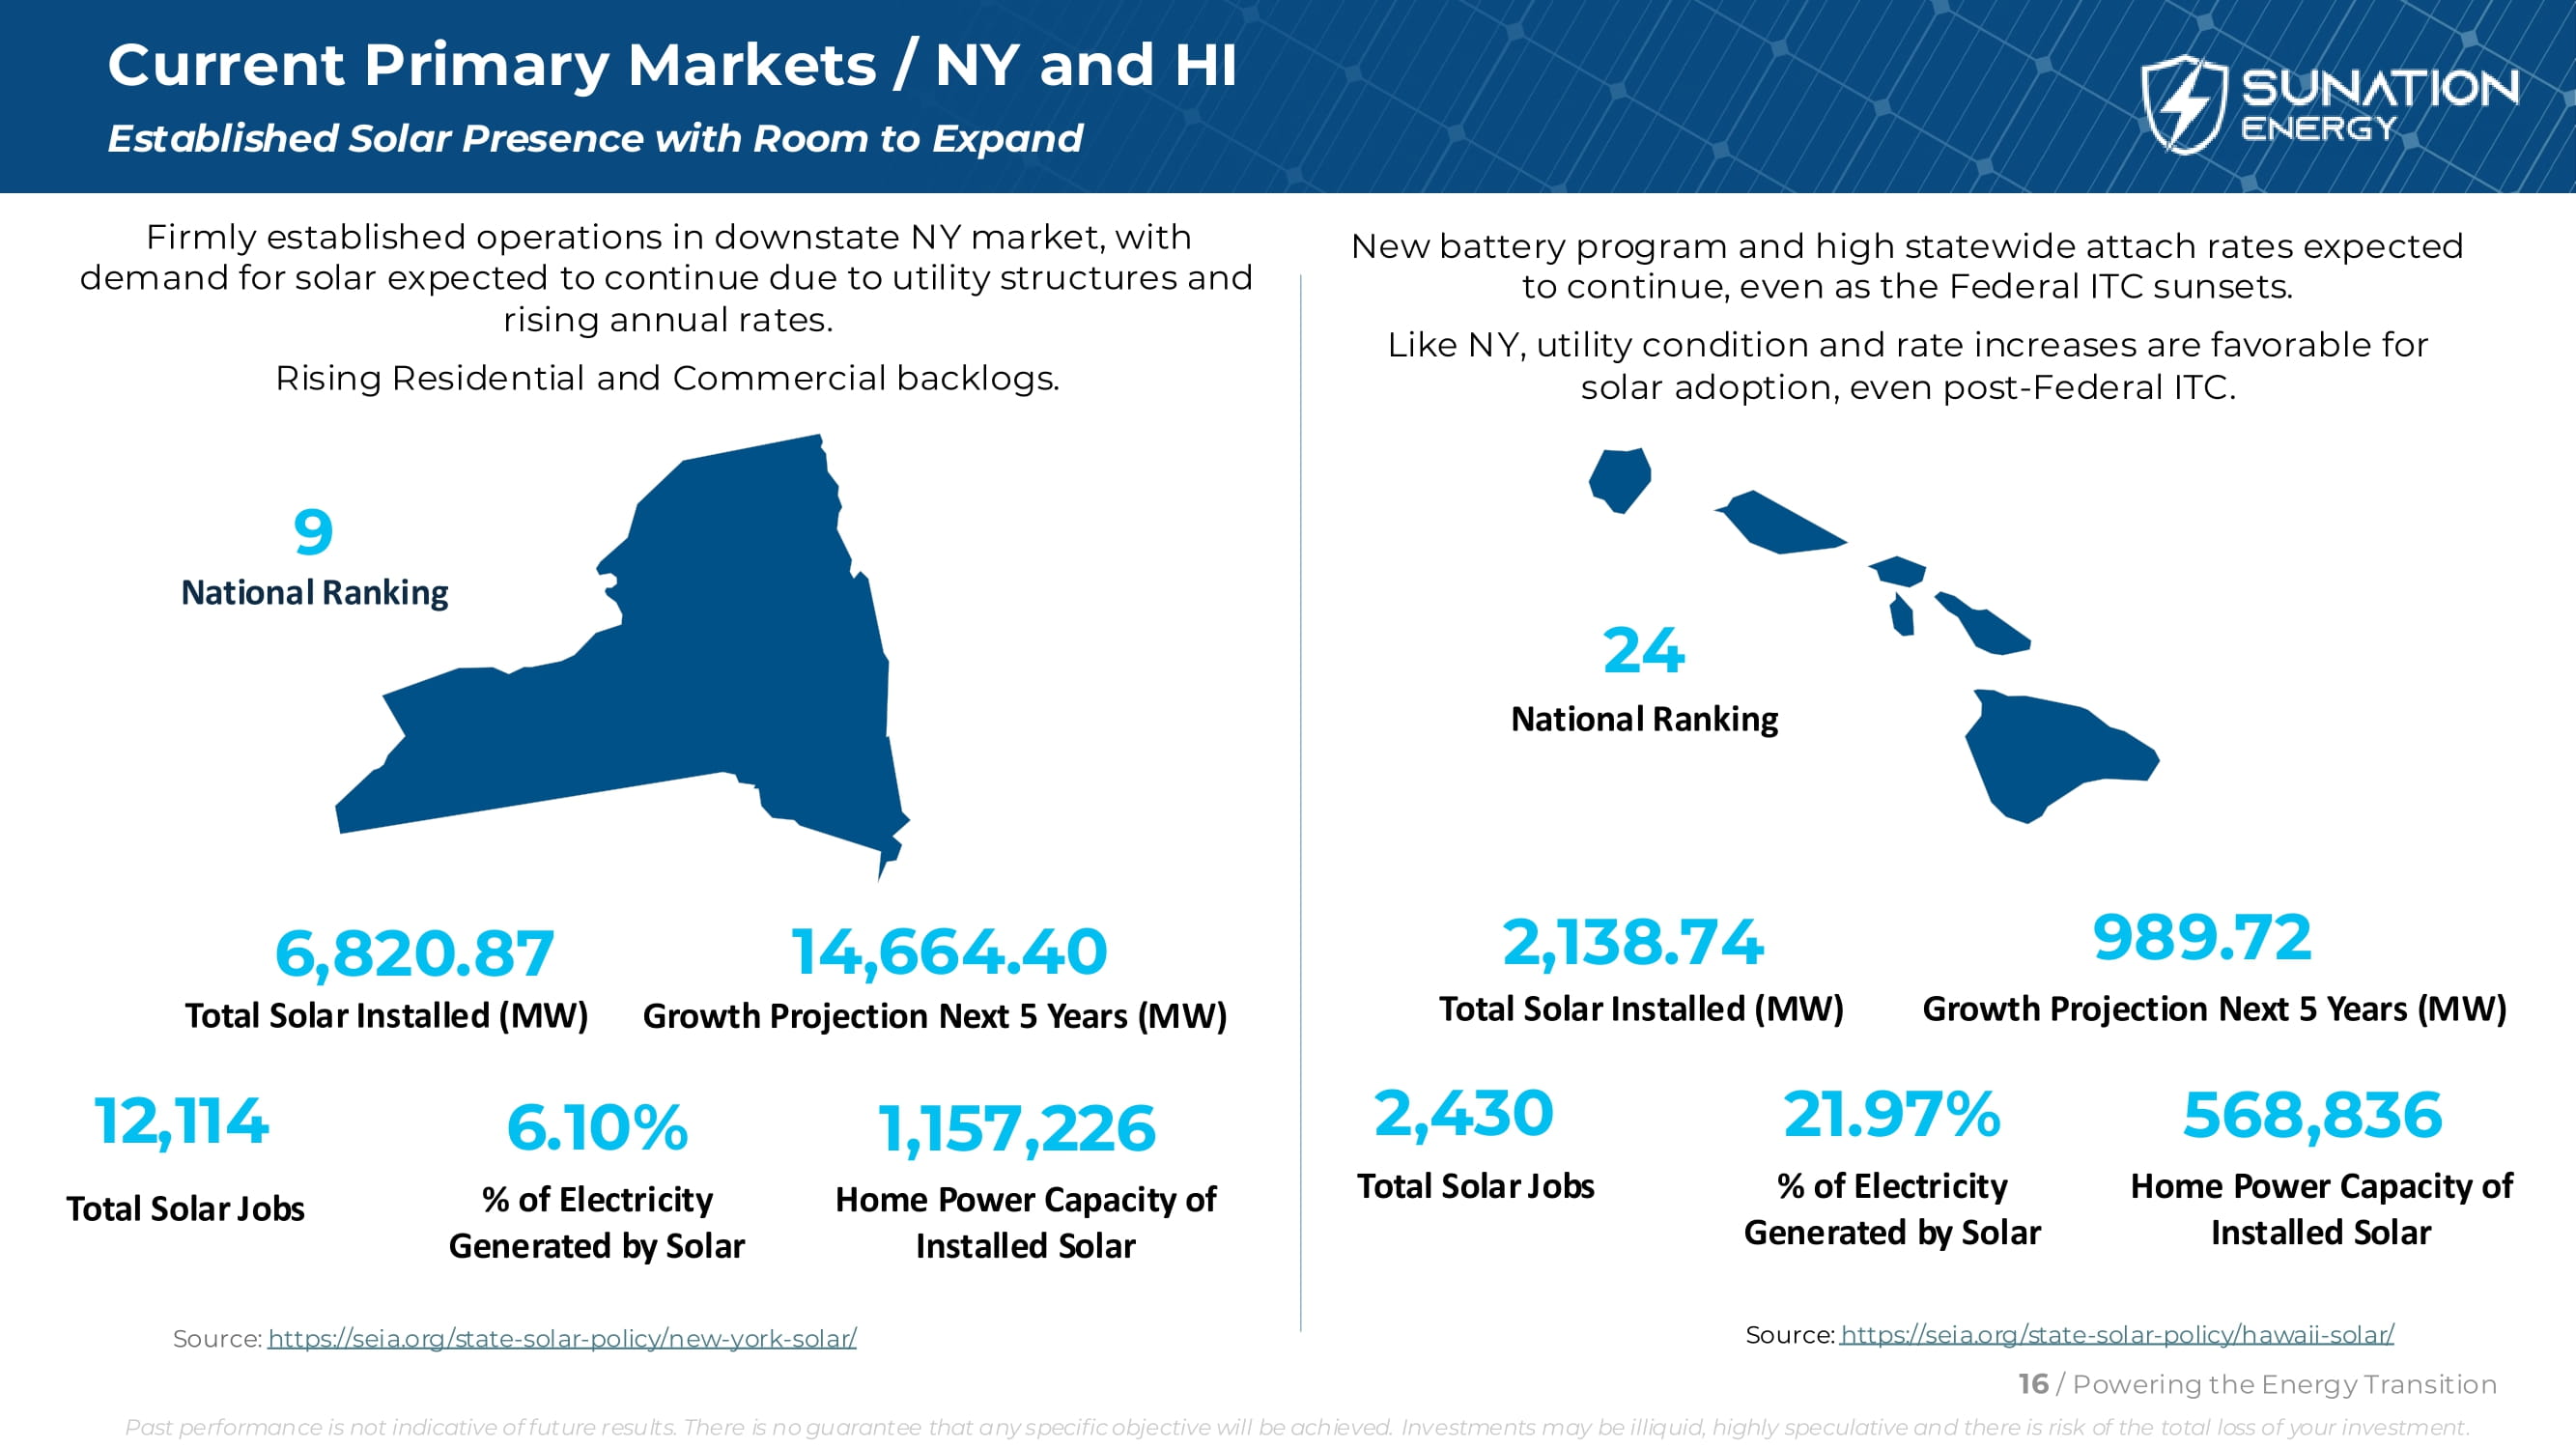
Current Primary Markets / NY and HI Established Solar Presence with Room to Expand Source: https://seia.org/state - solar - policy/new - york - solar/ 9 National Ranking 6,820.87 Total Solar Installed (MW) 12,114 Total Solar Jobs 6.10% % of Electricity Generated by Solar 1,157,226 Home Power Capacity of Installed Solar 24 National Ranking 2,138.74 Total Solar Installed (MW) 2,430 Total Solar Jobs 21.97% % of Electricity Generated by Solar 568,836 Home Power Capacity of Installed Solar Source: https://seia.org/state - solar - policy/hawaii - solar/ Firmly established operations in downstate NY market, with demand for solar expected to continue due to utility structures and rising annual rates. Rising Residential and Commercial backlogs. 16 / Powering the Energy Transition Past performance is not indicative of future results. There is no guarantee that any specific objective will be achieved. Investments may be illiquid, highly speculative and there is risk of the total loss of your investment. New battery program and high statewide attach rates expected to continue, even as the Federal ITC sunsets. Like NY, utility condition and rate increases are favorable for solar adoption, even post - Federal ITC. 14,664.40 Growth Projection Next 5 Years (MW) 989.72 Growth Projection Next 5 Years (MW)
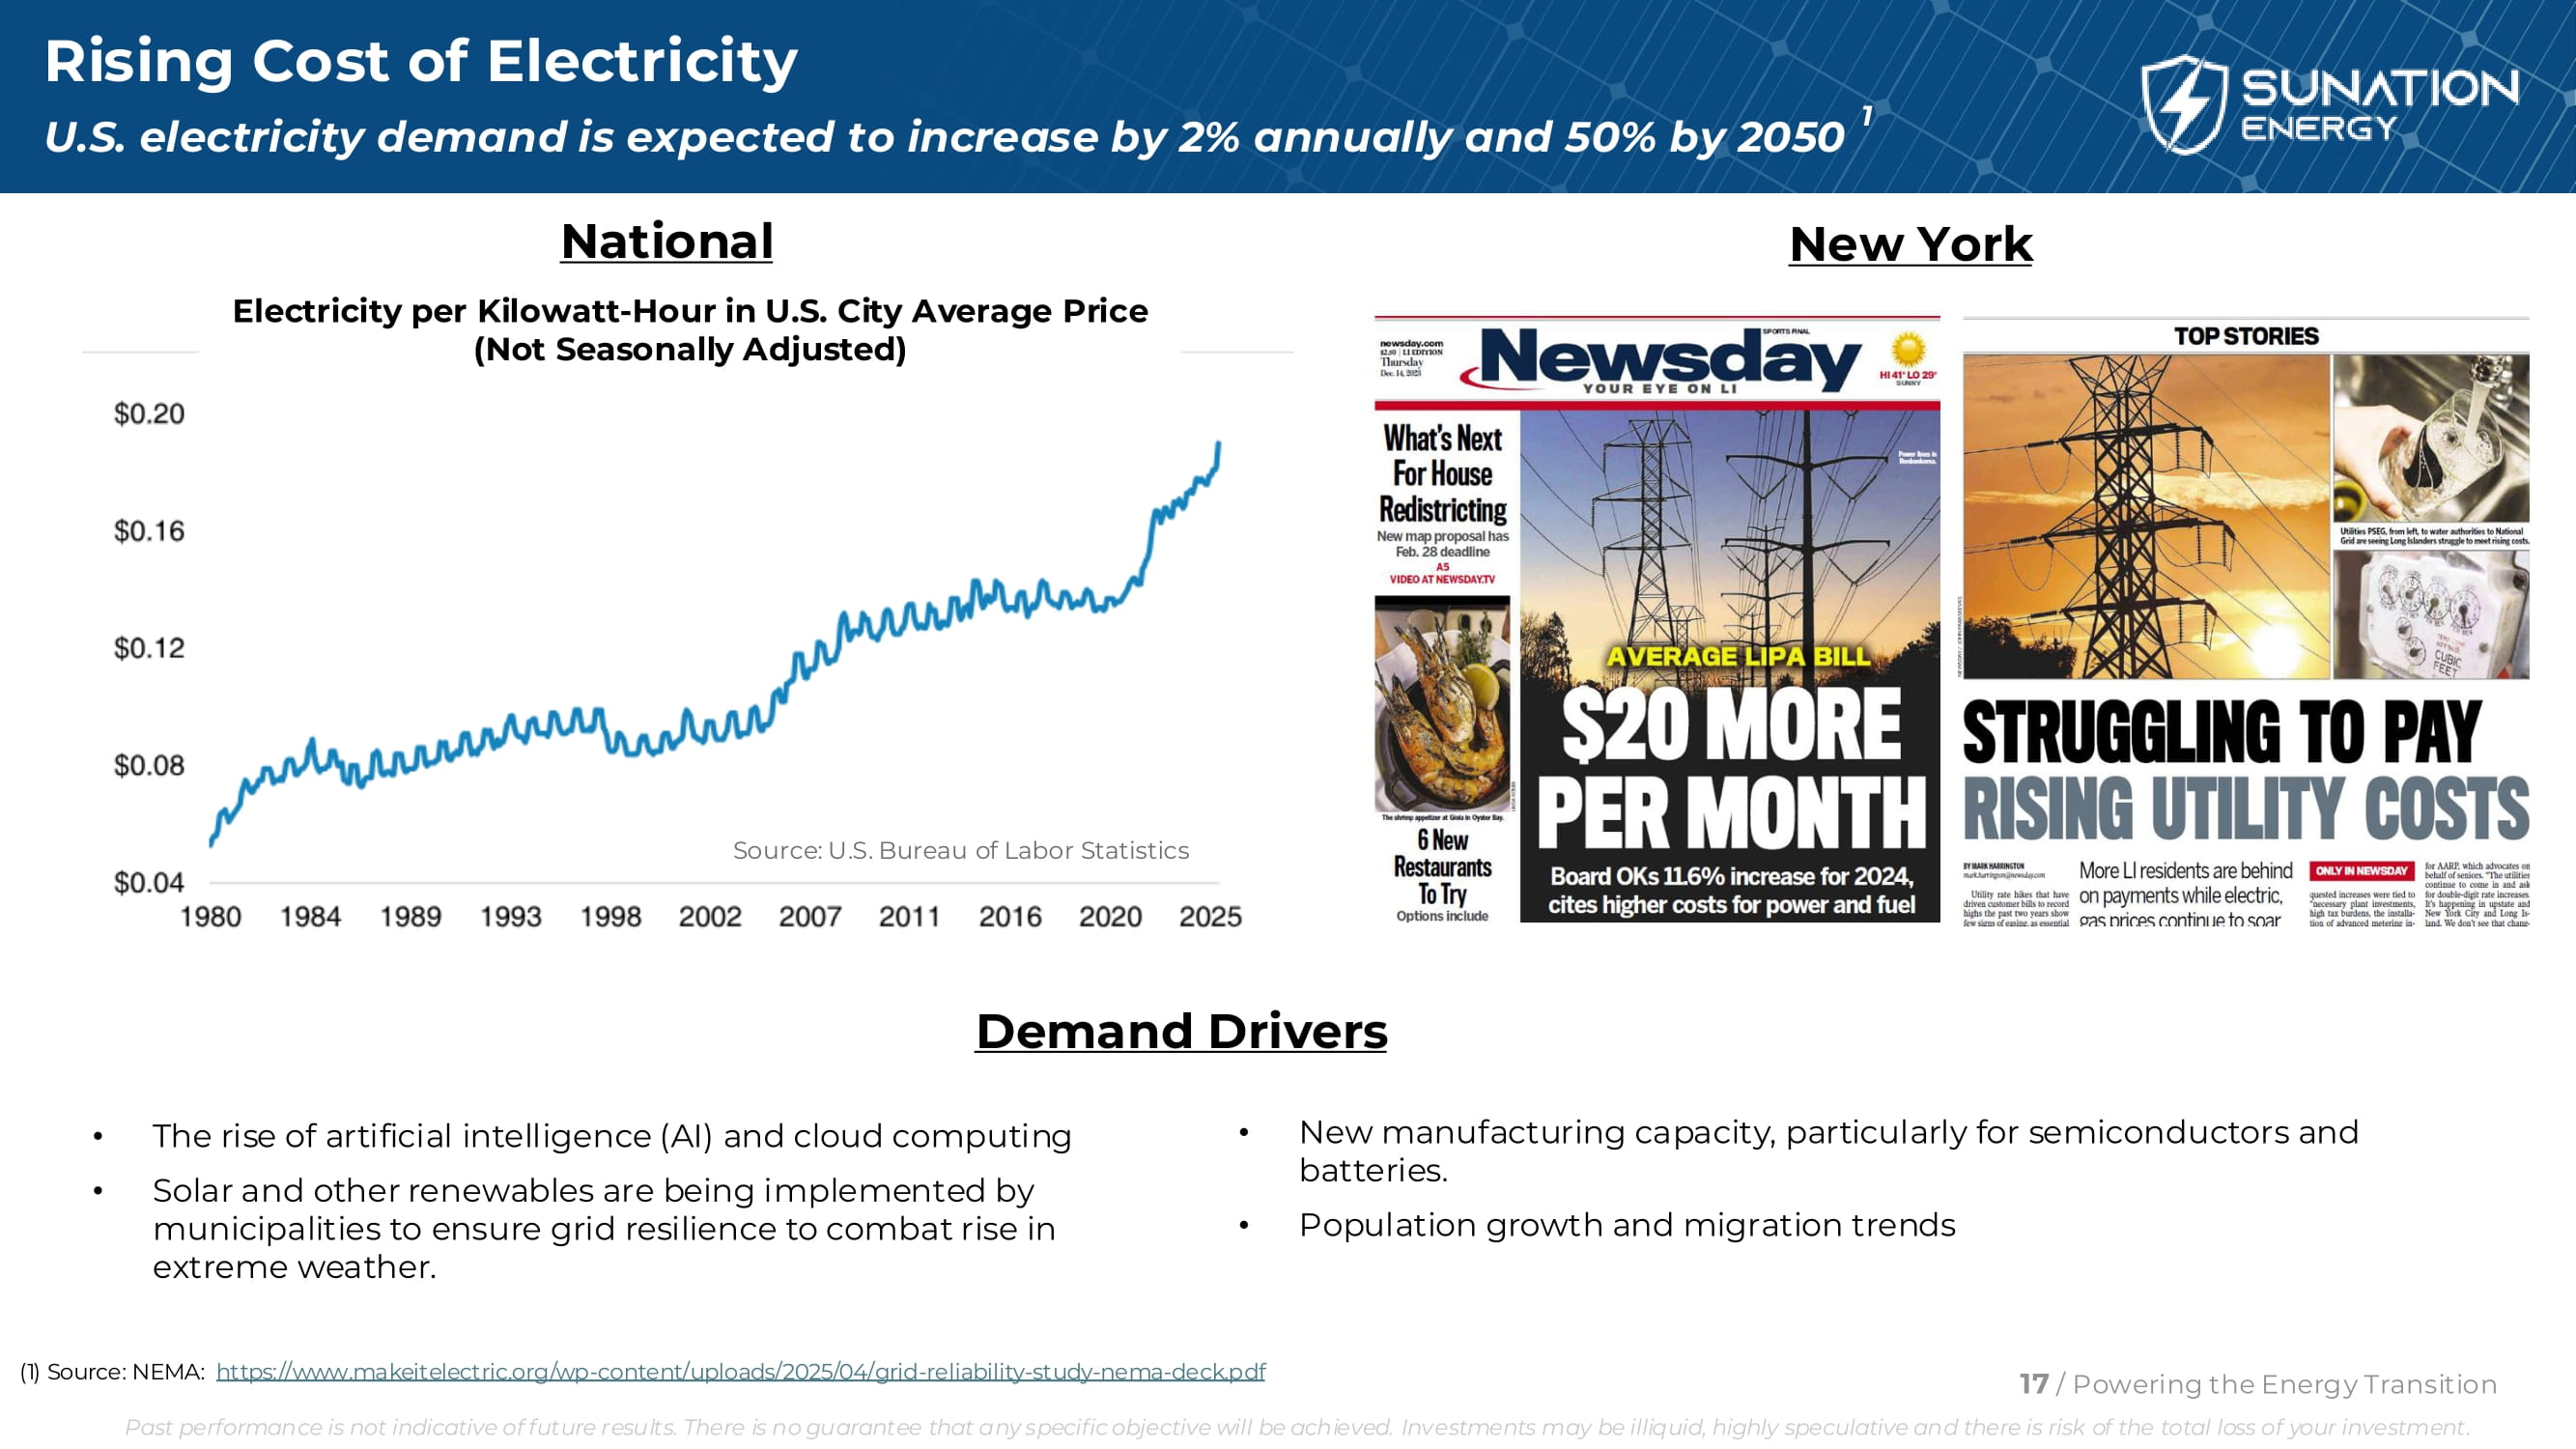
Rising Cost of Electricity U.S. electricity demand is expected to increase by 2% annually and 50% by 2050 1 • The rise of artificial intelligence (AI) and cloud computing • Solar and other renewables are being implemented by municipalities to ensure grid resilience to combat rise in extreme weather. Source: U.S. Bureau of Labor Statistics National Electricity per Kilowatt - Hour in U.S. City Average Price (Not Seasonally Adjusted) New York • New manufacturing capacity, particularly for semiconductors and batteries. • Population growth and migration trends (1) Source: NEMA: https://www.makeitelectric.org/wp - content/uploads/2025/04/grid - reliability - study - nema - deck.pdf 17 / Powering the Energy Transition Past performance is not indicative of future results. There is no guarantee that any specific objective will be achieved. Investments may be illiquid, highly speculative and there is risk of the total loss of your investment. Demand Drivers
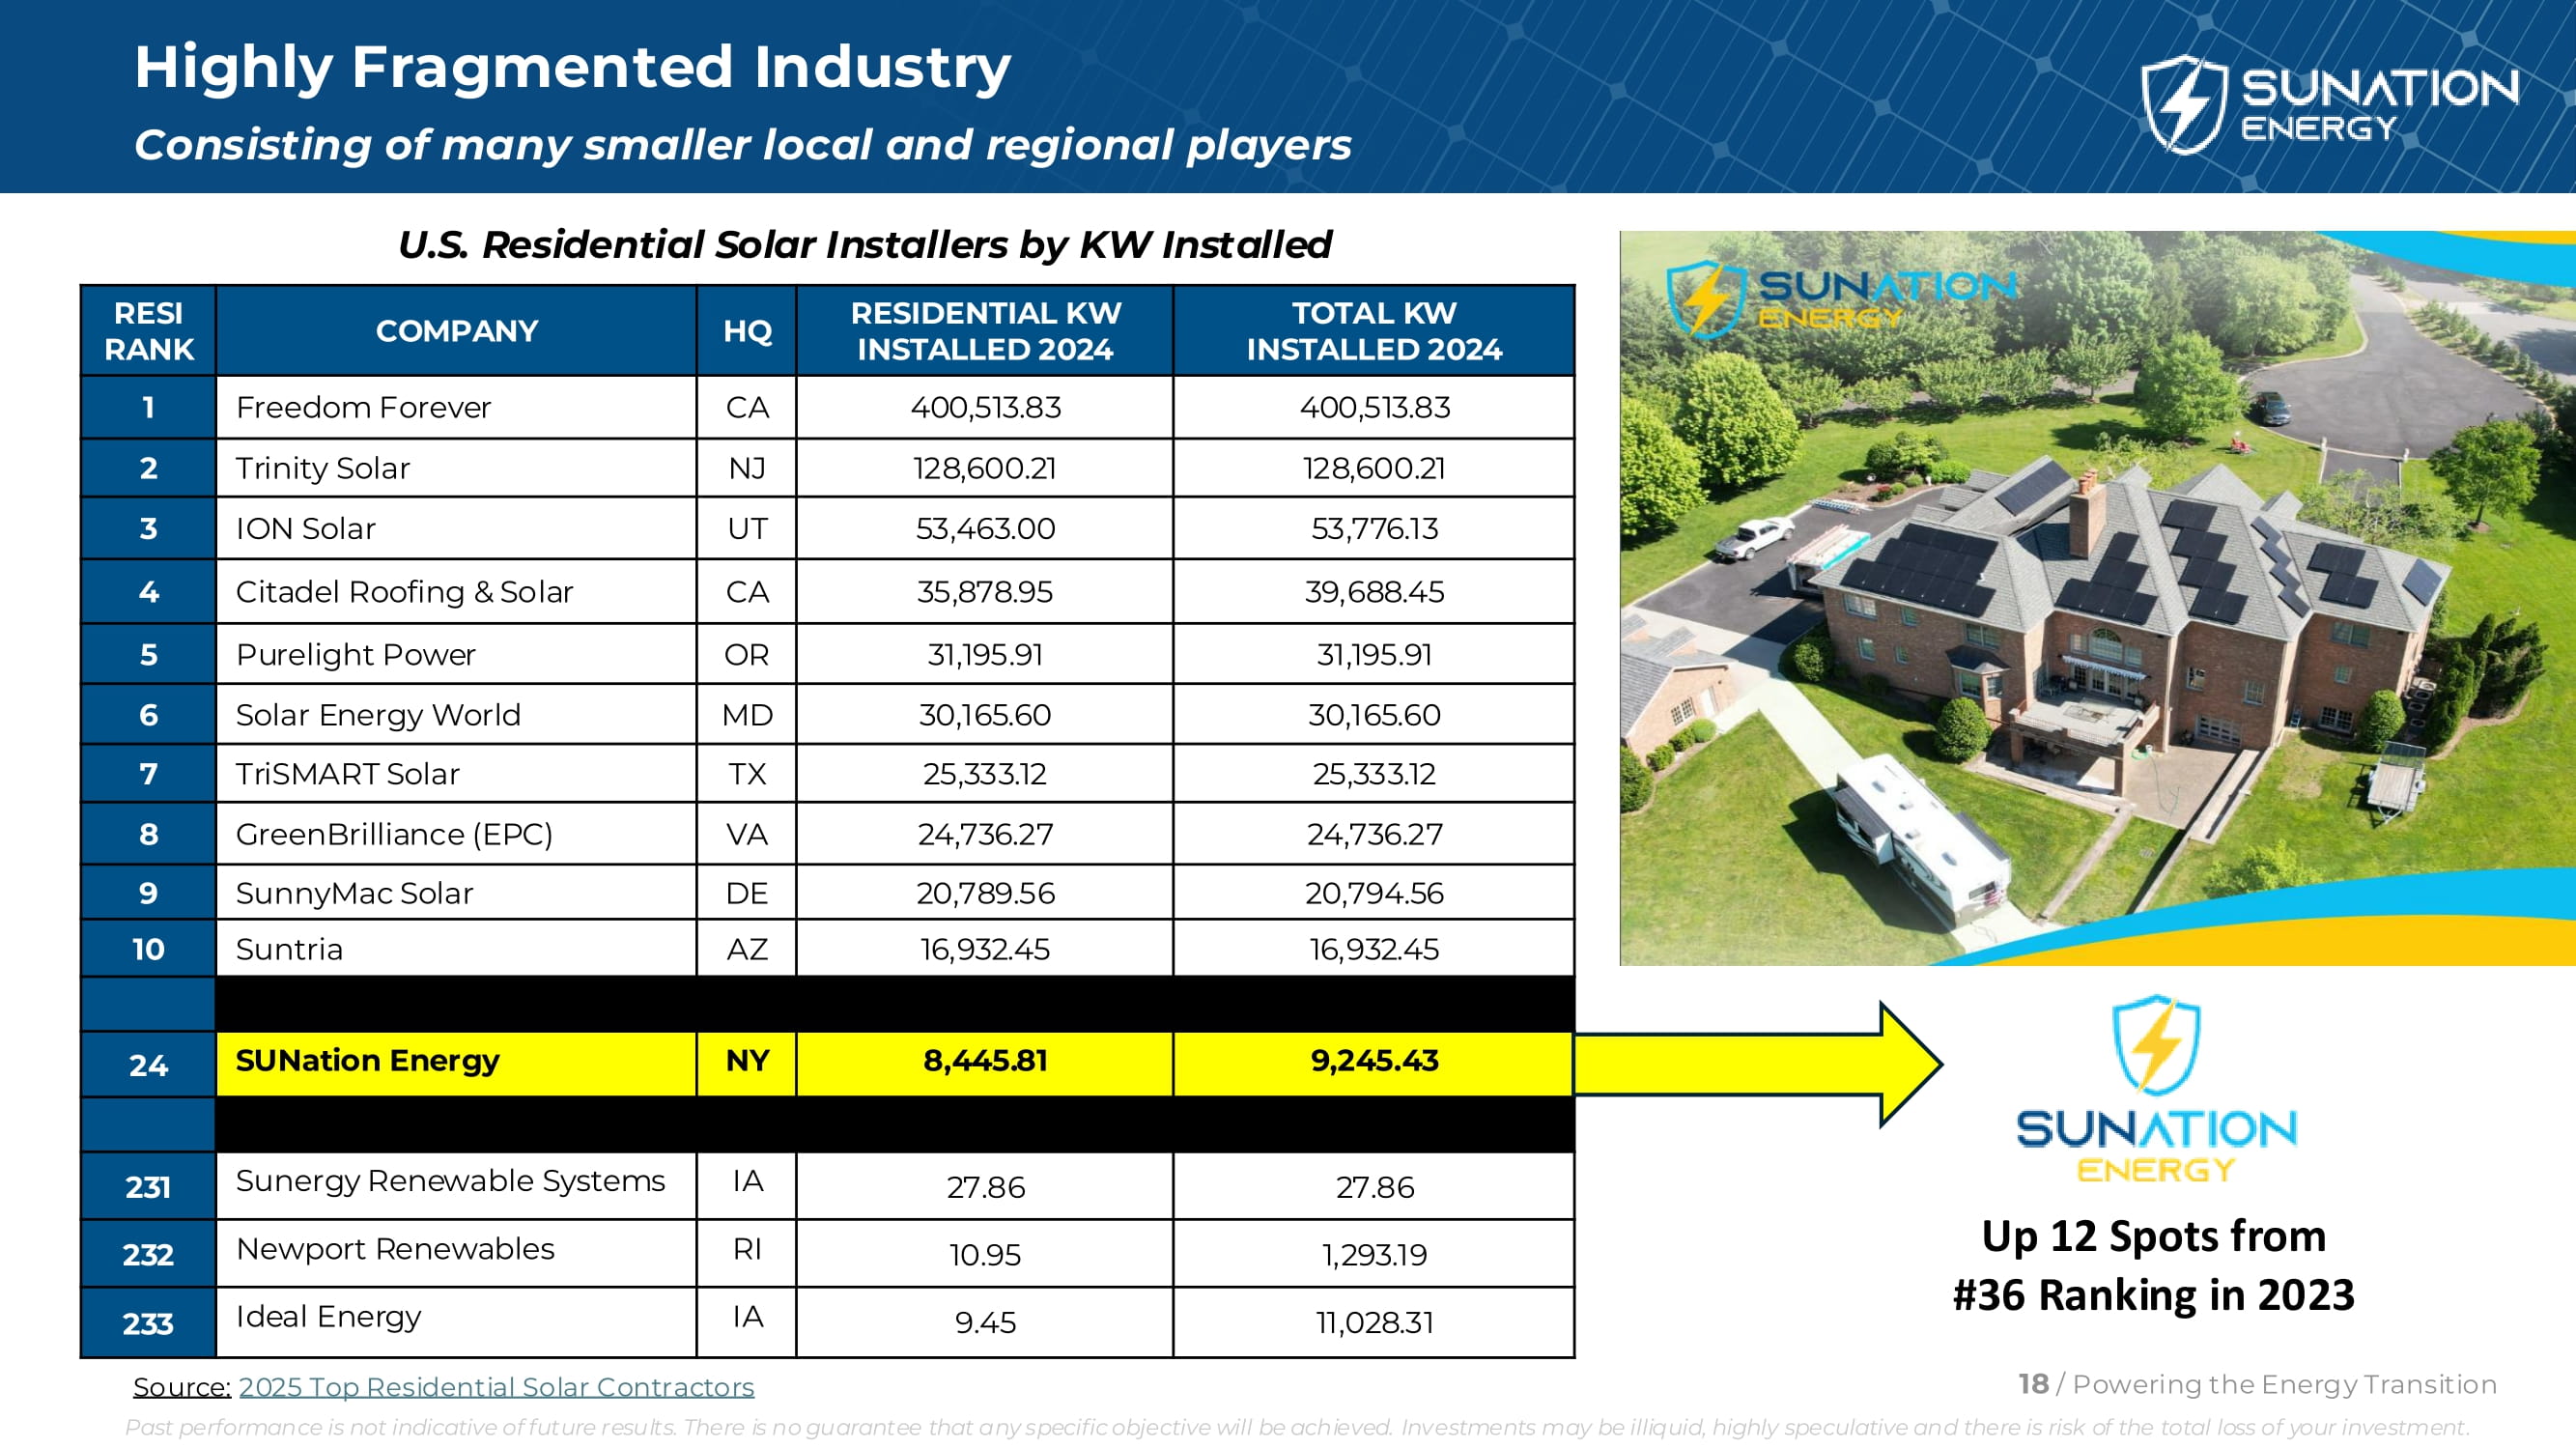
Highly Fragmented Industry Consisting of many smaller local and regional players U.S. Residential Solar Installers by KW Installed TOTAL KW INSTALLED 2024 RESIDENTIAL KW INSTALLED 2024 HQ COMPANY RESI RANK 400,513.83 400,513.83 CA Freedom Forever 1 128,600.21 128,600.21 NJ Trinity Solar 2 53,776.13 53,463.00 UT ION Solar 3 39,688.45 35,878.95 CA Citadel Roofing & Solar 4 31,195.91 31,195.91 OR Purelight Power 5 30,165.60 30,165.60 MD Solar Energy World 6 25,333.12 25,333.12 TX TriSMART Solar 7 24,736.27 24,736.27 VA GreenBrilliance (EPC) 8 20,794.56 20,789.56 DE SunnyMac Solar 9 16,932.45 16,932.45 AZ Suntria 10 9,245.43 8,445.81 NY SUNation Energy 24 27.86 27.86 IA Sunergy Renewable Systems 231 1,293.19 10.95 RI Newport Renewables 232 11,028.31 9.45 IA Ideal Energy 233 Up 12 Spots from #36 Ranking in 2023 18 / Powering the Energy Transition Source: 2025 Top Residential Solar Contractors Past performance is not indicative of future results. There is no guarantee that any specific objective will be achieved. Investments may be illiquid, highly speculative and there is risk of the total loss of your investment.
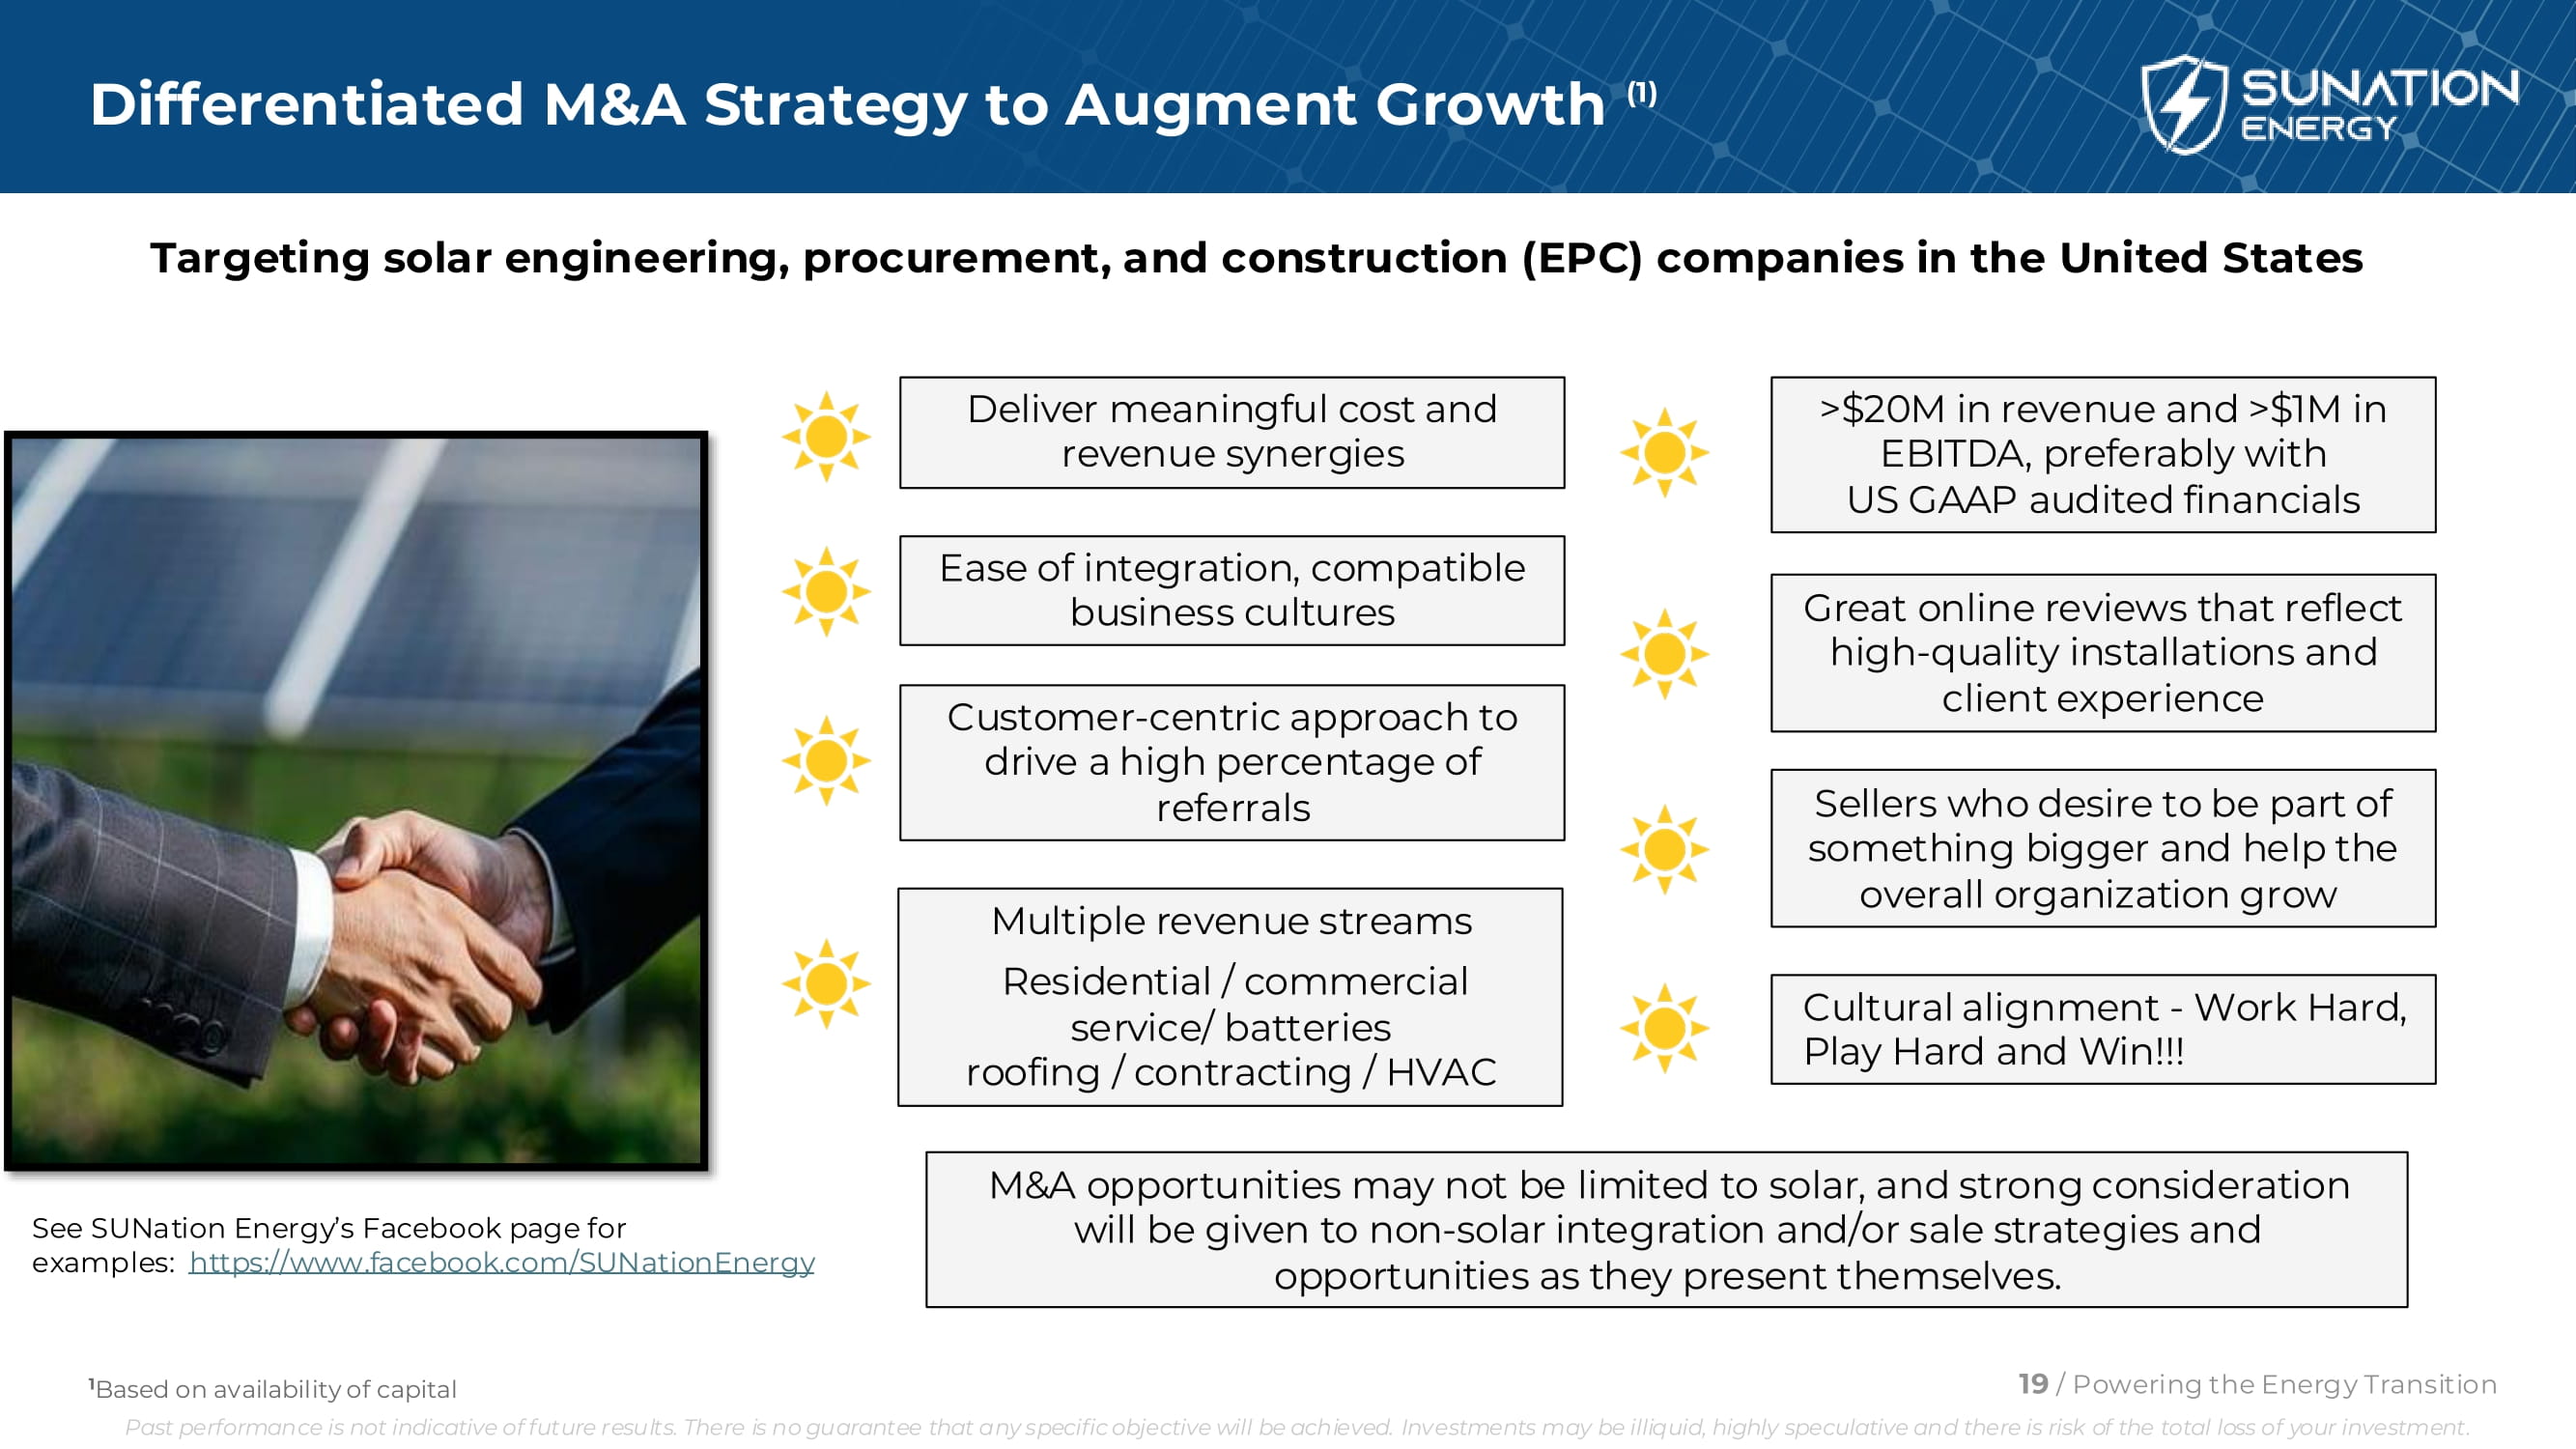
Differentiated M&A Strategy to Augment Growth (1) Customer - centric approach to drive a high percentage of referrals Multiple revenue streams Residential / commercial service/ batteries roofing / contracting / HVAC Deliver meaningful cost and revenue synergies Ease of integration, compatible business cultures Targeting solar engineering, procurement, and construction (EPC) companies in the United States >$20M in revenue and >$1M in EBITDA, preferably with US GAAP audited financials Great online reviews that reflect high - quality installations and client experience Sellers who desire to be part of something bigger and help the overall organization grow Cultural alignment - Work Hard, Play Hard and Win!!! See SUNation Energy’s Facebook page for examples: https://www.facebook.com/SUNationEnergy M&A opportunities may not be limited to solar, and strong consideration will be given to non - solar integration and/or sale strategies and opportunities as they present themselves. 19 / Powering the Energy Transition 1 Based on availability of capital Past performance is not indicative of future results. There is no guarantee that any specific objective will be achieved. Investments may be illiquid, highly speculative and there is risk of the total loss of your investment.
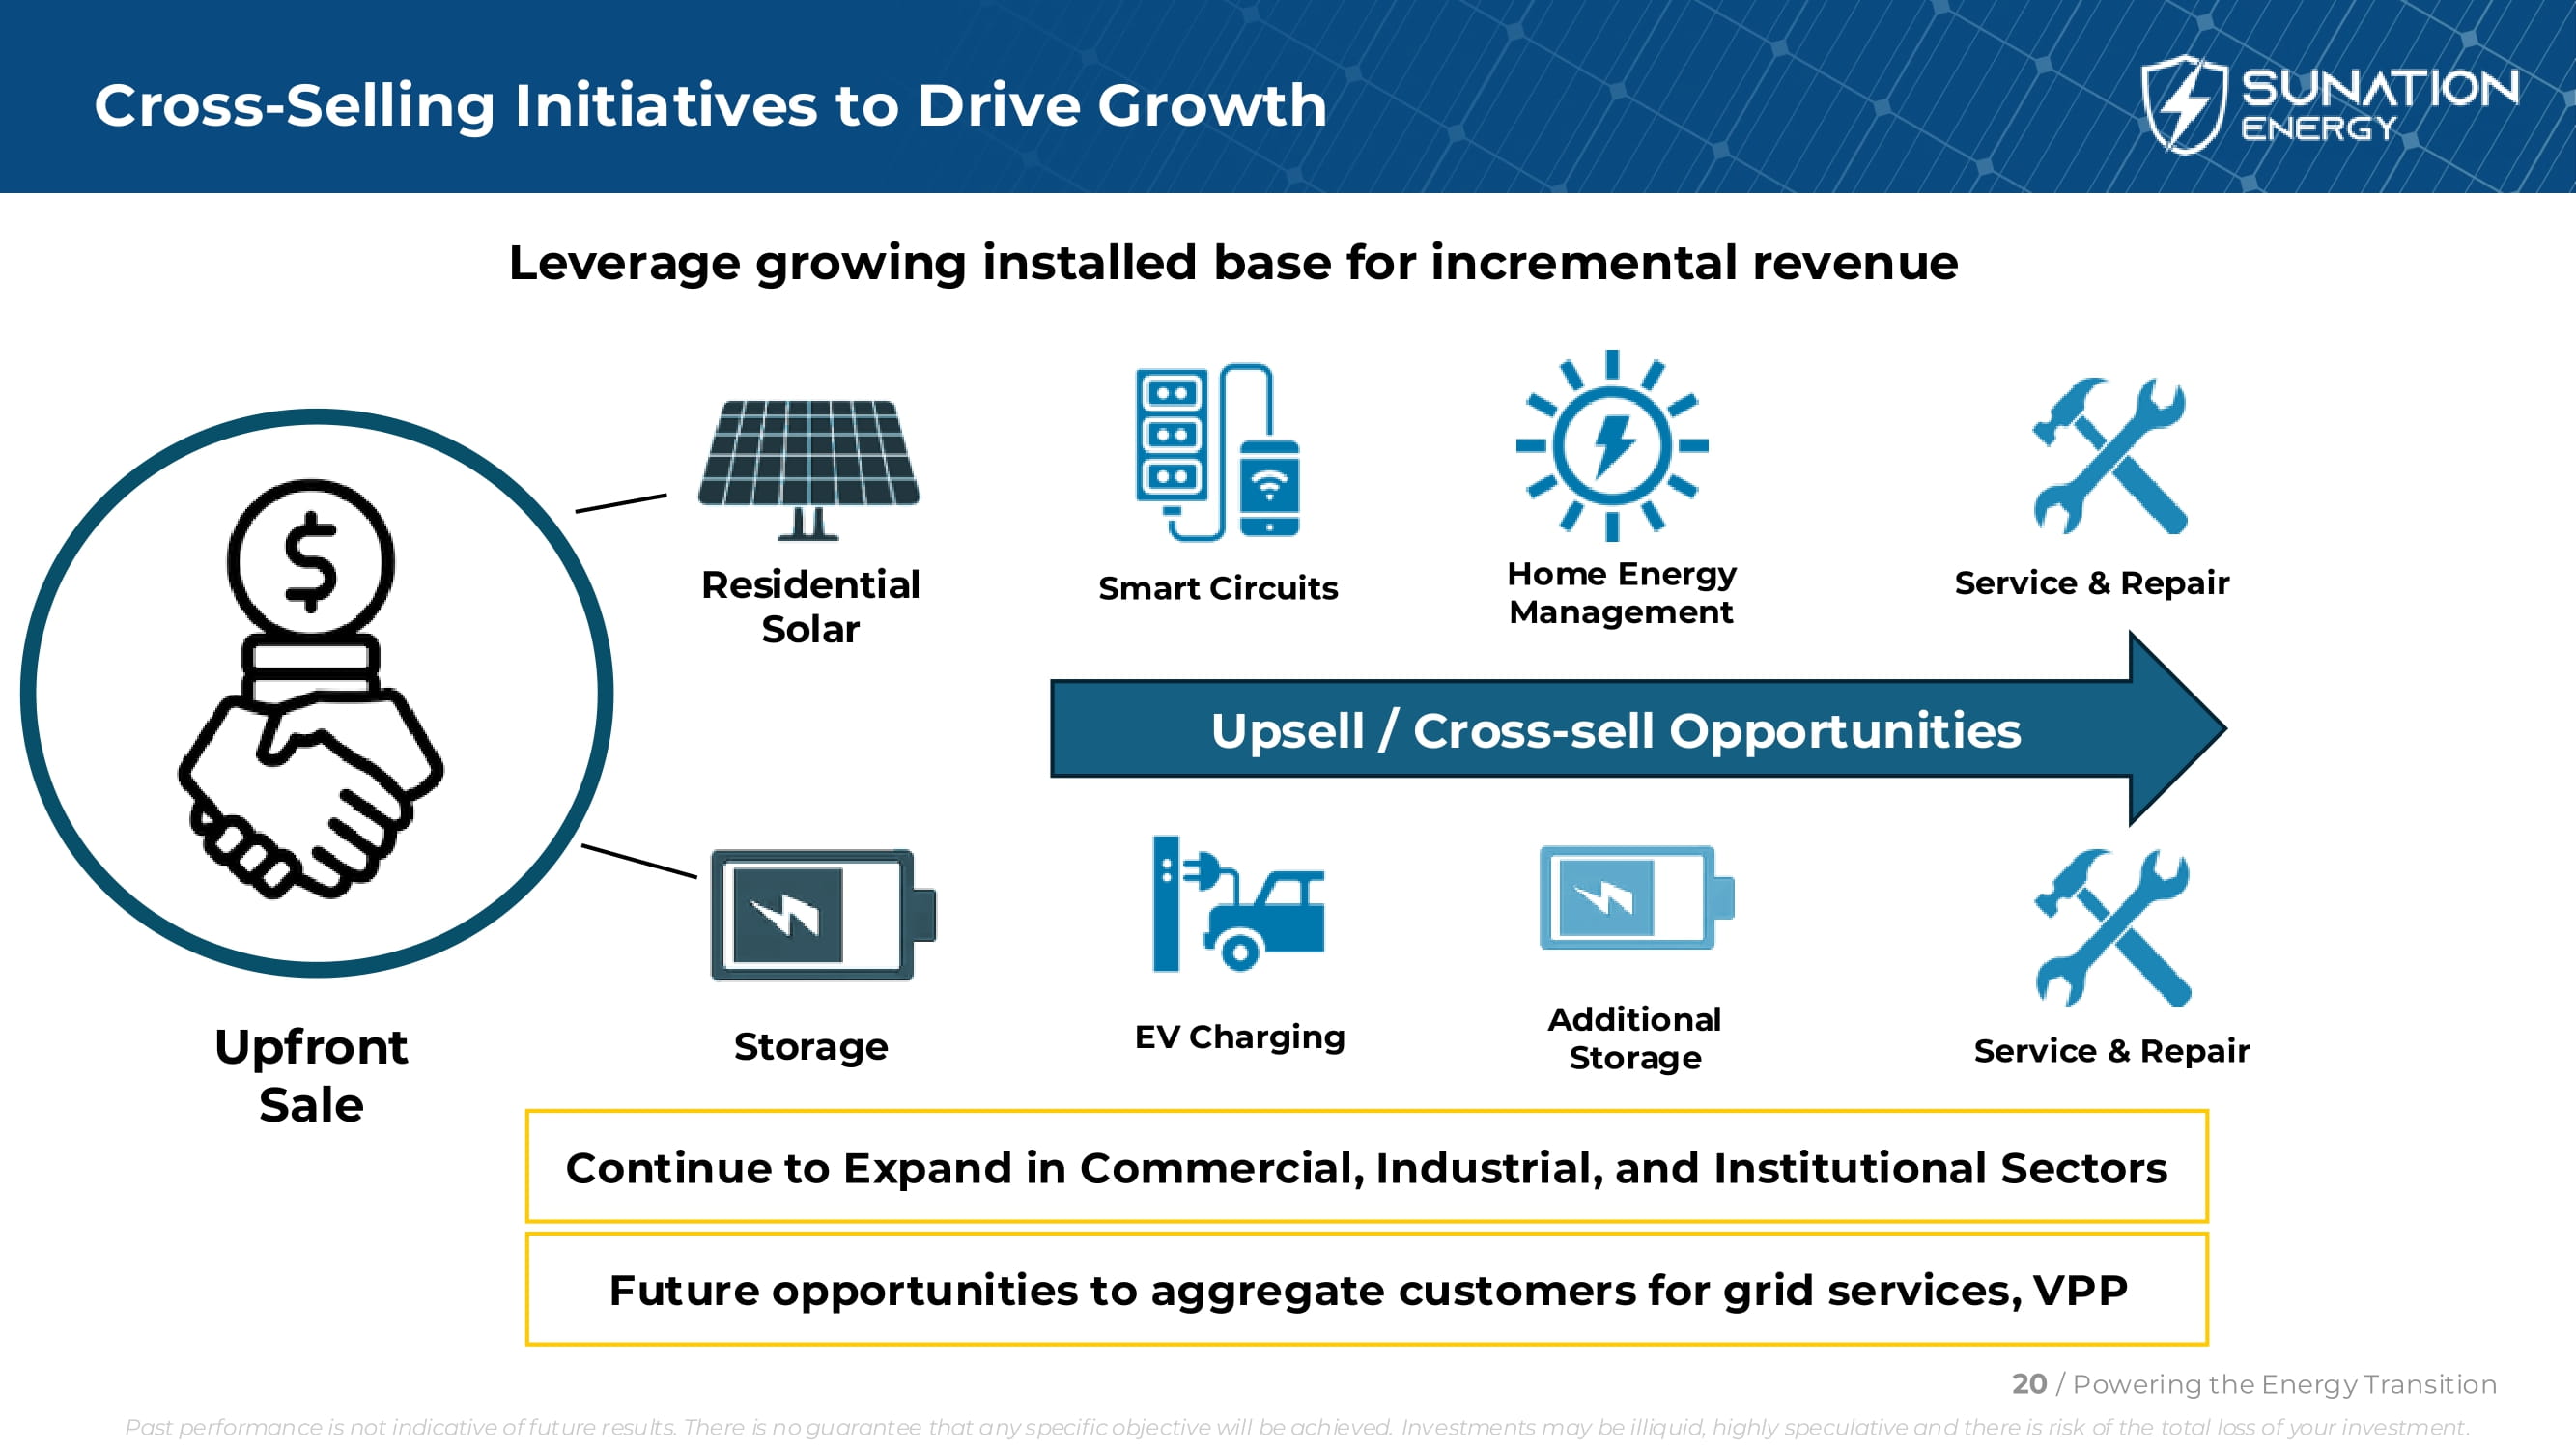
Cross - Selling Initiatives to Drive Growth Leverage growing installed base for incremental revenue Continue to Expand in Commercial, Industrial, and Institutional Sectors Upfront Sale Residential Solar Storage Upsell / Cross - sell Opportunities Service & Repair Smart Circuits Home Energy Management EV Charging Service & Repair 20 / Powering the Energy Transition Past performance is not indicative of future results. There is no guarantee that any specific objective will be achieved. Investments may be illiquid, highly speculative and there is risk of the total loss of your investment. Additional Storage Future opportunities to aggregate customers for grid services, VPP
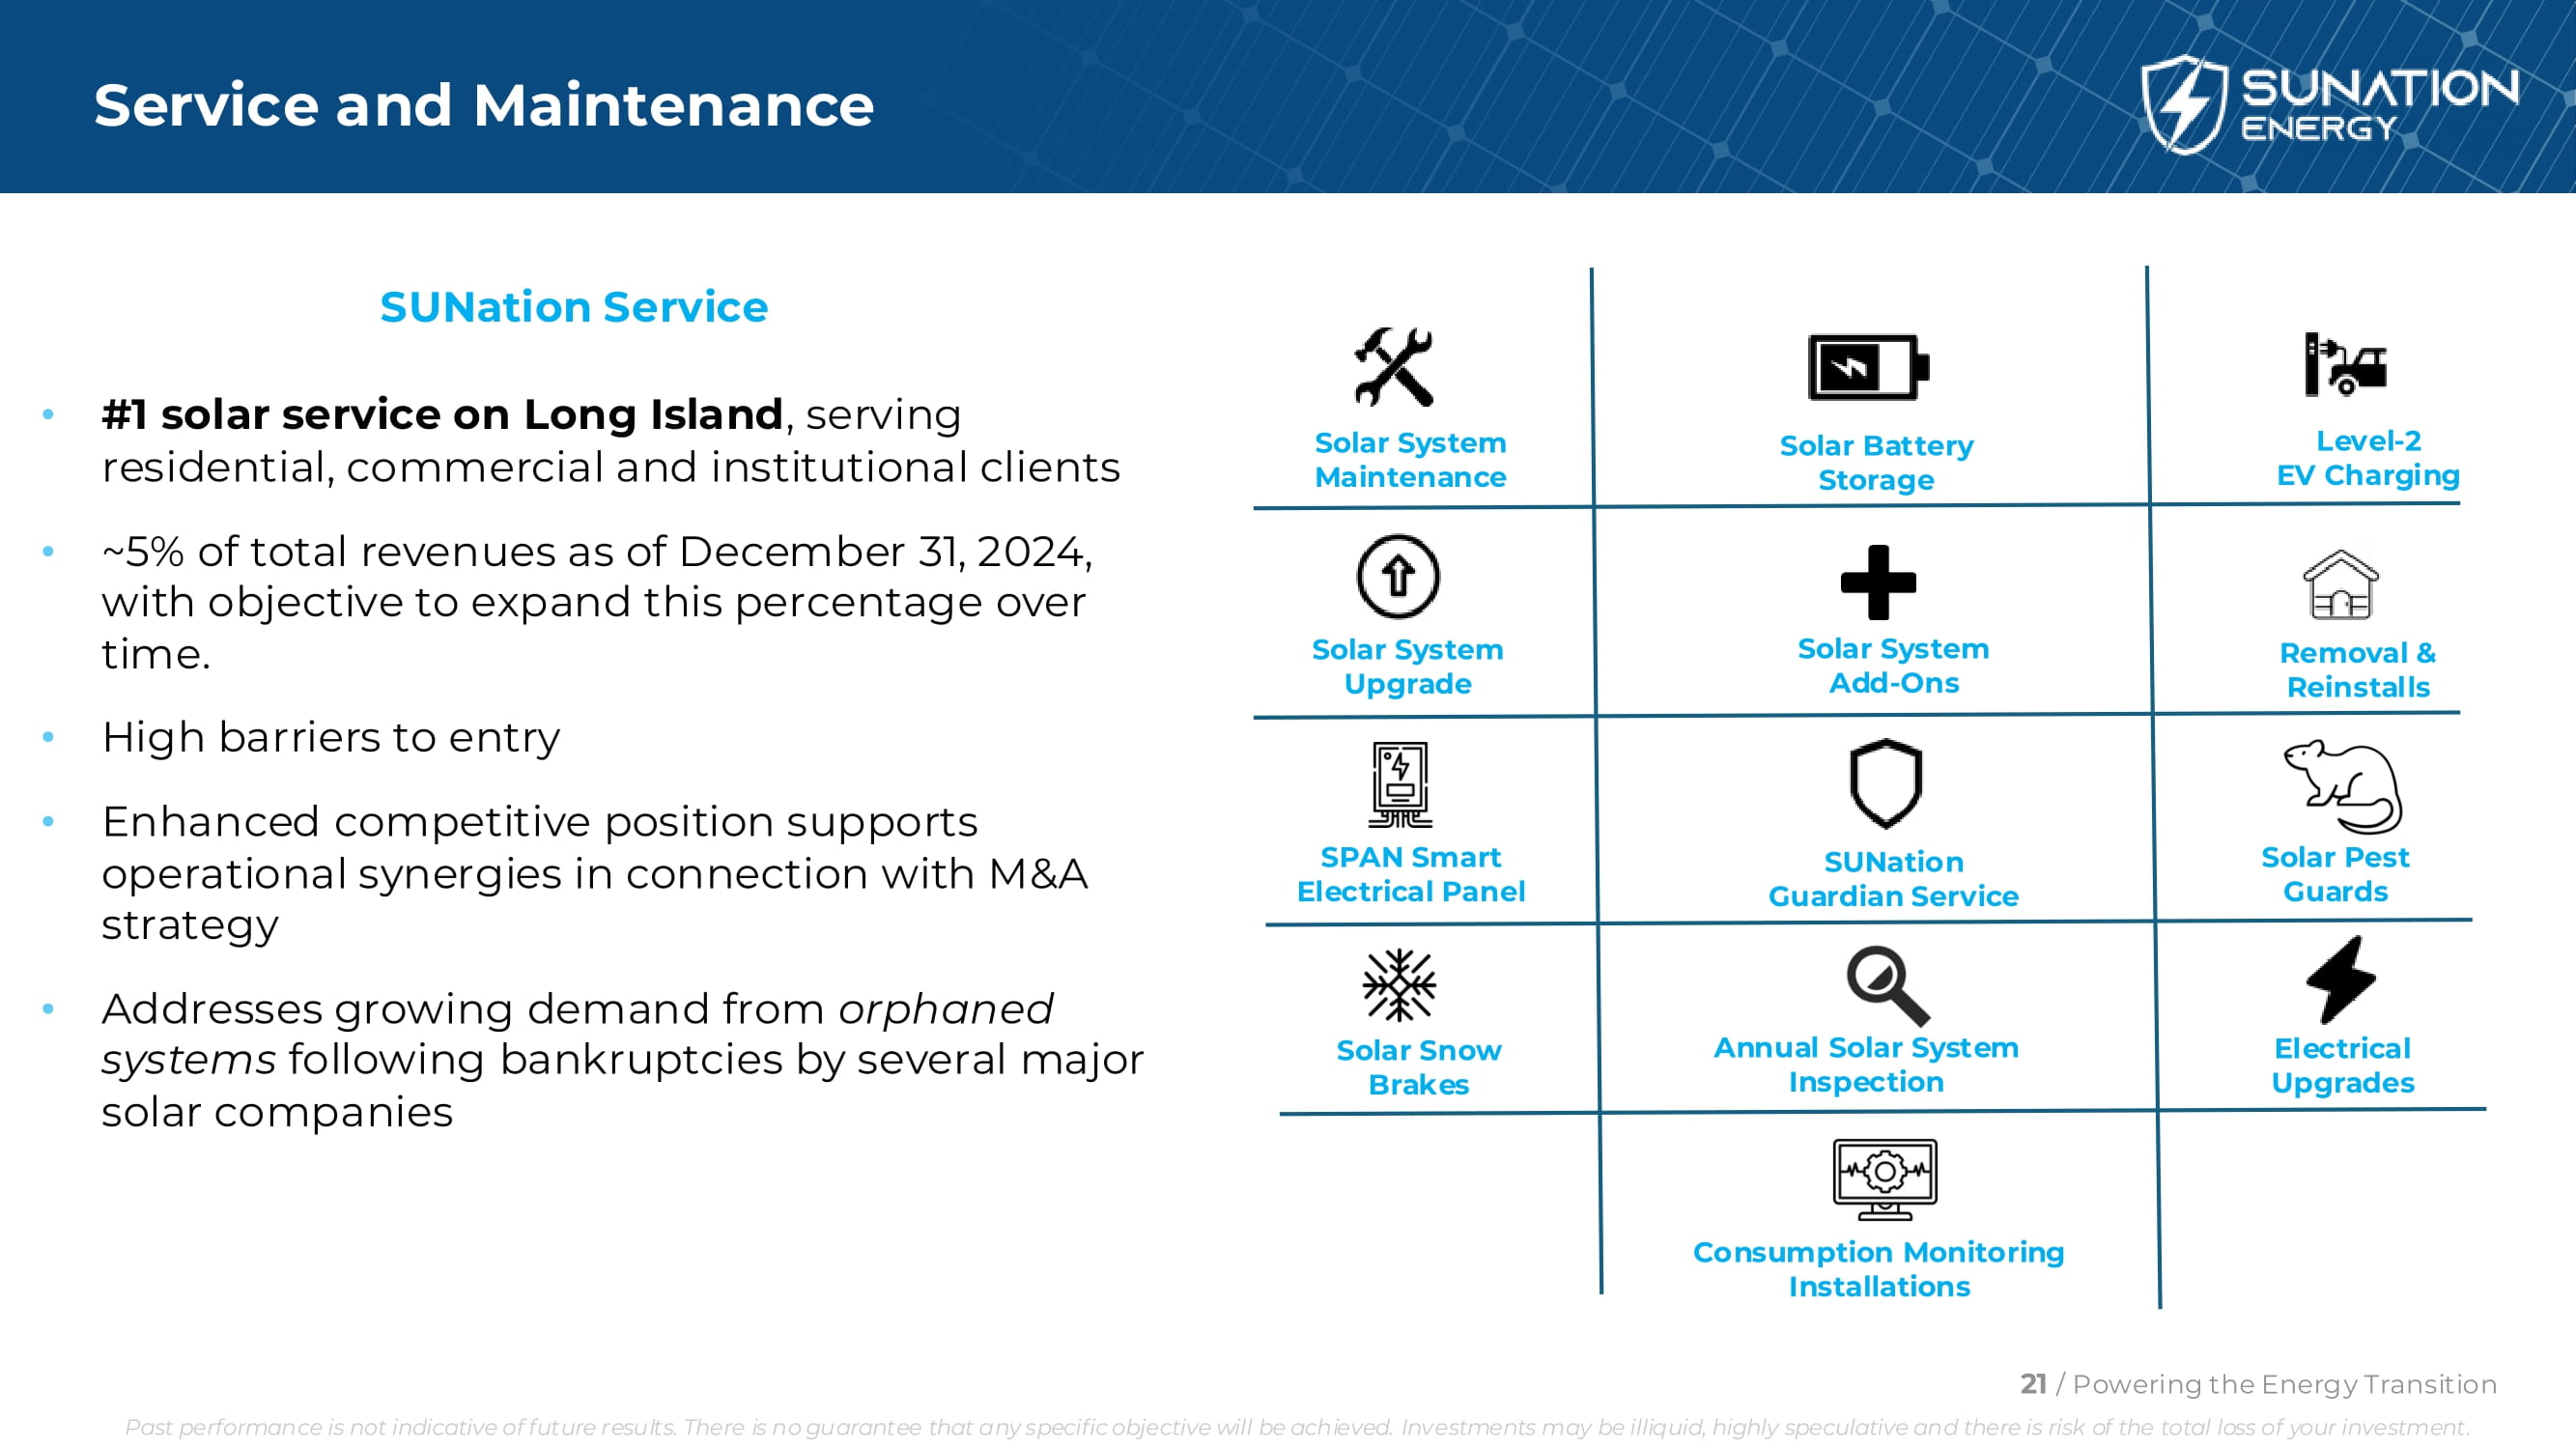
Service and Maintenance • #1 solar service on Long Island , serving residential, commercial and institutional clients • ~ 5 % of total revenues as of December 31 , 2024 , with objective to expand this percentage over time . • High barriers to entry • Enhanced competitive position supports operational synergies in connection with M&A strategy • Addresses growing demand from orphaned systems following bankruptcies by several major solar companies SUNation Service Solar System Maintenance Solar Battery Storage Level - 2 EV Charging Solar System Upgrade Solar System Add - Ons Removal & Reinstalls SPAN Smart Electrical Panel SUNation Guardian Service Solar Pest Guards Solar Snow Brakes Annual Solar System Inspection Electrical Upgrades Consumption Monitoring Installations 21 / Powering the Energy Transition Past performance is not indicative of future results. There is no guarantee that any specific objective will be achieved. Investments may be illiquid, highly speculative and there is risk of the total loss of your investment.
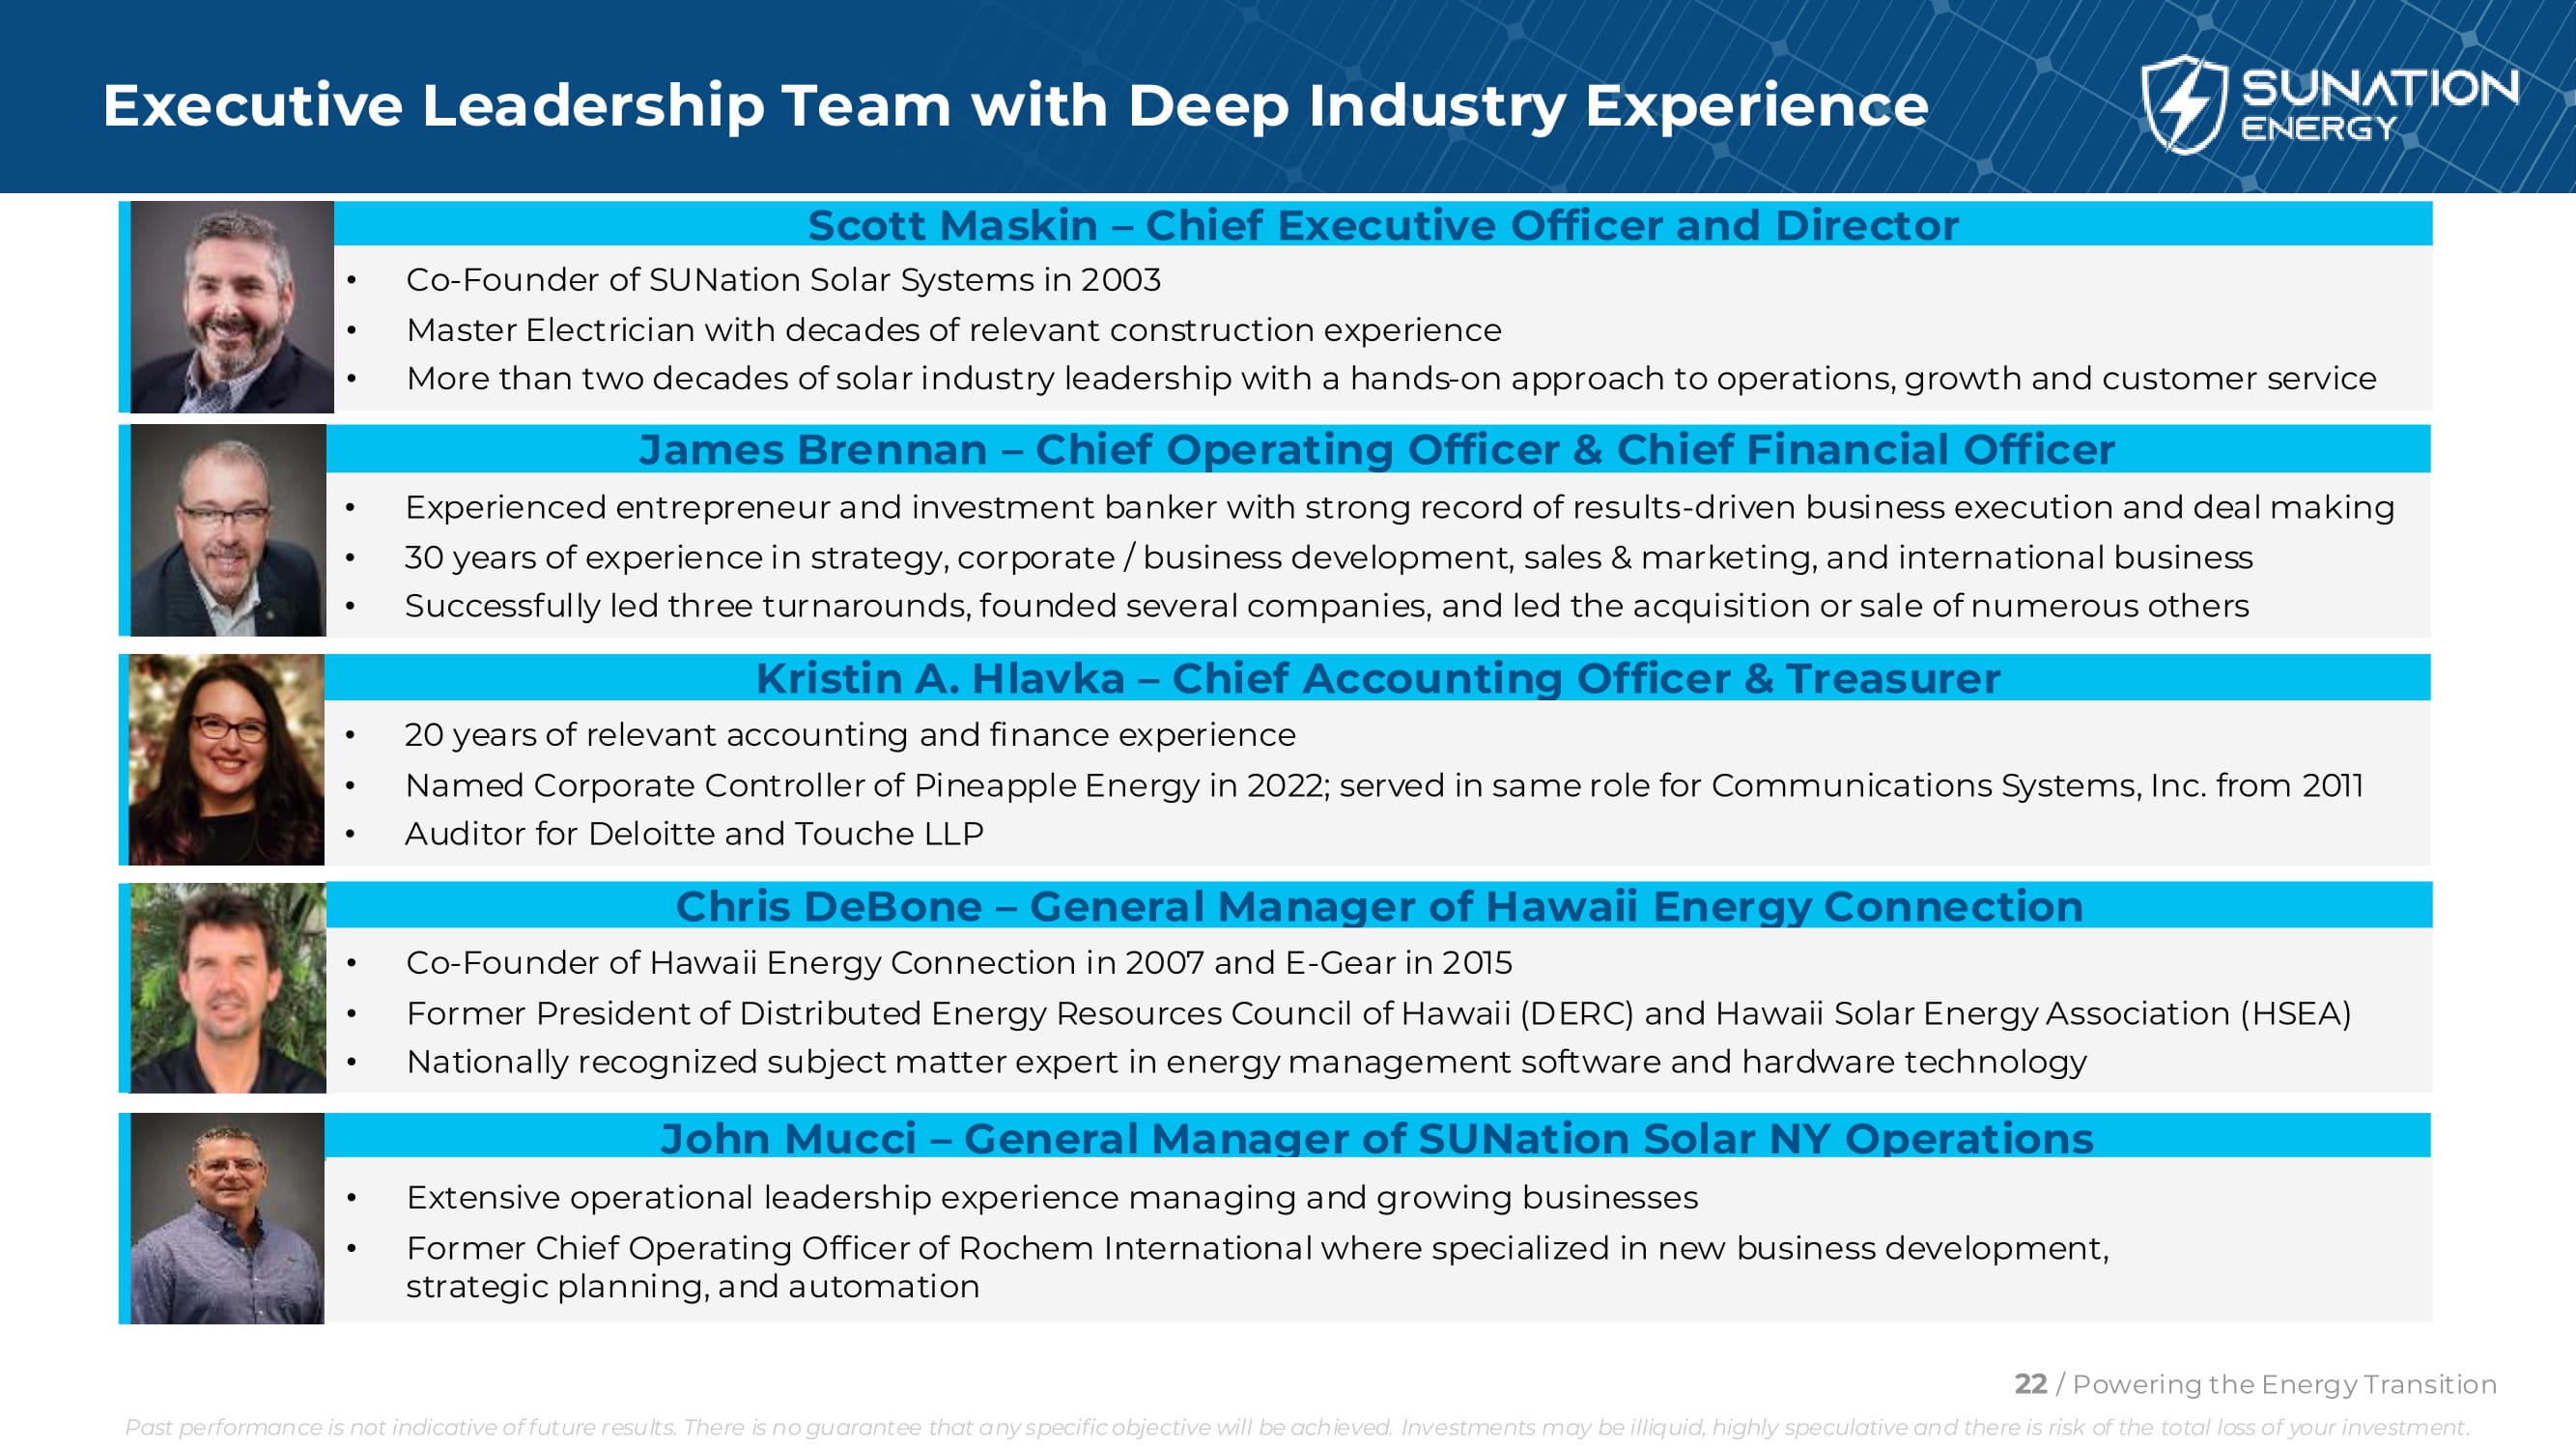
Executive Leadership Team with Deep Industry Experience Scott Maskin – Chief Executive Officer and Director • Co - Founder of SUNation Solar Systems in 2003 • Master Electrician with decades of relevant construction experience • More than two decades of solar industry leadership with a hands - on approach to operations, growth and customer service James Brennan – Chief Operating Officer & Chief Financial Officer • Experienced entrepreneur and investment banker with strong record of results - driven business execution and deal making • 30 years of experience in strategy, corporate / business development, sales & marketing, and international business • Successfully led three turnarounds, founded several companies, and led the acquisition or sale of numerous others Kristin A. Hlavka – Chief Accounting Officer & Treasurer • 20 years of relevant accounting and finance experience • Named Corporate Controller of Pineapple Energy in 2022; served in same role for Communications Systems, Inc. from 2011 • Auditor for Deloitte and Touche LLP Chris DeBone – General Manager of Hawaii Energy Connection • Co - Founder of Hawaii Energy Connection in 2007 and E - Gear in 2015 • Former President of Distributed Energy Resources Council of Hawaii (DERC) and Hawaii Solar Energy Association (HSEA) • Nationally recognized subject matter expert in energy management software and hardware technology John Mucci – General Manager of SUNation Solar NY Operations • Extensive operational leadership experience managing and growing businesses • Former Chief Operating Officer of Rochem International where specialized in new business development, strategic planning, and automation 22 / Powering the Energy Transition Past performance is not indicative of future results. There is no guarantee that any specific objective will be achieved. Investments may be illiquid, highly speculative and there is risk of the total loss of your investment.
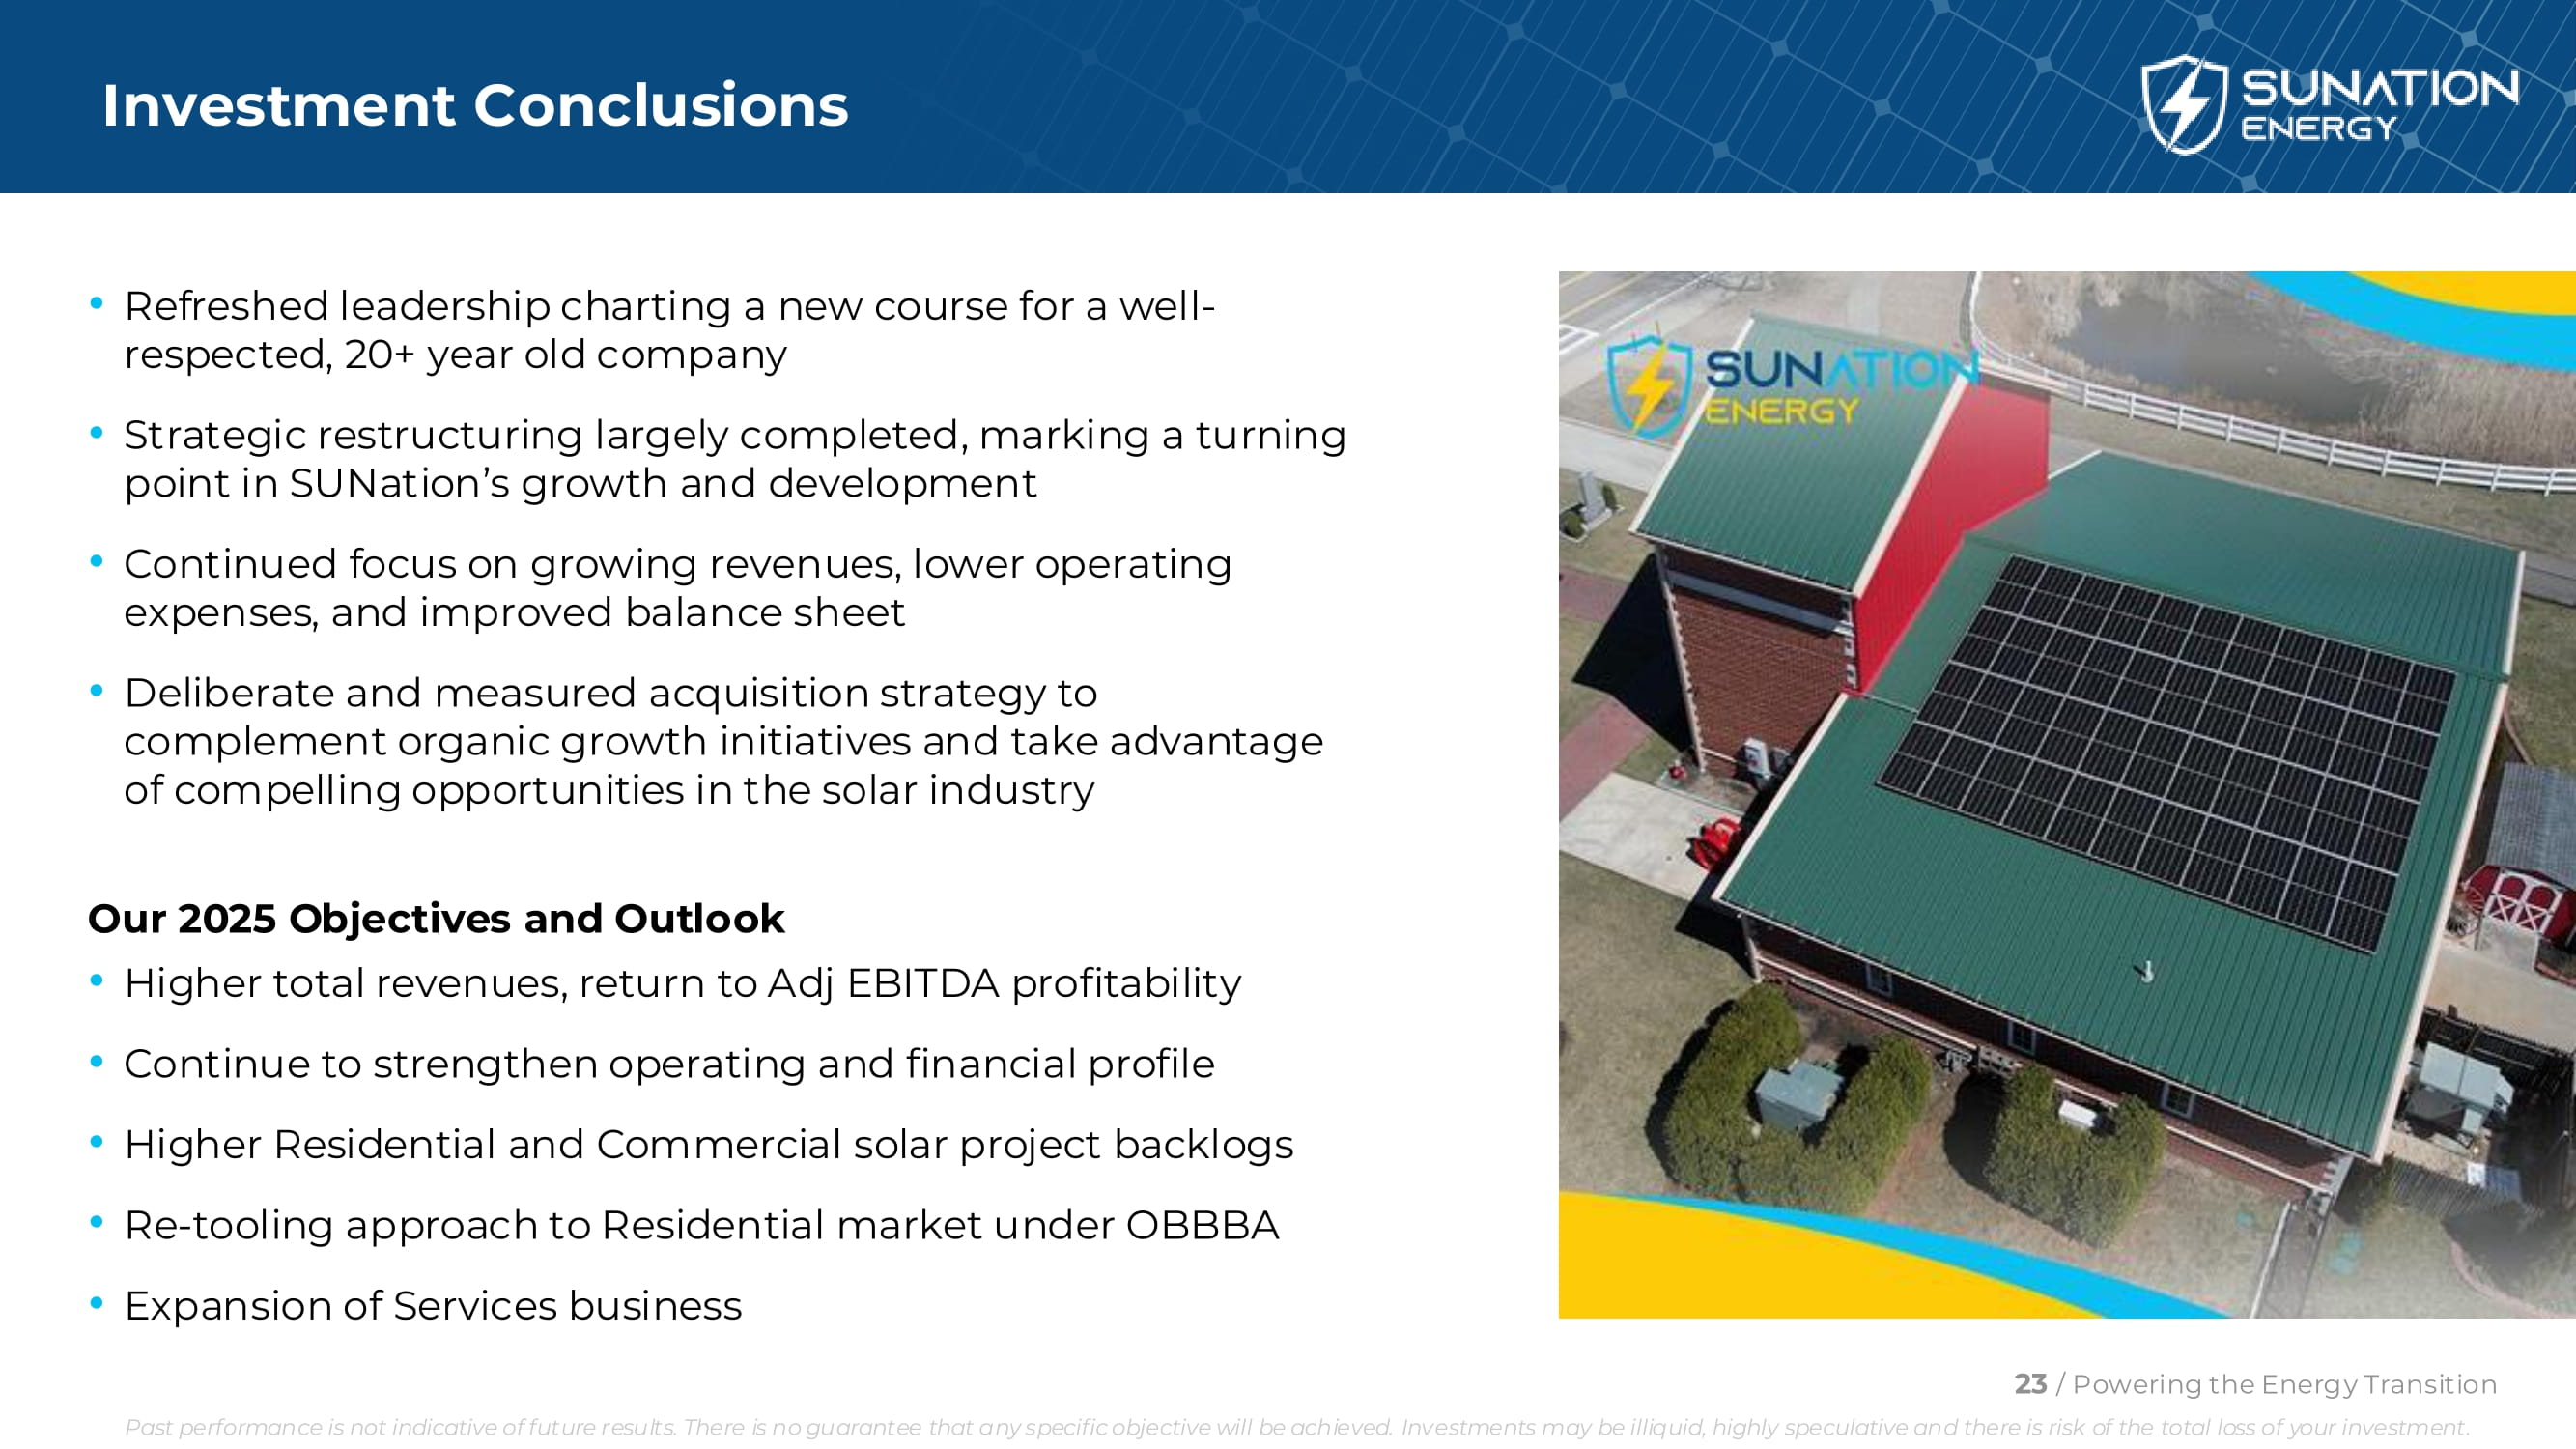
Investment Conclusions • Refreshed leadership charting a new course for a well - respected, 20+ year old company • Strategic restructuring largely completed, marking a turning point in SUNation’s growth and development • Continued focus on growing revenues, lower operating expenses, and improved balance sheet • Deliberate and measured acquisition strategy to complement organic growth initiatives and take advantage of compelling opportunities in the solar industry Our 2025 Objectives and Outlook • Higher total revenues, return to Adj EBITDA profitability • Continue to strengthen operating and financial profile • Higher Residential and Commercial solar project backlogs • Re - tooling approach to Residential market under OBBBA • Expansion of Services business 23 / Powering the Energy Transition Past performance is not indicative of future results. There is no guarantee that any specific objective will be achieved. Investments may be illiquid, highly speculative and there is risk of the total loss of your investment.
| Financials / Appendix |
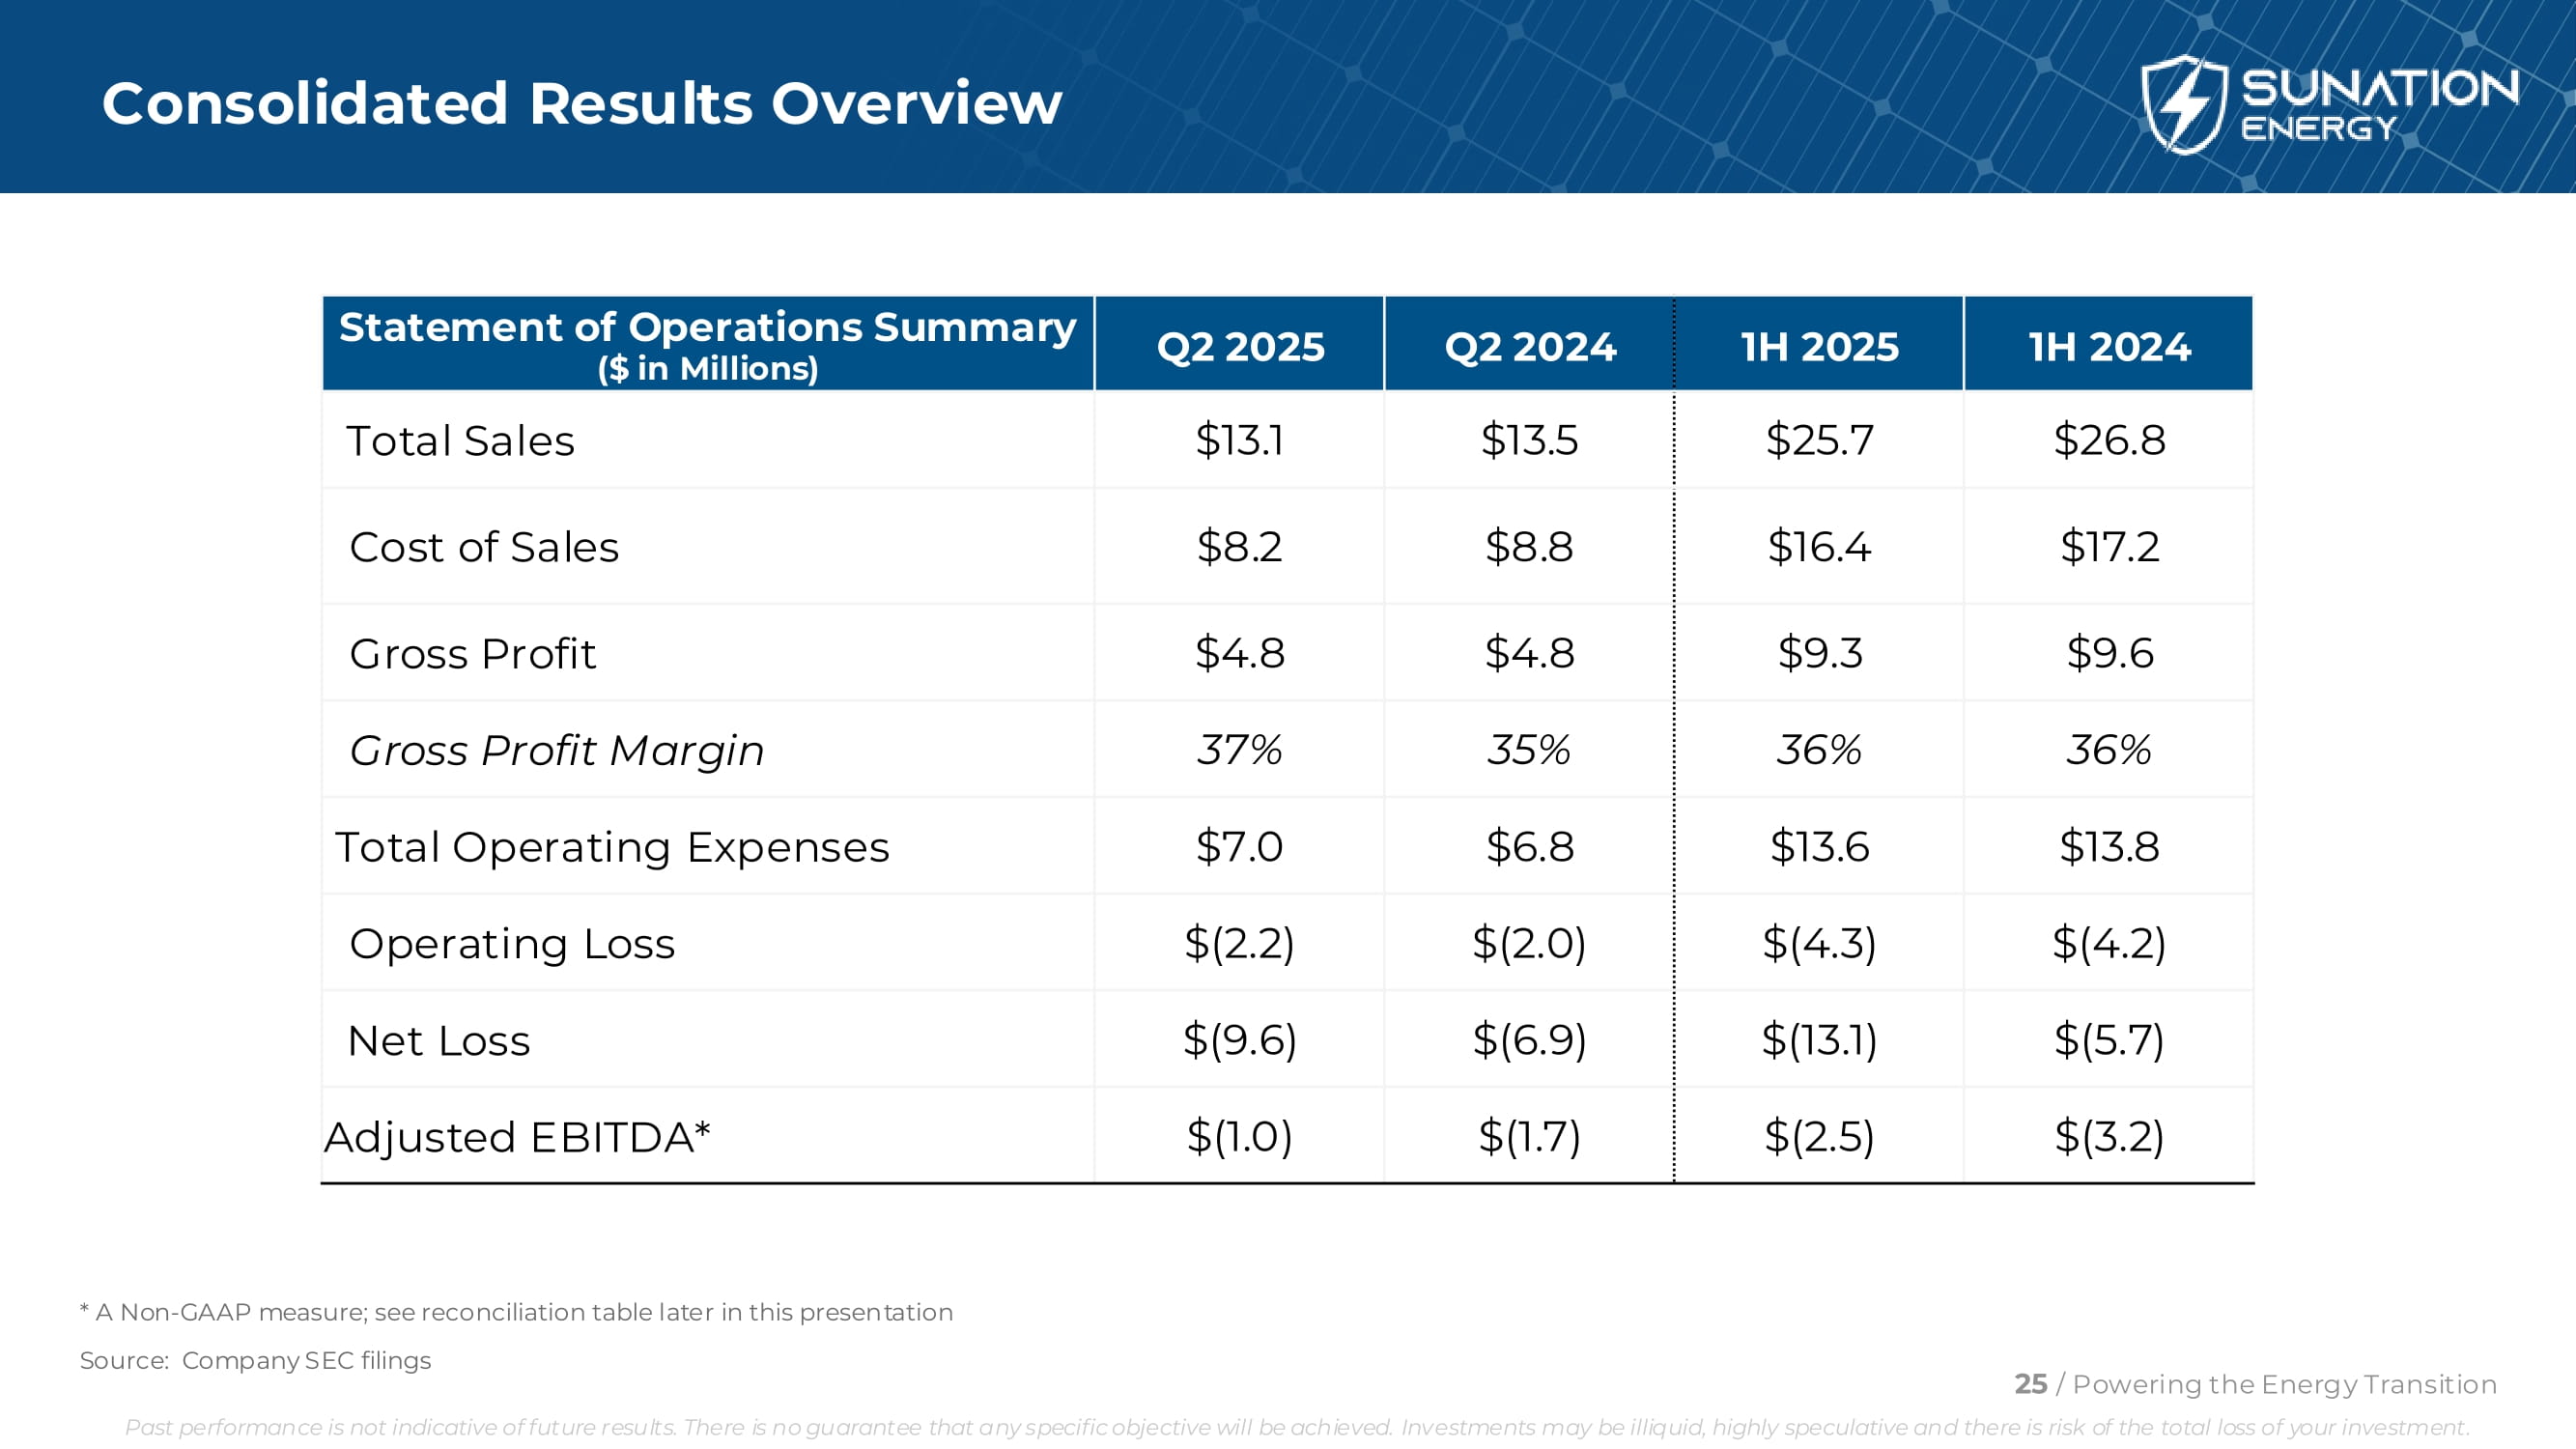
1H 2024 1H 2025 Q2 2024 Q2 2025 Statement of Operations Summary ($ in Millions) $26.8 $25.7 $13.5 $13.1 Total Sales $17.2 $16.4 $8.8 $8.2 Cost of Sales $9.6 $9.3 $4.8 $4.8 Gross Profit 36% 36% 35% 37% Gross Profit Margin $13.8 $13.6 $6.8 $7.0 Total Operating Expenses $(4.2) $(4.3) $(2.0) $(2.2) Operating Loss $(5.7) $(13.1) $(6.9) $(9.6) Net Loss $(3.2) $(2.5) $(1.7) $(1.0) Adjusted EBITDA* Source: Company SEC filings 25 / Powering the Energy Transition Past performance is not indicative of future results. There is no guarantee that any specific objective will be achieved. Investments may be illiquid, highly speculative and there is risk of the total loss of your investment. * A Non - GAAP measure; see reconciliation table later in this presentation Consolidated Results Overview
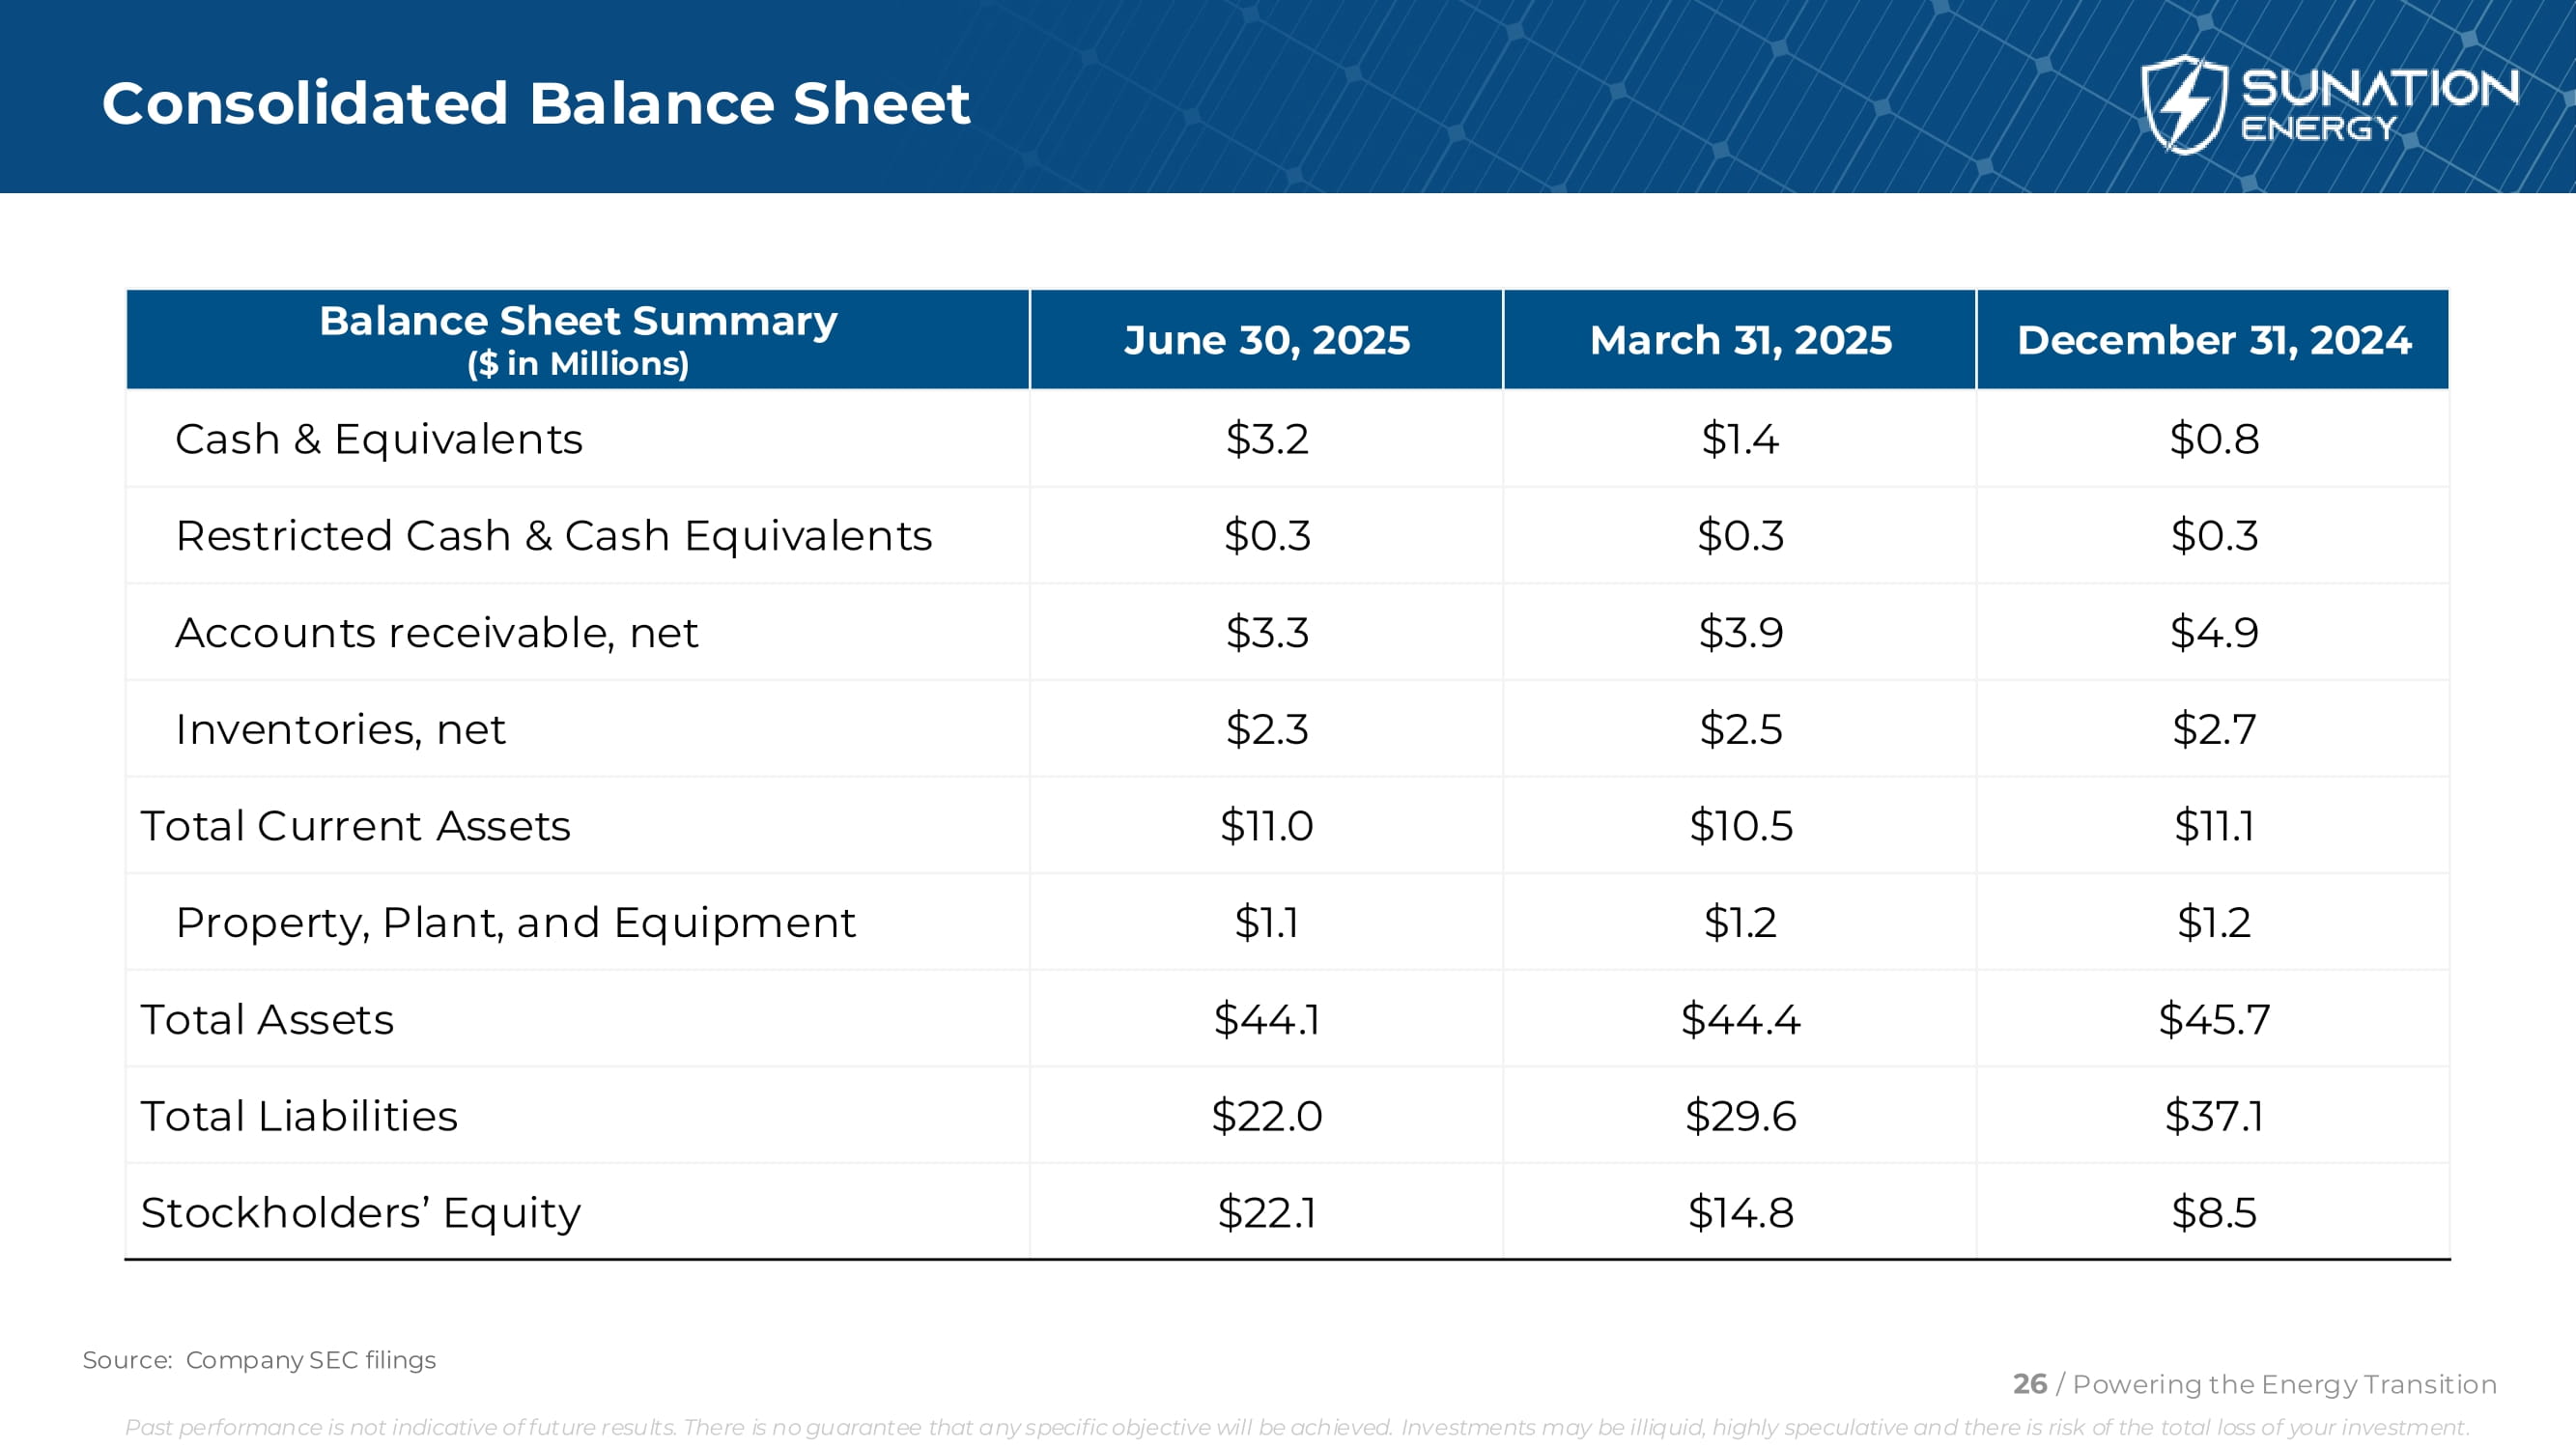
Consolidated Balance Sheet Source: Company SEC filings 26 / Powering the Energy Transition Past performance is not indicative of future results. There is no guarantee that any specific objective will be achieved. Investments may be illiquid, highly speculative and there is risk of the total loss of your investment. December 31, 2024 March 31, 2025 June 30, 2025 Balance Sheet Summary ($ in Millions) $0.8 $1.4 $3.2 Cash & Equivalents $0.3 $0.3 $0.3 Restricted Cash & Cash Equivalents $4.9 $3.9 $3.3 Accounts receivable, net $2.7 $2.5 $2.3 Inventories, net $11.1 $10.5 $11.0 Total Current Assets $1.2 $1.2 $1.1 Property, Plant, and Equipment $45.7 $44.4 $44.1 Total Assets $37.1 $29.6 $22.0 Total Liabilities $8.5 $14.8 $22.1 Stockholders’ Equity
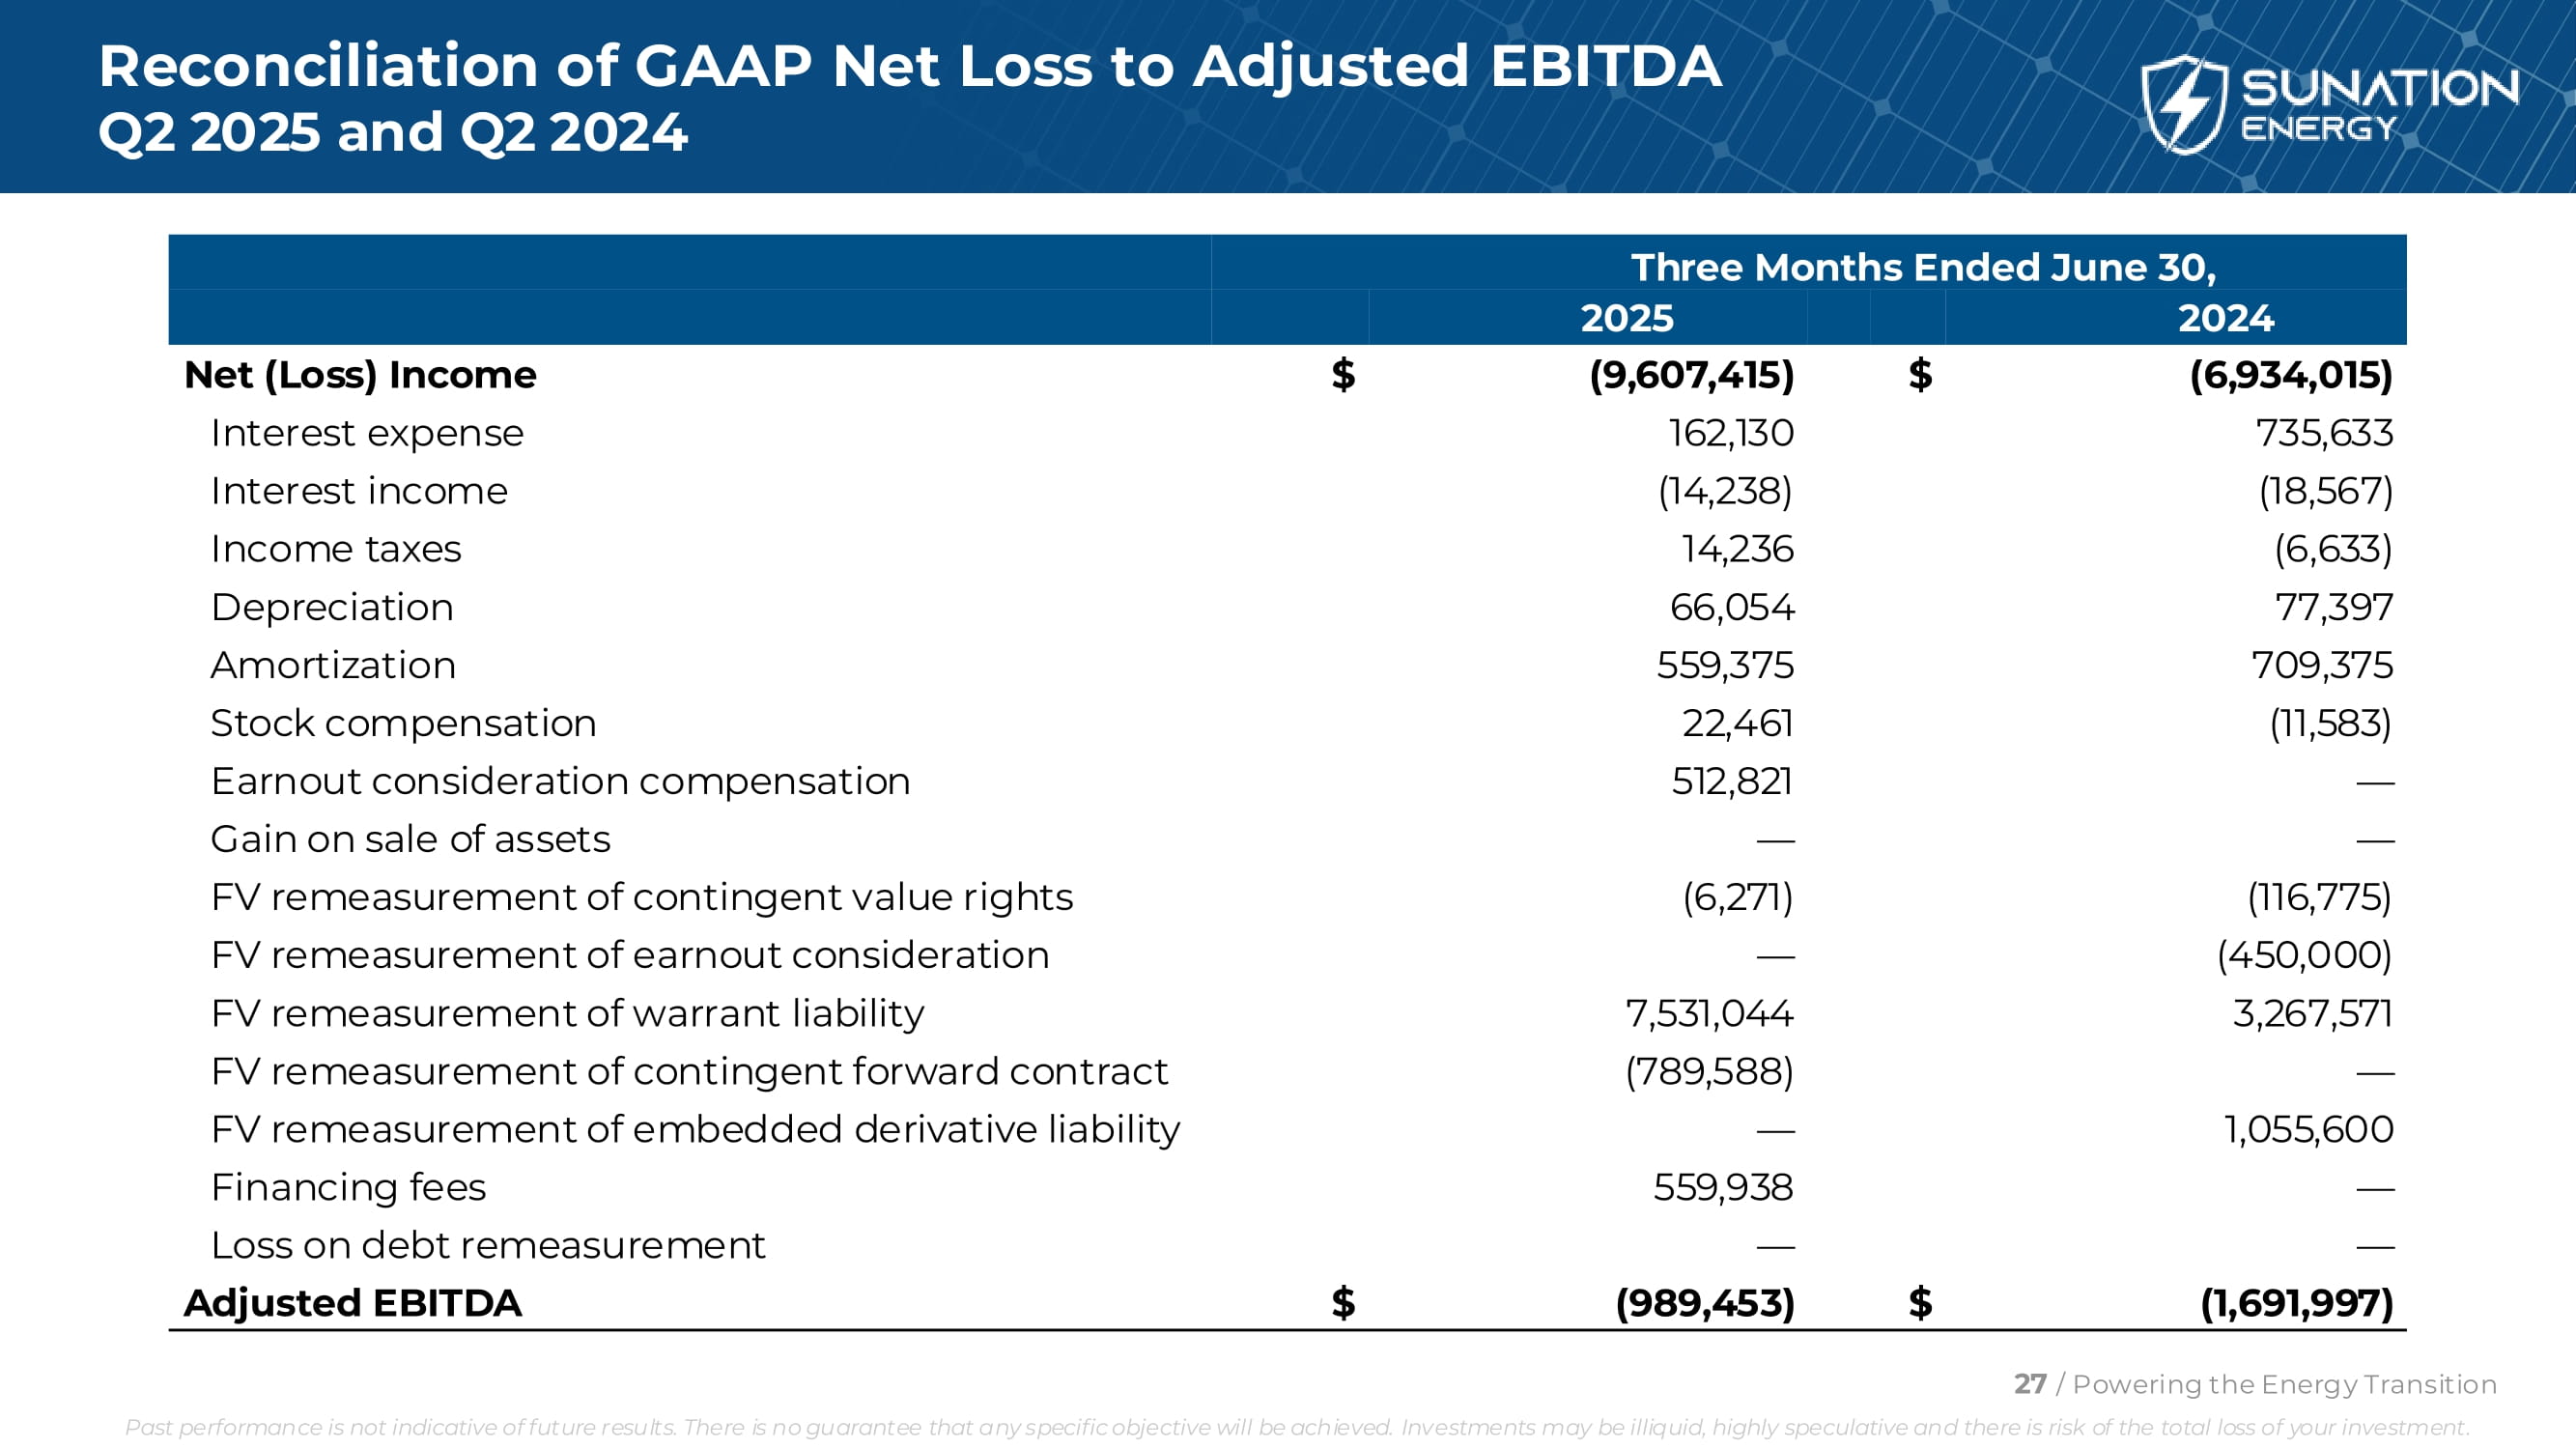
Reconciliation of GAAP Net Loss to Adjusted EBITDA Q2 2025 and Q2 2024 27 / Powering the Energy Transition Past performance is not indicative of future results. There is no guarantee that any specific objective will be achieved. Investments may be illiquid, highly speculative and there is risk of the total loss of your investment. Three Months Ended June 30, 2024 2025 (6,934,015) $ (9,607,415) $ Net (Loss) Income 735,633 162,130 Interest expense (18,567) (14,238) Interest income (6,633) 14,236 Income taxes 77,397 66,054 Depreciation 709,375 559,375 Amortization (11,583) 22,461 Stock compensation — 512,821 Earnout consideration compensation — — Gain on sale of assets (116,775) (6,271) FV remeasurement of contingent value rights (450,000) — FV remeasurement of earnout consideration 3,267,571 7,531,044 FV remeasurement of warrant liability — (789,588) FV remeasurement of contingent forward contract 1,055,600 — FV remeasurement of embedded derivative liability — 559,938 Financing fees — — Loss on debt remeasurement (1,691,997) $ (989,453) $ Adjusted EBITDA
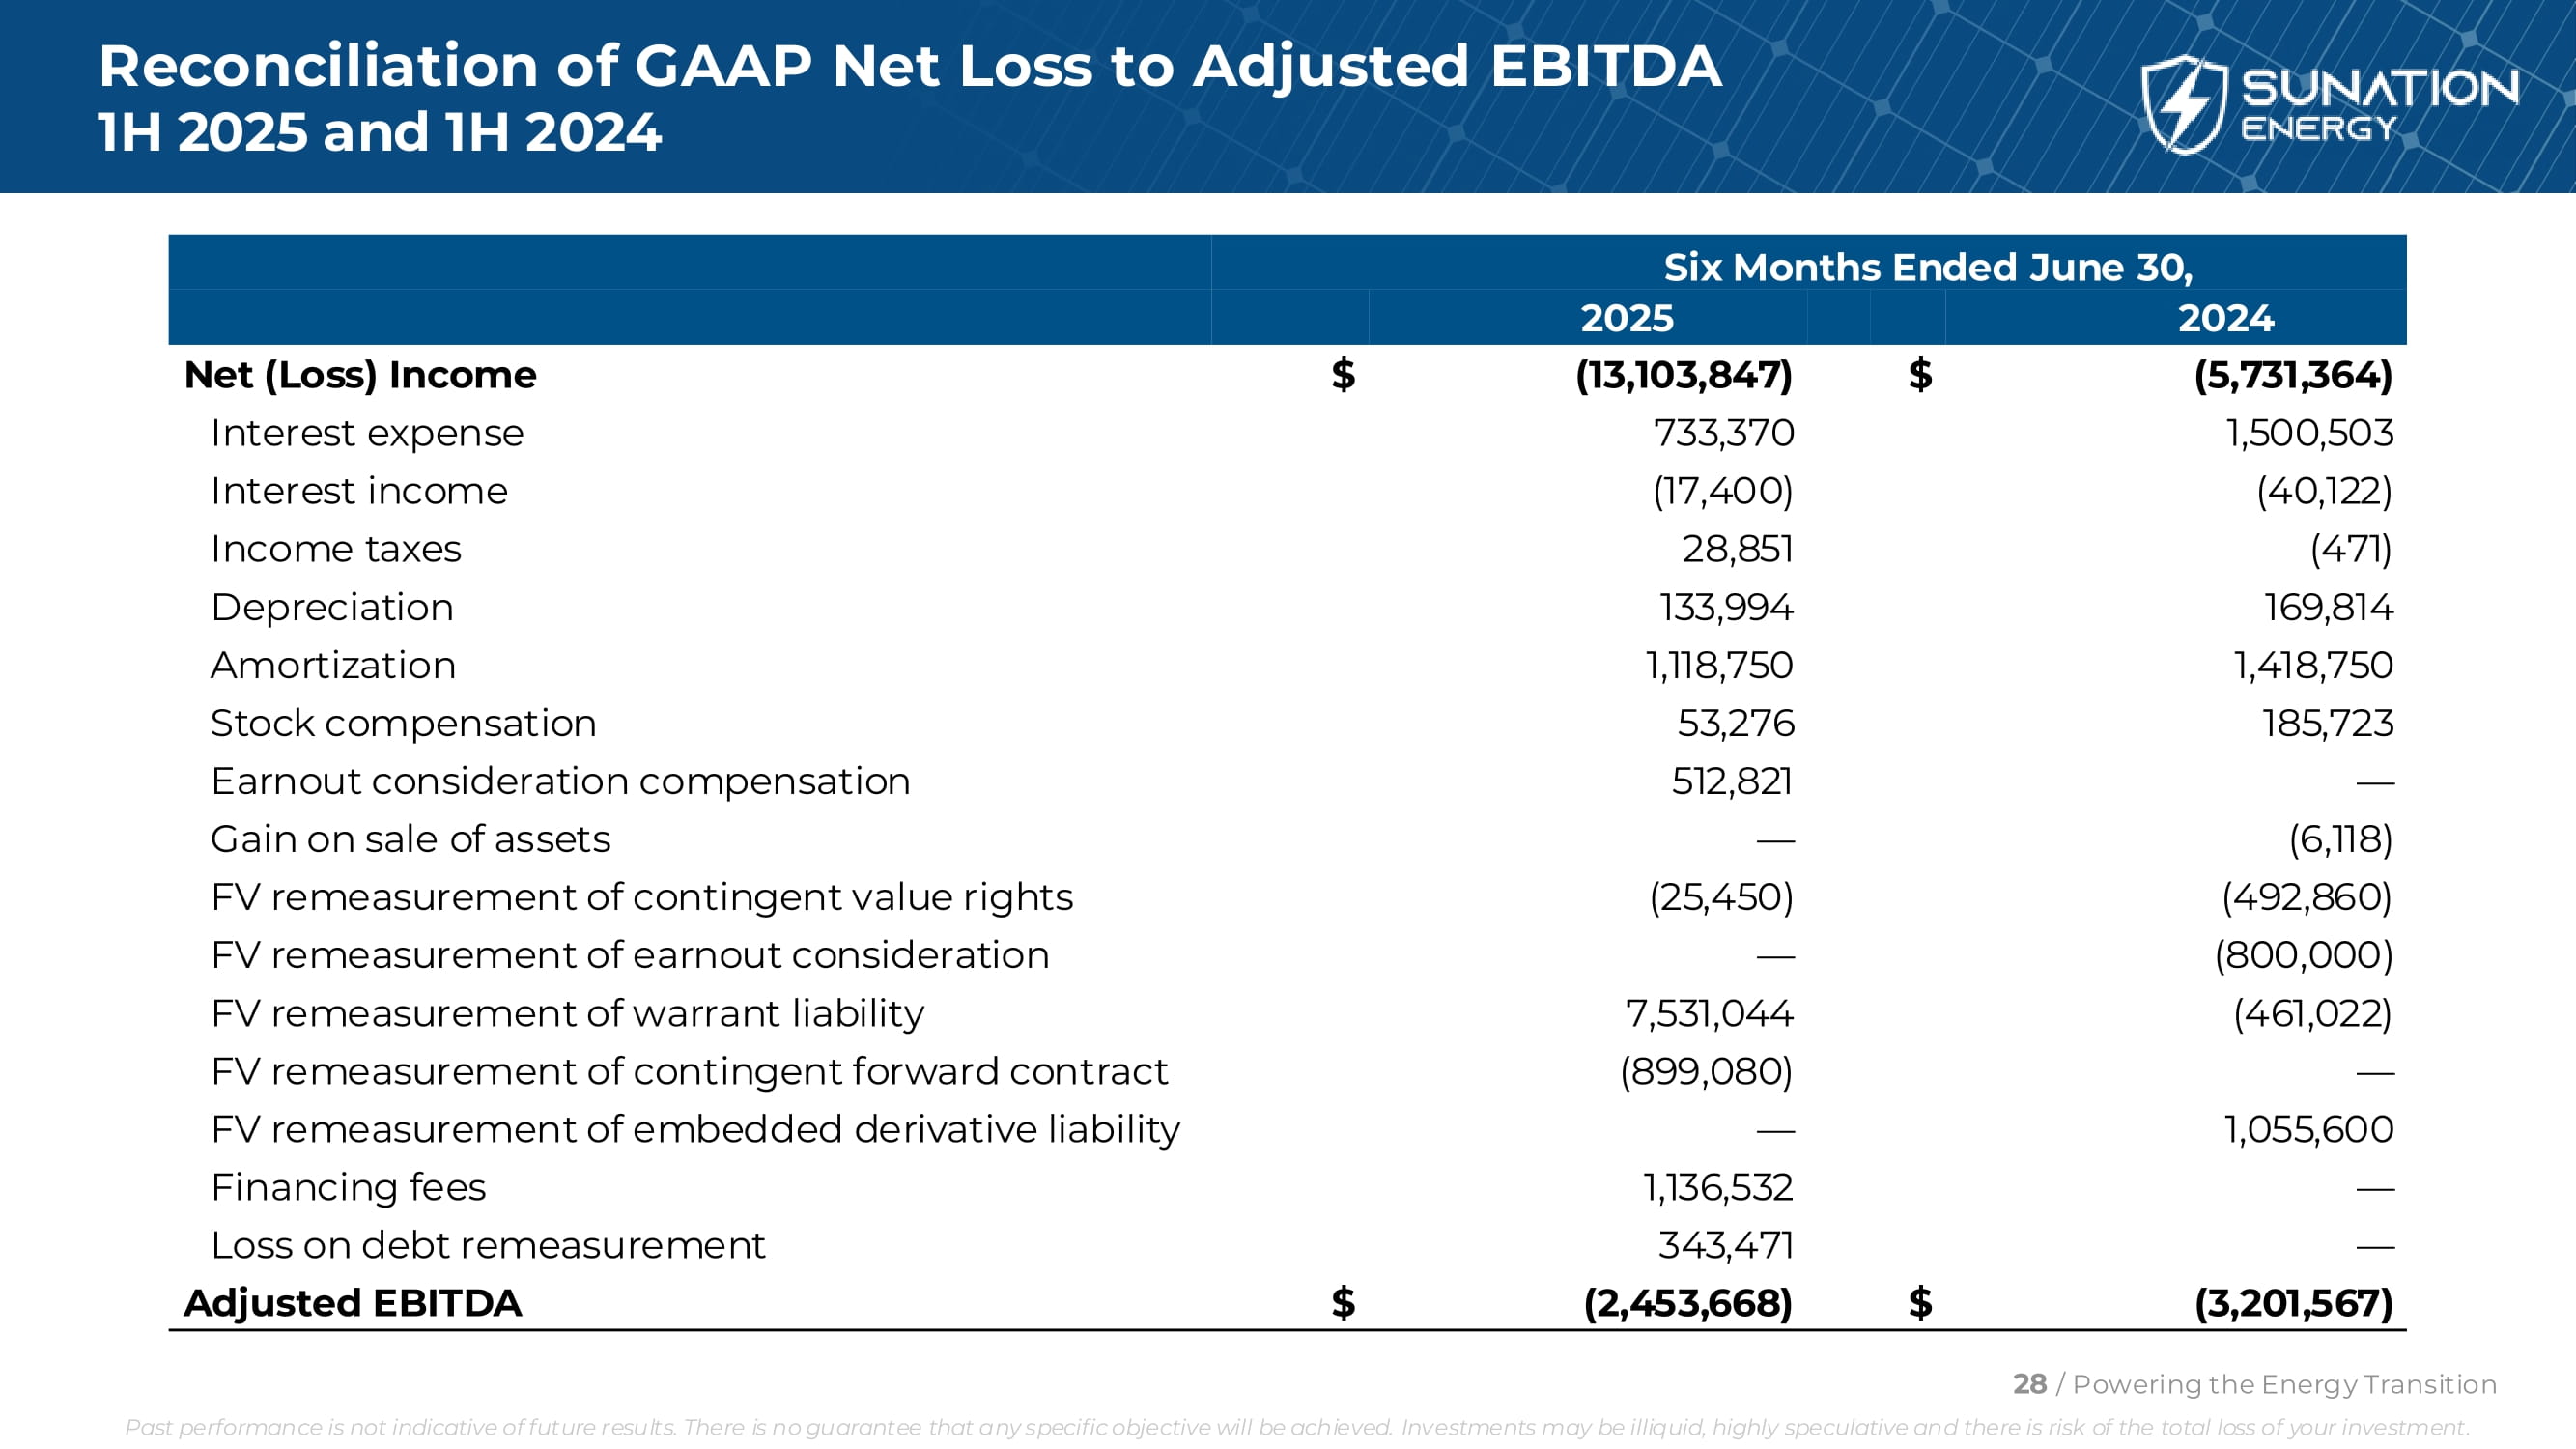
Reconciliation of GAAP Net Loss to Adjusted EBITDA 1H 2025 and 1H 2024 28 / Powering the Energy Transition Past performance is not indicative of future results. There is no guarantee that any specific objective will be achieved. Investments may be illiquid, highly speculative and there is risk of the total loss of your investment. Six Months Ended June 30, 2024 2025 (5,731,364) $ (13,103,847) $ Net (Loss) Income 1,500,503 733,370 Interest expense (40,122) (17,400) Interest income (471) 28,851 Income taxes 169,814 133,994 Depreciation 1,418,750 1,118,750 Amortization 185,723 53,276 Stock compensation — 512,821 Earnout consideration compensation (6,118) — Gain on sale of assets (492,860) (25,450) FV remeasurement of contingent value rights (800,000) — FV remeasurement of earnout consideration (461,022) 7,531,044 FV remeasurement of warrant liability — (899,080) FV remeasurement of contingent forward contract 1,055,600 — FV remeasurement of embedded derivative liability — 1,136,532 Financing fees — 343,471 Loss on debt remeasurement (3,201,567) $ (2,453,668) $ Adjusted EBITDA