NYSE American: REI www.ringenergy.com www.ringenergy.com Q3 2026 EARNINGS DISCIPLINED PORTFOLIO MANAGEMENT DRIVING LONG-TERM VALUE
Ring Energy, Inc. Q3 2026 Earnings | November 6, 2026 | NYSE American: REI Forward–Looking Statements This Presentation includes forward-looking statements within the meaning of Section 27A of the Securities Act of 1933, as amended, and Section 21E of the Securities Exchange Act of 1934, as amended. All statements, other than statements of historical fact included in this Presentation, regarding our strategy, future operations, financial position, estimated revenues and losses, projected costs, prospects, guidance, plans and objectives of management are forward- looking statements. When used in this Presentation, the words “could,” “may,” “will,” “believe,” “anticipate,” “intend,” “estimate,” “expect,” “guidance,” “project,” “goal,” “plan,” “potential,” “probably,” “strategy,” “target” and similar expressions are intended to identify forward-looking statements, although not all forward- looking statements contain such identifying words. Forward-looking statements also include assumptions and projections for 2026 and 2027 guidance for sales volumes, number of potential well locations and associated inventory life, oil, NGL and natural gas mix as a percentage of total sales, capital expenditures, and operating expenses and the projected impacts thereon, and the number of wells expected to be drilled and completed. These forward-looking statements are based on management’s current expectations and assumptions about future events and are based on currently available information as to the outcome and timing of future events. However, whether actual results and developments will conform to expectations is subject to a number of material risks and uncertainties, including but not limited to: declines in oil, natural gas liquids or natural gas prices; the level of success in exploration, development and production activities; adverse weather conditions that may negatively impact development or production activities particularly in the winter; the timing of exploration and development expenditures; inaccuracies of reserve estimates or assumptions underlying them; revisions to reserve estimates as a result of changes in commodity prices; impacts to financial statements as a result of impairment write-downs; risks related to level of indebtedness and periodic redeterminations of the borrowing base and interest rates under the Company’s credit facility; Ring’s ability to generate sufficient cash flows from operations to meet the internally funded portion of its capital expenditures budget; the impacts of hedging on results of operations; the effects of future regulatory or legislative actions; cost and availability of transportation and storage capacity as a result of natural gas oversupply, changes in U.S. energy, environmental, monetary and trade policies, including with respect to tariffs or other trade barriers, and any resulting trade tensions; political instability or armed conflict in major oil and natural gas producing regions outside the United States, including military hostilities in the Middle East (including the recent conflict between the United States and Iran), Russia, and Ukraine; and Ring’s ability to replace oil and natural gas reserves. Such statements are subject to certain risks and uncertainties that are disclosed in the Company’s reports filed with the Securities and Exchange Commission (“SEC”), including its Form 10-K for the fiscal year ended December 31, 2025, and its other filings with the SEC. All forward-looking statements, expressed or implied, included in this Presentation are expressly qualified by the cautionary statements and by reference to the underlying assumptions that may prove to be incorrect. The Company undertakes no obligation to revise these forward-looking statements to reflect events or circumstances that arise after the date hereof, except as required by applicable law. The financial and operating estimates contained in this Presentation represent our reasonable estimates as of the date of this Presentation. Neither our independent auditors nor any other third party has examined, reviewed or compiled the estimates and, accordingly, none of the foregoing expresses an opinion or other form of assurance with respect thereto. The assumptions upon which the estimates are based are described in more detail herein. Some of these assumptions inevitably will not materialize, and unanticipated events may occur that could affect our results. Therefore, our actual results achieved during the periods covered by the estimates will vary from the estimated results. Investors are not to place undue reliance on the estimates included herein. 2 Supplemental Non-GAAP Financial Measures This Presentation includes financial measures that are not in accordance with accounting principles generally accepted in the United States (“GAAP”), such as “Adjusted Net Income”, “Adjusted EBITDA,” “PV-10,” “Adjusted Free Cash Flow” or “AFCF,” “Adjusted Cash Flow from Operations” or “ACFFO,” “Cash Return on Capital Employed” or “CROCE,” “Leverage Ratio,” “Consolidated Total Debt to LQA Consolidated EBITDAX,” “All-in Cash Operating Costs,” and “Cash Operating Margin.” While management believes that such measures are useful for investors, they should not be used as a replacement for financial measures that are in accordance with GAAP. See Appendix for definitions and reconciliation to GAAP measures. Forward-Looking Statements and Supplemental Non-GAAP Financial Measures
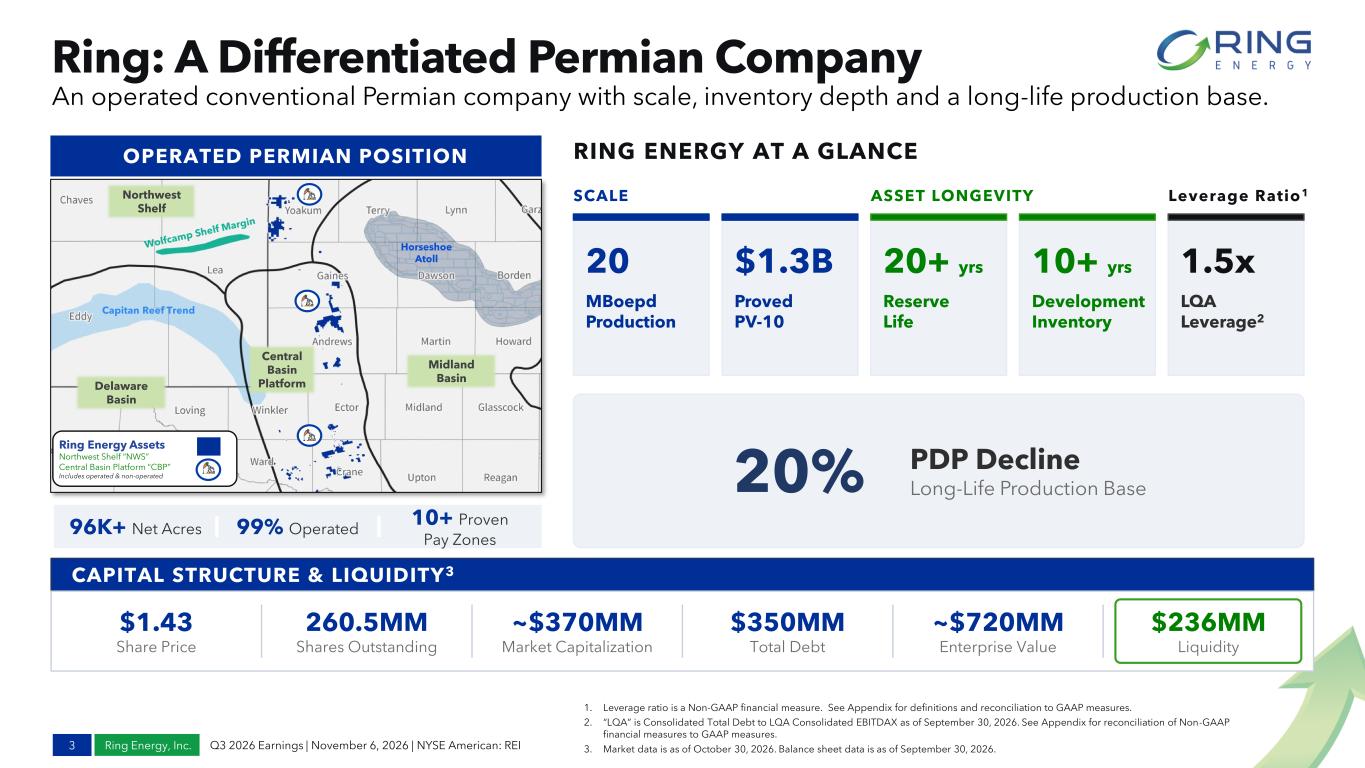
Ring Energy, Inc. Q3 2026 Earnings | November 6, 2026 | NYSE American: REI OPERATED PERMIAN POSITION Ring: A Differentiated Permian Company 3 An operated conventional Permian company with scale, inventory depth and a long-life production base. 1. Leverage ratio is a Non-GAAP financial measure. See Appendix for definitions and reconciliation to GAAP measures. 2. “LQA” is Consolidated Total Debt to LQA Consolidated EBITDAX as of September 30, 2026. See Appendix for reconciliation of Non-GAAP financial measures to GAAP measures. 3. Market data is as of October 30, 2026. Balance sheet data is as of September 30, 2026. CAPITAL STRUCTURE & LIQUIDITY3 $1.43 Share Price 260.5MM Shares Outstanding ~$370MM Market Capitalization $350MM Total Debt ~$720MM Enterprise Value $236MM Liquidity 96K+ Net Acres 99% Operated 10+ Proven Pay Zones RING ENERGY AT A GLANCE 20% PDP Decline Long-Life Production Base ASSET LONGEVITY 20+ yrs Reserve Life 10+ yrs Development Inventory Leverage Ratio1 1.5x LQA Leverage2 SCALE 20 MBoepd Production $1.3B Proved PV-10 Ring Energy Assets Northwest Shelf “NWS” Central Basin Platform “CBP” Includes operated & non-operated Horseshoe Atoll Capitan Reef Trend Northwest Shelf Delaware Basin Midland Basin Central Basin Platform
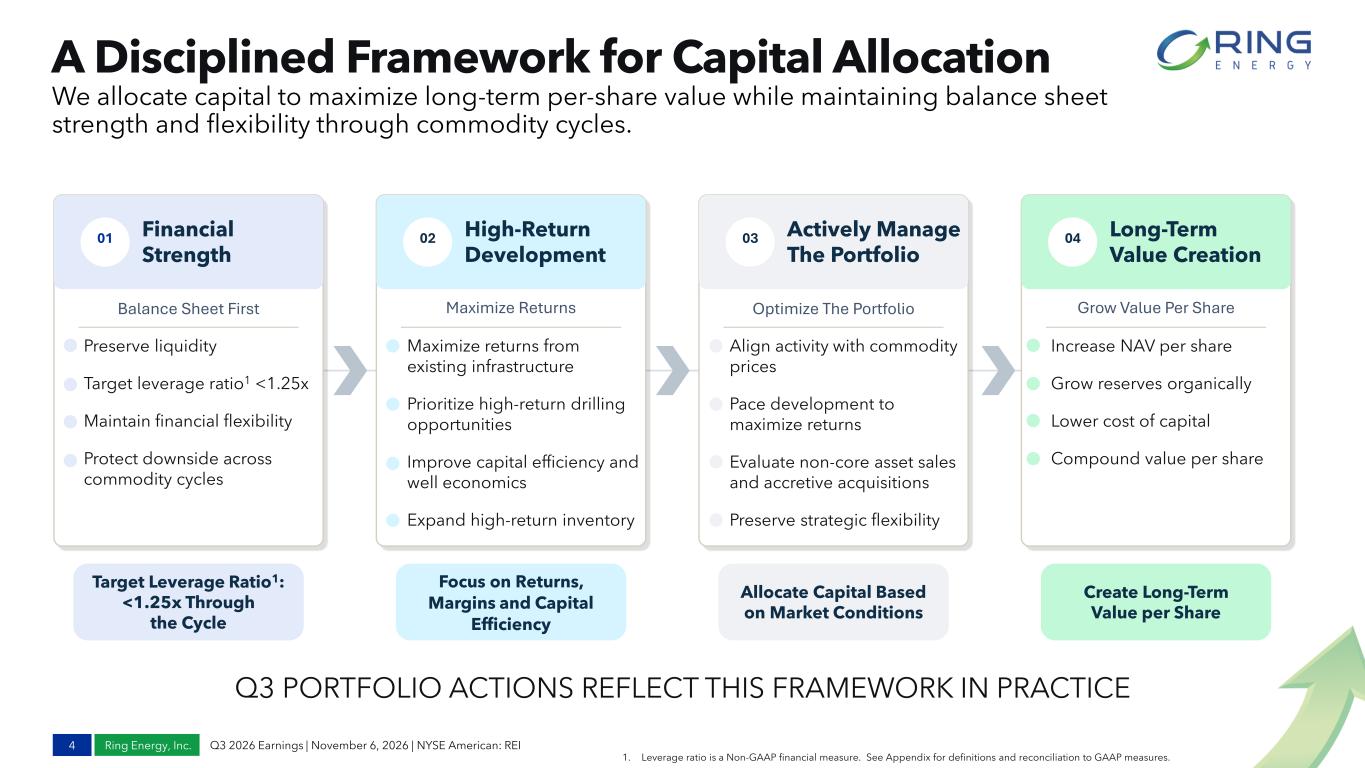
Ring Energy, Inc. Q3 2026 Earnings | November 6, 2026 | NYSE American: REI A Disciplined Framework for Capital Allocation 4 We allocate capital to maximize long-term per-share value while maintaining balance sheet strength and flexibility through commodity cycles. 1. Leverage ratio is a Non-GAAP financial measure. See Appendix for definitions and reconciliation to GAAP measures. Create Long-Term Value per Share Target Leverage Ratio1: <1.25x Through the Cycle 01 Financial Strength Balance Sheet First • Preserve liquidity • Target leverage ratio1 <1.25x • Maintain financial flexibility • Protect downside across commodity cycles Focus on Returns, Margins and Capital Efficiency 02 High-Return Development Maximize Returns Allocate Capital Based on Market Conditions 03 Actively Manage The Portfolio Optimize The Portfolio 04 Long-Term Value Creation Grow Value Per Share • Maximize returns from existing infrastructure • Prioritize high-return drilling opportunities • Improve capital efficiency and well economics • Expand high-return inventory • Align activity with commodity prices • Pace development to maximize returns • Evaluate non-core asset sales and accretive acquisitions • Preserve strategic flexibility • Increase NAV per share • Grow reserves organically • Lower cost of capital • Compound value per share Q3 PORTFOLIO ACTIONS REFLECT THIS FRAMEWORK IN PRACTICE
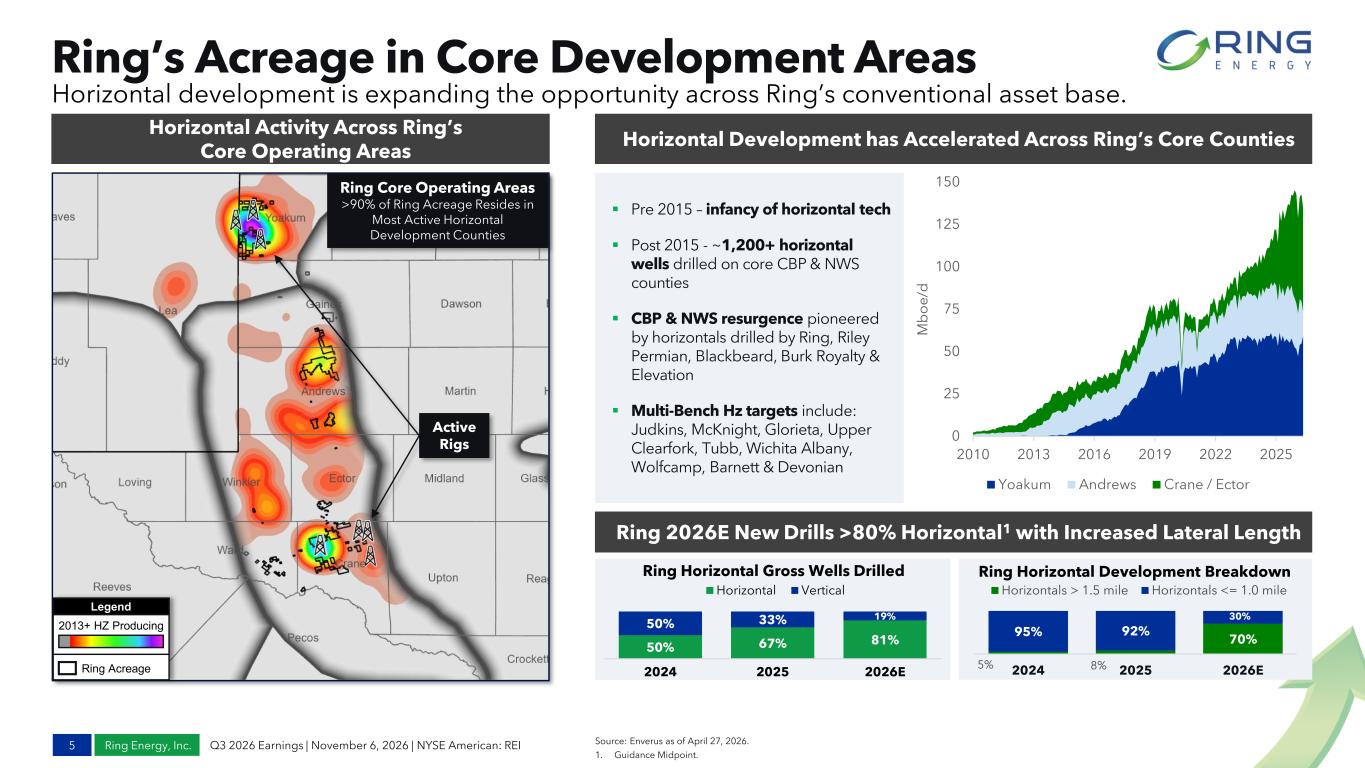
Ring Energy, Inc. Q3 2026 Earnings | November 6, 2026 | NYSE American: REI 5% 8% 70% 95% 92% 30% 2024 2025 2026E Horizontals > 1.5 mile Horizontals <= 1.0 mile Ring’s Acreage in Core Development Areas 5 Horizontal development is expanding the opportunity across Ring’s conventional asset base. Source: Enverus as of April 27, 2026. 1. Guidance Midpoint. Ring 2026E New Drills >80% Horizontal1 with Increased Lateral Length Horizontal Activity Across Ring’s Core Operating Areas Legend 2013+ HZ Producing Ring Acreage Active Rigs Ring Core Operating Areas >90% of Ring Acreage Resides in Most Active Horizontal Development Counties 50% 67% 81% 50% 33% 19% 2024 2025 2026E Ring Horizontal Gross Wells Drilled Horizontal Vertical Ring Horizontal Development Breakdown Horizontal Development has Accelerated Across Ring’s Core Counties 0 25 50 75 100 125 150 2010 2013 2016 2019 2022 2025 M b o e /d Yoakum Andrews Crane / Ector ▪ Pre 2015 – infancy of horizontal tech ▪ Post 2015 - ~1,200+ horizontal wells drilled on core CBP & NWS counties ▪ CBP & NWS resurgence pioneered by horizontals drilled by Ring, Riley Permian, Blackbeard, Burk Royalty & Elevation ▪ Multi-Bench Hz targets include: Judkins, McKnight, Glorieta, Upper Clearfork, Tubb, Wichita Albany, Wolfcamp, Barnett & Devonian
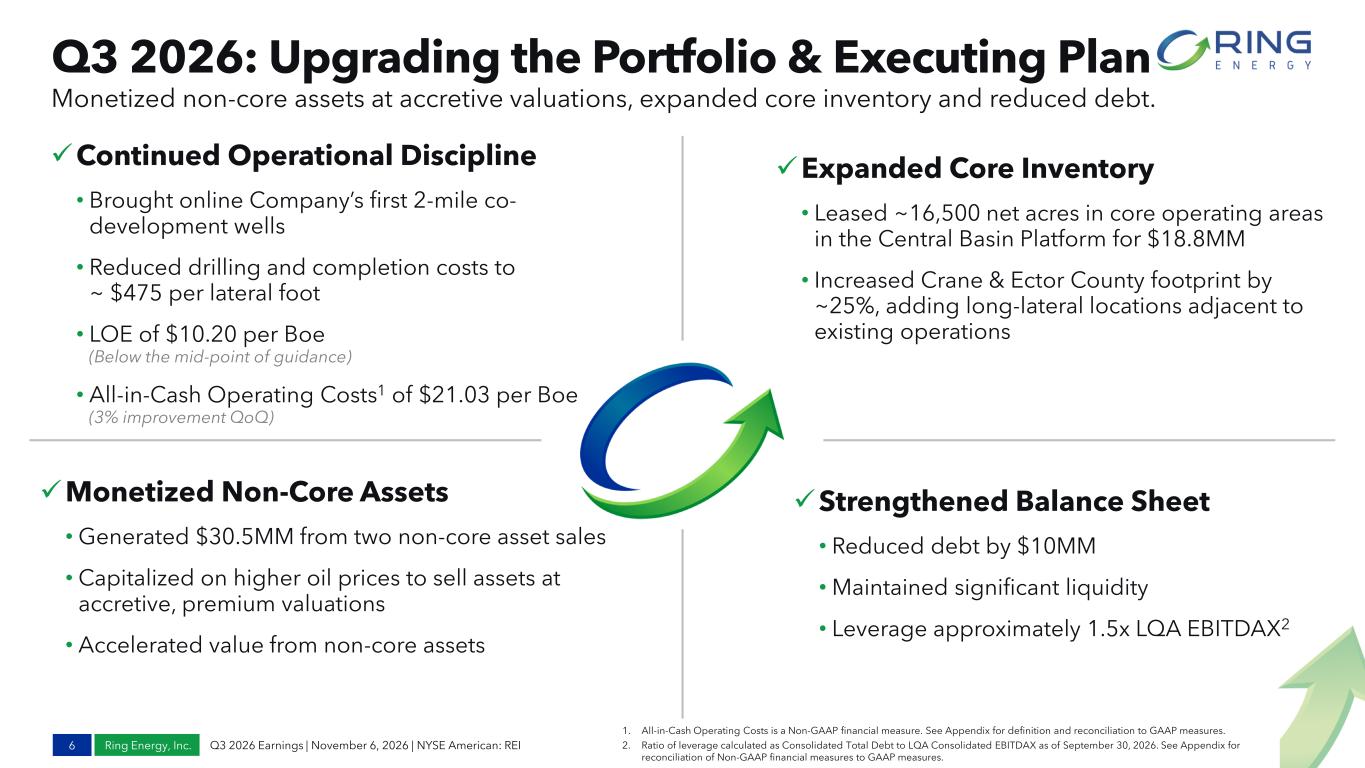
Ring Energy, Inc. Q3 2026 Earnings | November 6, 2026 | NYSE American: REI ✓Strengthened Balance Sheet • Reduced debt by $10MM • Maintained significant liquidity • Leverage approximately 1.5x LQA EBITDAX2 Q3 2026: Upgrading the Portfolio & Executing Plan 6 1. All-in-Cash Operating Costs is a Non-GAAP financial measure. See Appendix for definition and reconciliation to GAAP measures. 2. Ratio of leverage calculated as Consolidated Total Debt to LQA Consolidated EBITDAX as of September 30, 2026. See Appendix for reconciliation of Non-GAAP financial measures to GAAP measures. ✓Continued Operational Discipline • Brought online Company’s first 2-mile co- development wells • Reduced drilling and completion costs to ~ $475 per lateral foot • LOE of $10.20 per Boe (Below the mid-point of guidance) • All-in-Cash Operating Costs1 of $21.03 per Boe (3% improvement QoQ) ✓Expanded Core Inventory • Leased ~16,500 net acres in core operating areas in the Central Basin Platform for $18.8MM • Increased Crane & Ector County footprint by ~25%, adding long-lateral locations adjacent to existing operations ✓Monetized Non-Core Assets • Generated $30.5MM from two non-core asset sales • Capitalized on higher oil prices to sell assets at accretive, premium valuations • Accelerated value from non-core assets Monetized non-core assets at accretive valuations, expanded core inventory and reduced debt.
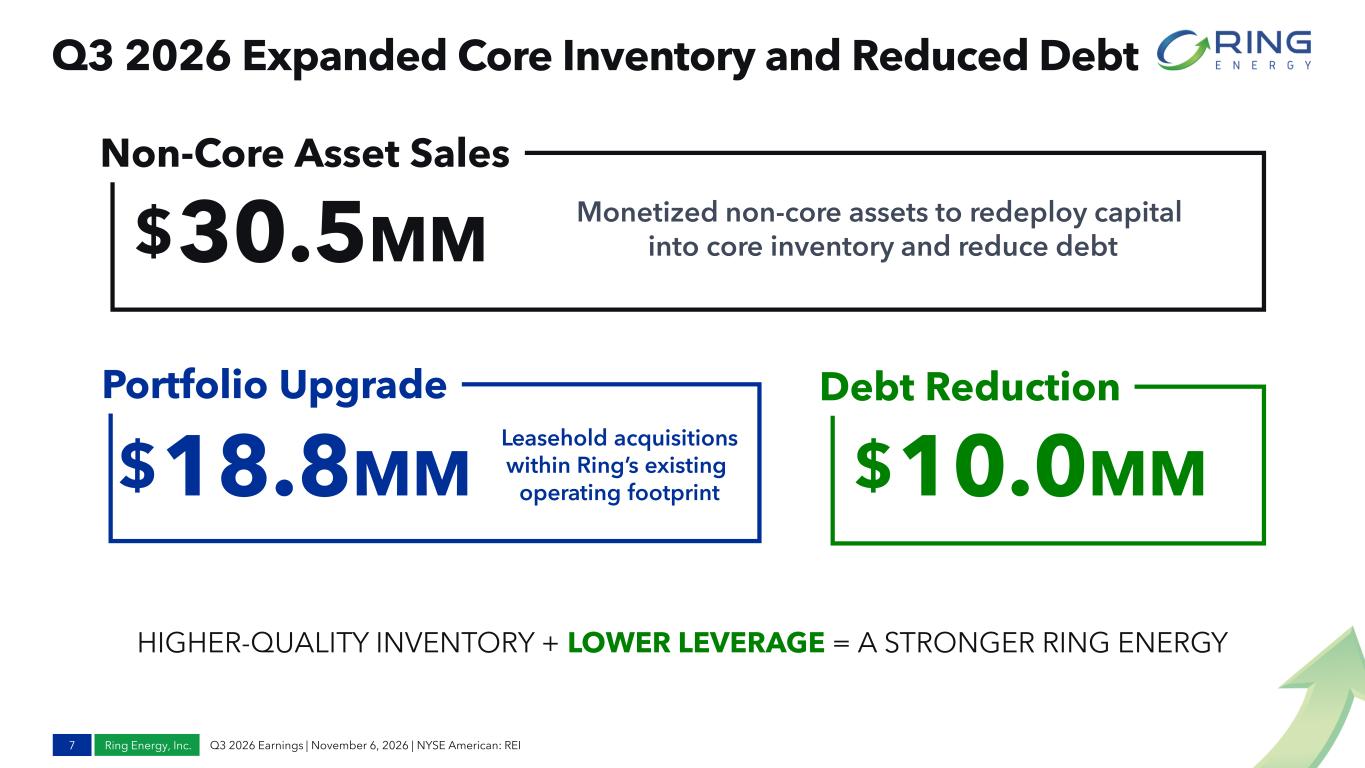
Ring Energy, Inc. Q3 2026 Earnings | November 6, 2026 | NYSE American: REI Q3 2026 Expanded Core Inventory and Reduced Debt 7 10.0MM$18.8MM$ Leasehold acquisitions within Ring’s existing operating footprint Portfolio Upgrade Debt Reduction 30.5MM$ Monetized non-core assets to redeploy capital into core inventory and reduce debt Non-Core Asset Sales HIGHER-QUALITY INVENTORY + LOWER LEVERAGE = A STRONGER RING ENERGY
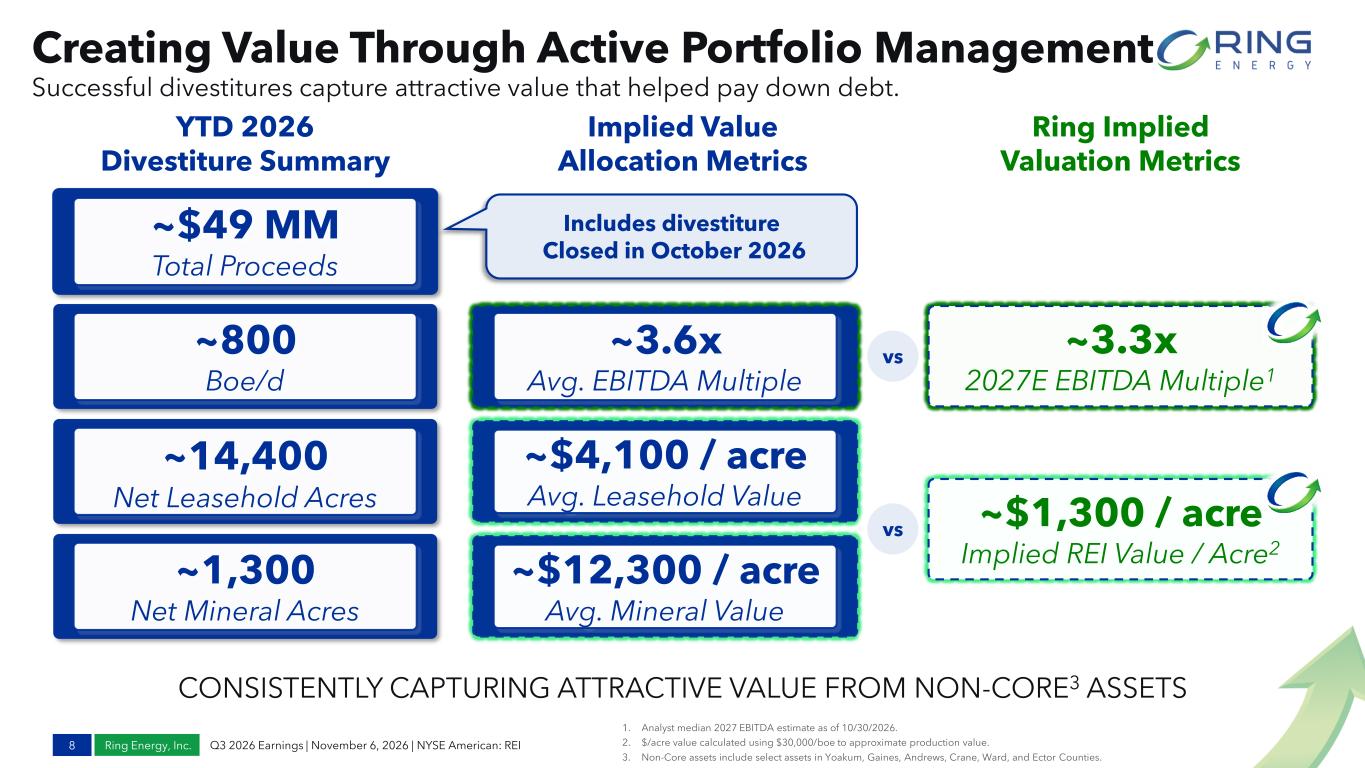
Ring Energy, Inc. Q3 2026 Earnings | November 6, 2026 | NYSE American: REI ~3.3x 2027E EBITDA Multiple1 Creating Value Through Active Portfolio Management Successful divestitures capture attractive value that helped pay down debt. 8 ~$49 MM Total Proceeds ~800 Boe/d ~3.6x Avg. EBITDA Multiple ~$4,100 / acre Avg. Leasehold Value ~$1,300 / acre Implied REI Value / Acre2 YTD 2026 Divestiture Summary Implied Value Allocation Metrics Ring Implied Valuation Metrics vs vs 1. Analyst median 2027 EBITDA estimate as of 10/30/2026. 2. $/acre value calculated using $30,000/boe to approximate production value. 3. Non-Core assets include select assets in Yoakum, Gaines, Andrews, Crane, Ward, and Ector Counties. ~14,400 Net Leasehold Acres ~1,300 Net Mineral Acres ~$12,300 / acre Avg. Mineral Value Includes divestiture Closed in October 2026 CONSISTENTLY CAPTURING ATTRACTIVE VALUE FROM NON-CORE3 ASSETS
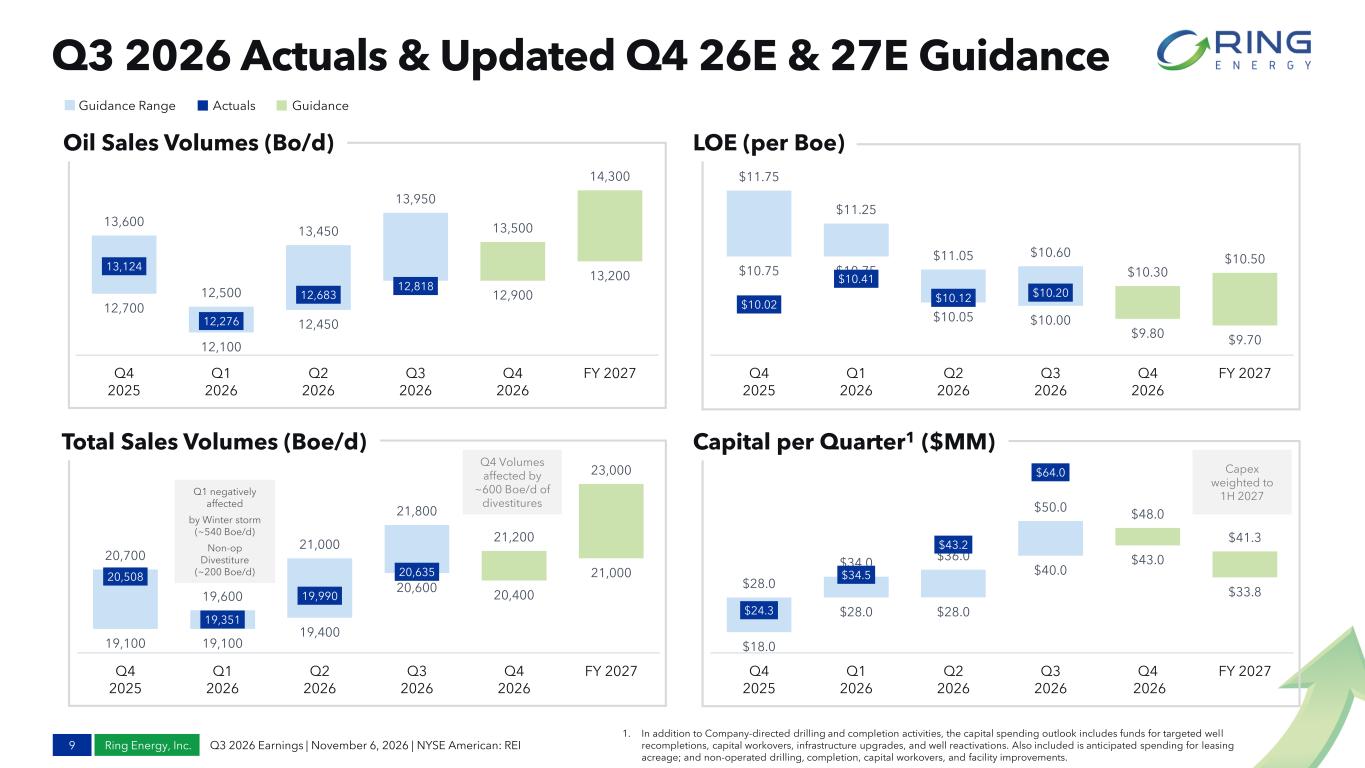
Ring Energy, Inc. Q3 2026 Earnings | November 6, 2026 | NYSE American: REI LOE (per Boe) Q3 2026 Actuals & Updated Q4 26E & 27E Guidance 1. In addition to Company-directed drilling and completion activities, the capital spending outlook includes funds for targeted well recompletions, capital workovers, infrastructure upgrades, and well reactivations. Also included is anticipated spending for leasing acreage; and non-operated drilling, completion, capital workovers, and facility improvements. 12,700 12,100 12,450 12,900 13,200 13,600 12,500 13,450 13,950 13,500 14,300 13,124 12,276 12,683 12,818 Q4 2025 Q1 2026 Q2 2026 Q3 2026 Q4 2026 FY 2027 19,100 19,100 19,400 20,600 20,400 21,000 20,700 19,600 21,000 21,800 21,200 23,000 20,508 19,351 19,990 20,635 Q4 2025 Q1 2026 Q2 2026 Q3 2026 Q4 2026 FY 2027 $10.75 $10.75 $10.05 $10.00 $9.80 $9.70 $11.75 $11.25 $11.05 $10.60 $10.30 $10.50 $10.02 $10.41 $10.12 $10.20 Q4 2025 Q1 2026 Q2 2026 Q3 2026 Q4 2026 FY 2027 Oil Sales Volumes (Bo/d) Total Sales Volumes (Boe/d) $18.0 $28.0 $28.0 $40.0 $43.0 $33.8 $28.0 $34.0 $36.0 $50.0 $48.0 $41.3 $24.3 $34.5 $43.2 $64.0 Q4 2025 Q1 2026 Q2 2026 Q3 2026 Q4 2026 FY 2027 Capital per Quarter1 ($MM) Guidance Range Actuals Guidance 9 Q4 Volumes affected by ~600 Boe/d of divestitures Capex weighted to 1H 2027Q1 negatively affected by Winter storm (~540 Boe/d) Non-op Divestiture (~200 Boe/d)
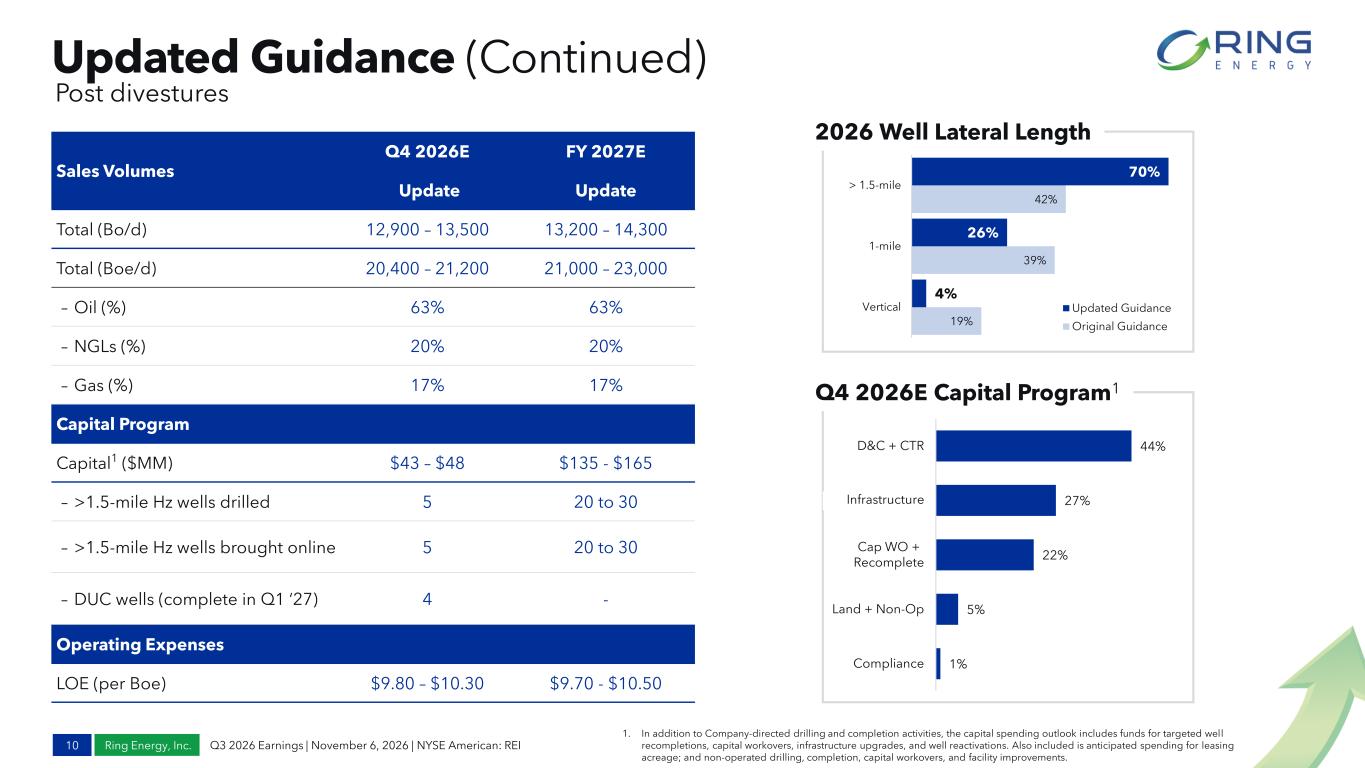
Ring Energy, Inc. Q3 2026 Earnings | November 6, 2026 | NYSE American: REI Updated Guidance (Continued) 10 1. In addition to Company-directed drilling and completion activities, the capital spending outlook includes funds for targeted well recompletions, capital workovers, infrastructure upgrades, and well reactivations. Also included is anticipated spending for leasing acreage; and non-operated drilling, completion, capital workovers, and facility improvements. Sales Volumes Q4 2026E FY 2027E Update Update Total (Bo/d) 12,900 – 13,500 13,200 – 14,300 Total (Boe/d) 20,400 – 21,200 21,000 – 23,000 – Oil (%) 63% 63% – NGLs (%) 20% 20% – Gas (%) 17% 17% Capital Program Capital1 ($MM) $43 – $48 $135 - $165 – >1.5-mile Hz wells drilled 5 20 to 30 – >1.5-mile Hz wells brought online 5 20 to 30 – DUC wells (complete in Q1 ‘27) 4 - Operating Expenses LOE (per Boe) $9.80 – $10.30 $9.70 - $10.50 Q4 2026E Capital Program1 19% 39% 42% 4% 26% 70% Vertical 1-mile > 1.5-mile Updated Guidance Original Guidance 2026 Well Lateral Length Post divestures 1% 5% 22% 27% 44% Compliance Land + Non-Op Cap WO + Recomplete Infrastucture D&C + CTR Infrastr
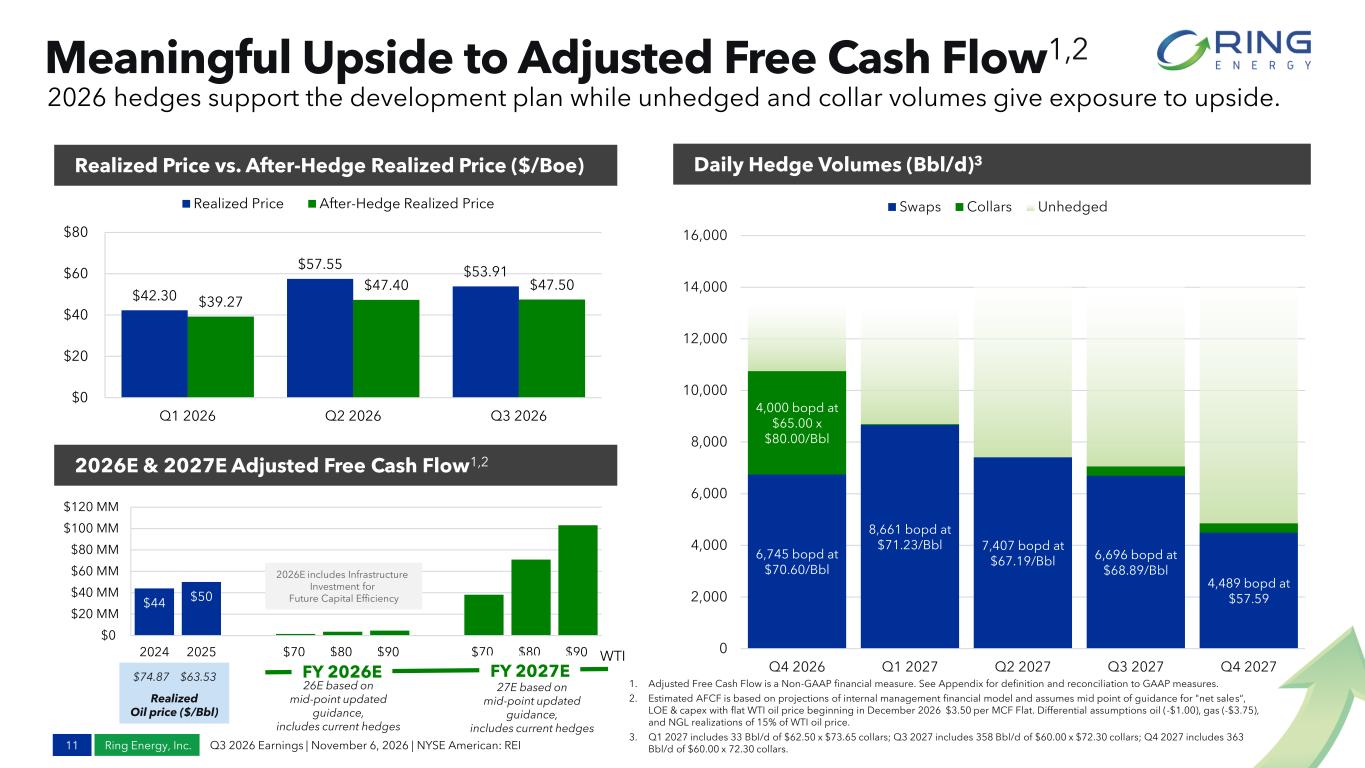
Ring Energy, Inc. Q3 2026 Earnings | November 6, 2026 | NYSE American: REI $44 $50 $0 $20 MM $40 MM $60 MM $80 MM $100 MM $120 MM 2024 2025 $70 $80 $90 $70 $80 $90 6,745 bopd at $70.60/Bbl 8,661 bopd at $71.23/Bbl 7,407 bopd at $67.19/Bbl 6,696 bopd at $68.89/Bbl 4,489 bopd at $57.59 4,000 bopd at $65.00 x $80.00/Bbl 0 2,000 4,000 6,000 8,000 10,000 12,000 14,000 16,000 Q4 2026 Q1 2027 Q2 2027 Q3 2027 Q4 2027 Swaps Collars Unhedged Meaningful Upside to Adjusted Free Cash Flow1,2 11 2026 hedges support the development plan while unhedged and collar volumes give exposure to upside. 1. Adjusted Free Cash Flow is a Non-GAAP financial measure. See Appendix for definition and reconciliation to GAAP measures. 2. Estimated AFCF is based on projections of internal management financial model and assumes mid point of guidance for "net sales“, LOE & capex with flat WTI oil price beginning in December 2026 $3.50 per MCF Flat. Differential assumptions oil (-$1.00), gas (-$3.75), and NGL realizations of 15% of WTI oil price. 3. Q1 2027 includes 33 Bbl/d of $62.50 x $73.65 collars; Q3 2027 includes 358 Bbl/d of $60.00 x $72.30 collars; Q4 2027 includes 363 Bbl/d of $60.00 x 72.30 collars. Realized Price vs. After-Hedge Realized Price ($/Boe) 2026E & 2027E Adjusted Free Cash Flow1,2 Daily Hedge Volumes (Bbl/d)3 FY 2026E WTI FY 2027E Realized Oil price ($/Bbl) $74.87 $63.53 26E based on mid-point updated guidance, includes current hedges 27E based on mid-point updated guidance, includes current hedges $42.30 $57.55 $53.91 $39.27 $47.40 $47.50 $0 $20 $40 $60 $80 Q1 2026 Q2 2026 Q3 2026 Realized Price After-Hedge Realized Price 2026E includes Infrastructure Investment for Future Capital Efficiency
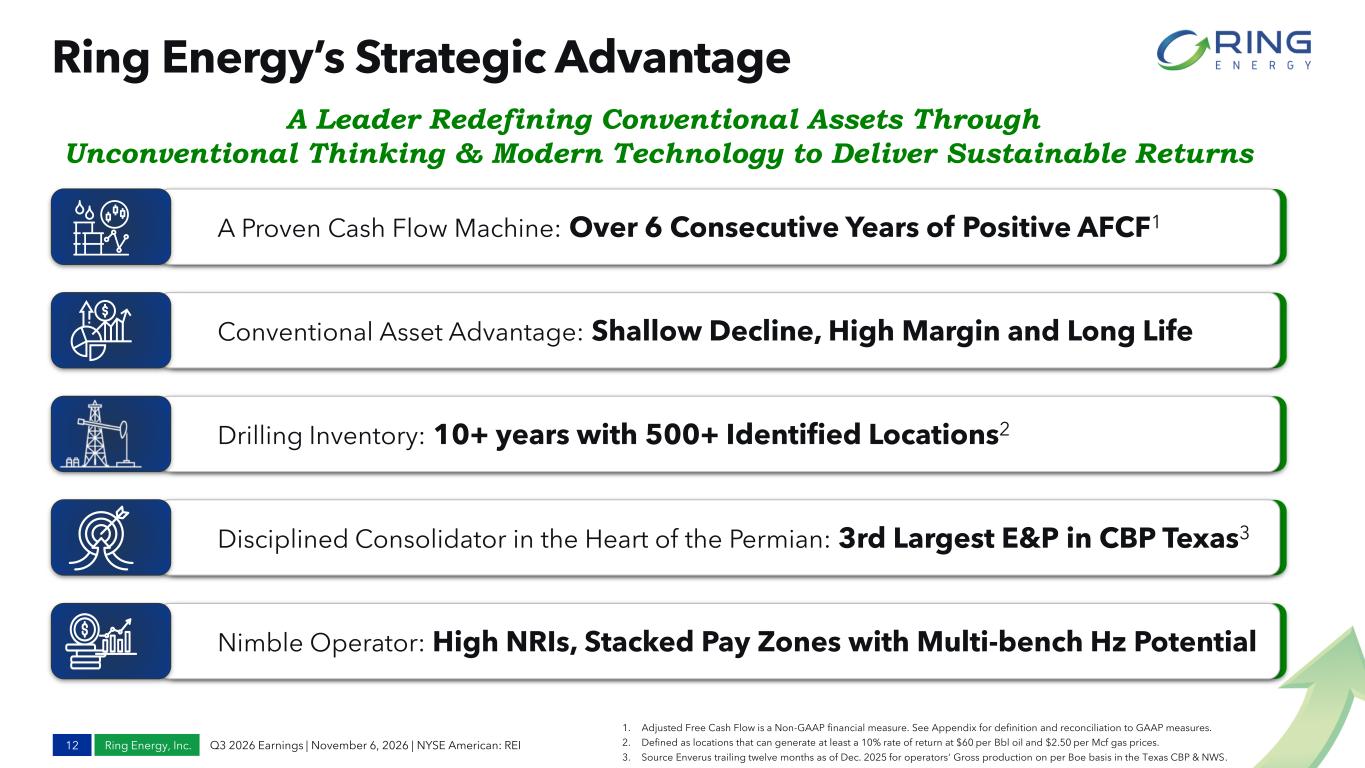
Ring Energy, Inc. Q3 2026 Earnings | November 6, 2026 | NYSE American: REI Ring Energy’s Strategic Advantage 12 1. Adjusted Free Cash Flow is a Non-GAAP financial measure. See Appendix for definition and reconciliation to GAAP measures. 2. Defined as locations that can generate at least a 10% rate of return at $60 per Bbl oil and $2.50 per Mcf gas prices. 3. Source Enverus trailing twelve months as of Dec. 2025 for operators' Gross production on per Boe basis in the Texas CBP & NWS. A Proven Cash Flow Machine: Over 6 Consecutive Years of Positive AFCF1 Conventional Asset Advantage: Shallow Decline, High Margin and Long Life Drilling Inventory: 10+ years with 500+ Identified Locations2 Disciplined Consolidator in the Heart of the Permian: 3rd Largest E&P in CBP Texas3 Nimble Operator: High NRIs, Stacked Pay Zones with Multi-bench Hz Potential A Leader Redefining Conventional Assets Through Unconventional Thinking & Modern Technology to Deliver Sustainable Returns
www.ringenergy.com | NYSE American: REI Q3 2026 EARNINGS | NOVEMBER 6, 2026 OPERATIONAL IMPROVEMENTS 13
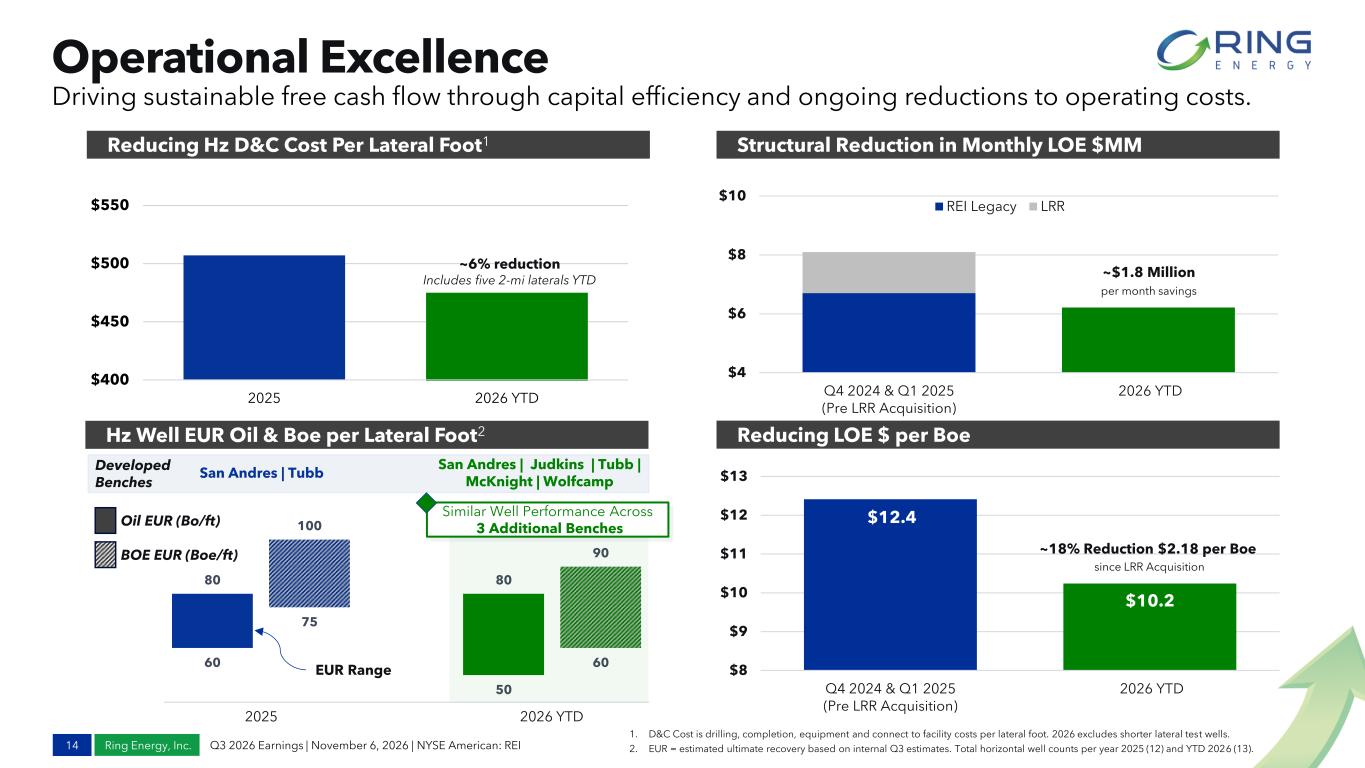
Ring Energy, Inc. Q3 2026 Earnings | November 6, 2026 | NYSE American: REI 60 75 50 60 80 100 80 90 $4 $6 $8 $10 Q4 2024 & Q1 2025 (Pre LRR Acquisition) 2026 YTD REI Legacy LRR Operational Excellence 14 Driving sustainable free cash flow through capital efficiency and ongoing reductions to operating costs. 1. D&C Cost is drilling, completion, equipment and connect to facility costs per lateral foot. 2026 excludes shorter lateral test wells. 2. EUR = estimated ultimate recovery based on internal Q3 estimates. Total horizontal well counts per year 2025 (12) and YTD 2026 (13). Reducing Hz D&C Cost Per Lateral Foot1 Hz Well EUR Oil & Boe per Lateral Foot2 Structural Reduction in Monthly LOE $MM Reducing LOE $ per Boe Includes Founders Acquisition $400 $450 $500 $550 2025 2026 YTD ~6% reduction Includes five 2-mi laterals YTD ~$1.8 Million per month savings $12.4 $10.2 $8 $9 $10 $11 $12 $13 Q4 2024 & Q1 2025 (Pre LRR Acquisition) 2026 YTD ~18% Reduction $2.18 per Boe since LRR Acquisition 2025 2026 YTD Developed Benches San Andres | Tubb San Andres | Judkins | Tubb | McKnight | Wolfcamp Oil EUR (Bo/ft) BOE EUR (Boe/ft) EUR Range Similar Well Performance Across 3 Additional Benches
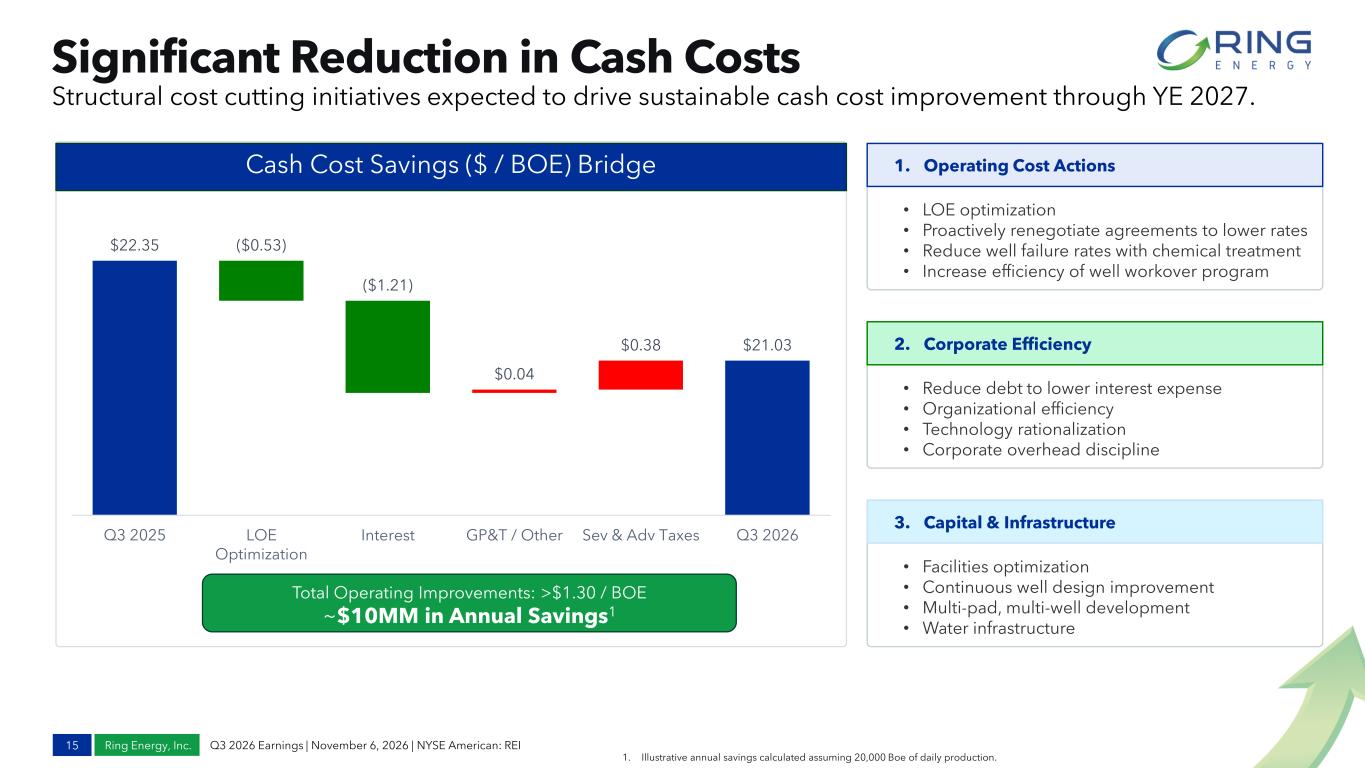
Ring Energy, Inc. Q3 2026 Earnings | November 6, 2026 | NYSE American: REI Significant Reduction in Cash Costs 15 Structural cost cutting initiatives expected to drive sustainable cash cost improvement through YE 2027. 1. Illustrative annual savings calculated assuming 20,000 Boe of daily production. 3. Capital & Infrastructure • Facilities optimization • Continuous well design improvement • Multi-pad, multi-well development • Water infrastructure 1. Operating Cost Actions • LOE optimization • Proactively renegotiate agreements to lower rates • Reduce well failure rates with chemical treatment • Increase efficiency of well workover program 2. Corporate Efficiency • Reduce debt to lower interest expense • Organizational efficiency • Technology rationalization • Corporate overhead discipline Cash Cost Savings ($ / BOE) Bridge Total Operating Improvements: >$1.30 / BOE ~$10MM in Annual Savings1 $22.35 ($0.53) ($1.21) $0.04 $0.38 $21.03 Q3 2025 LOE Optimization Interest GP&T / Other Sev & Adv Taxes Q3 2026
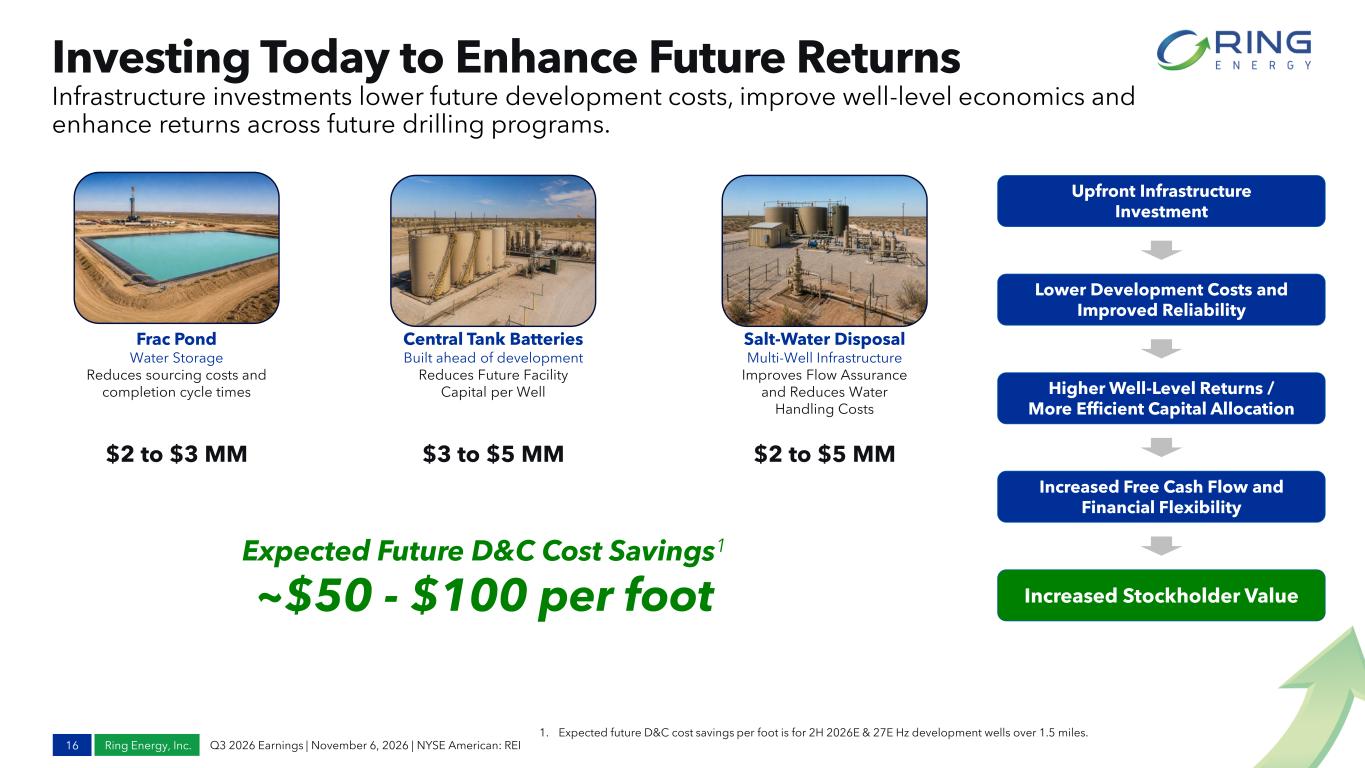
Ring Energy, Inc. Q3 2026 Earnings | November 6, 2026 | NYSE American: REI Investing Today to Enhance Future Returns 16 Infrastructure investments lower future development costs, improve well-level economics and enhance returns across future drilling programs. Expected Future D&C Cost Savings1 ~$50 - $100 per foot 1. Expected future D&C cost savings per foot is for 2H 2026E & 27E Hz development wells over 1.5 miles. Upfront Infrastructure Investment Lower Development Costs and Improved Reliability Higher Well-Level Returns / More Efficient Capital Allocation Increased Free Cash Flow and Financial Flexibility Increased Stockholder Value Frac Pond Water Storage Reduces sourcing costs and completion cycle times $2 to $3 MM Central Tank Batteries Built ahead of development Reduces Future Facility Capital per Well $3 to $5 MM Salt-Water Disposal Multi-Well Infrastructure Improves Flow Assurance and Reduces Water Handling Costs $2 to $5 MM
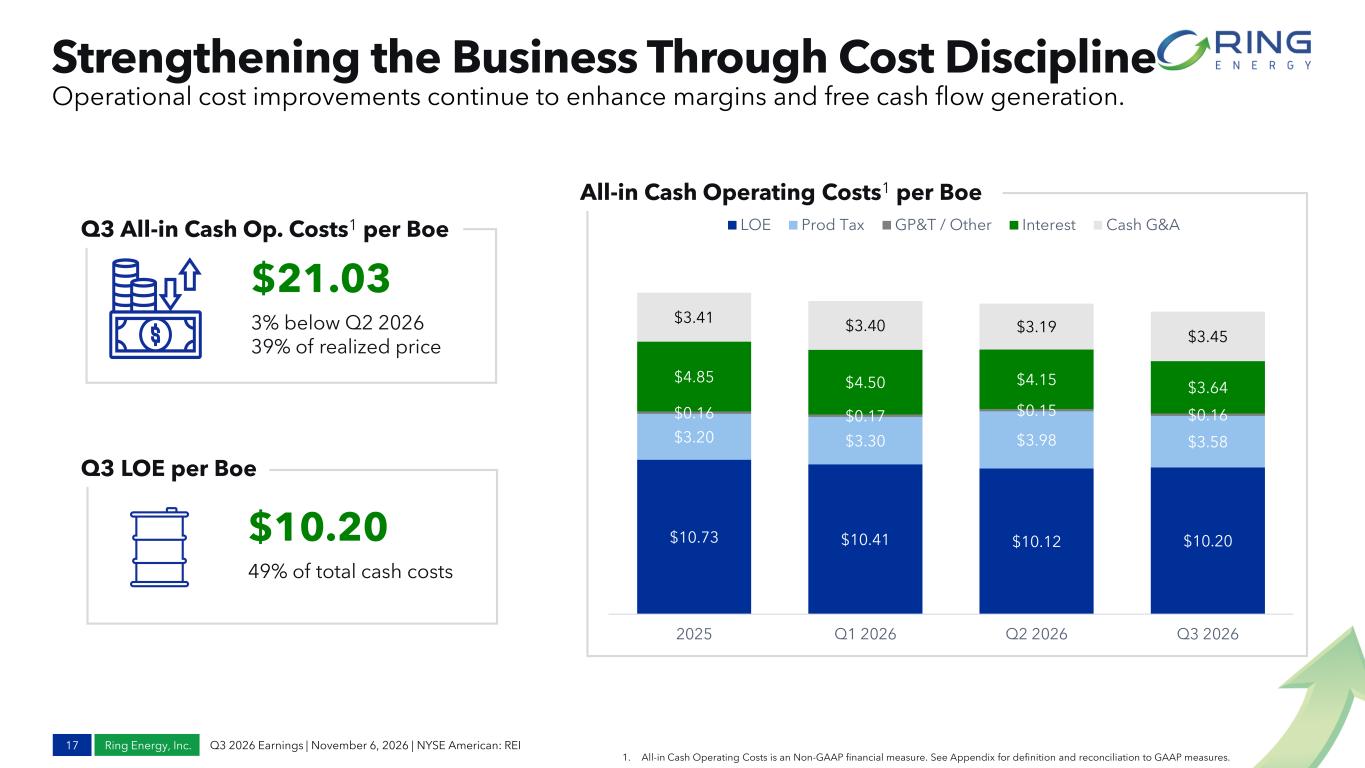
Ring Energy, Inc. Q3 2026 Earnings | November 6, 2026 | NYSE American: REI Strengthening the Business Through Cost Discipline 17 Operational cost improvements continue to enhance margins and free cash flow generation. 1. All-in Cash Operating Costs is an Non-GAAP financial measure. See Appendix for definition and reconciliation to GAAP measures. $21.03 3% below Q2 2026 39% of realized price Q3 All-in Cash Op. Costs1 per Boe Q3 LOE per Boe $10.20 49% of total cash costs All-in Cash Operating Costs1 per Boe $10.73 $10.41 $10.12 $10.20 $3.20 $3.30 $3.98 $3.58 $0.16 $0.17 $0.15 $0.16 $4.85 $4.50 $4.15 $3.64 $3.41 $3.40 $3.19 $3.45 2025 Q1 2026 Q2 2026 Q3 2026 LOE Prod Tax GP&T / Other Interest Cash G&A
Ring Energy, Inc. Q3 2026 Earnings | November 6, 2026 | NYSE American: REI Potential Catalysts for 2026 & Beyond 18 Organically Grow High-Quality Inventory and Reserves Further Strengthen Balance Sheet and Increase Financial Flexibility Ongoing Cost and Capital Efficiency Gains Substantial Upside, Proved Reserves Trading Discount and Increasing Commodity Prices
www.ringenergy.com www.ringenergy.com Q3 2026 EARNINGS | NOVEMBER 6, 2026 THANK YOU Company Contact Sonu Singh Johl (281) 397-3699 IR@ringenergy.com Al Petrie (281) 975-2146 apetrie@ringenergy.com Analyst Coverage Tuohy Brothers Investment Noel Parks (215) 913-7320 nparks@tuohybrothers.com Water Tower Research Jeff Robertson (469) 343-9962 jeff@watertowerresearch.com Ring Headquarters 1725 Hughes Landing Blvd Ste 900 The Woodlands, TX 77380 Phone: (281) 397-3699 Alliance Global Partners (AGP) Poe Fratt (314) 719-6084 pfratt@allianceg.com Bank of America Securities William Janela (646) 743-0185 william.janela@bofa.com Mizuho Securities USA LLC Nitin Kumar (212) 282-3953 nitin.kumar@mizuhogroup.com
www.ringenergy.com | NYSE American: REI Q3 2026 EARNINGS | NOVEMBER 6, 2026 APPENDIX
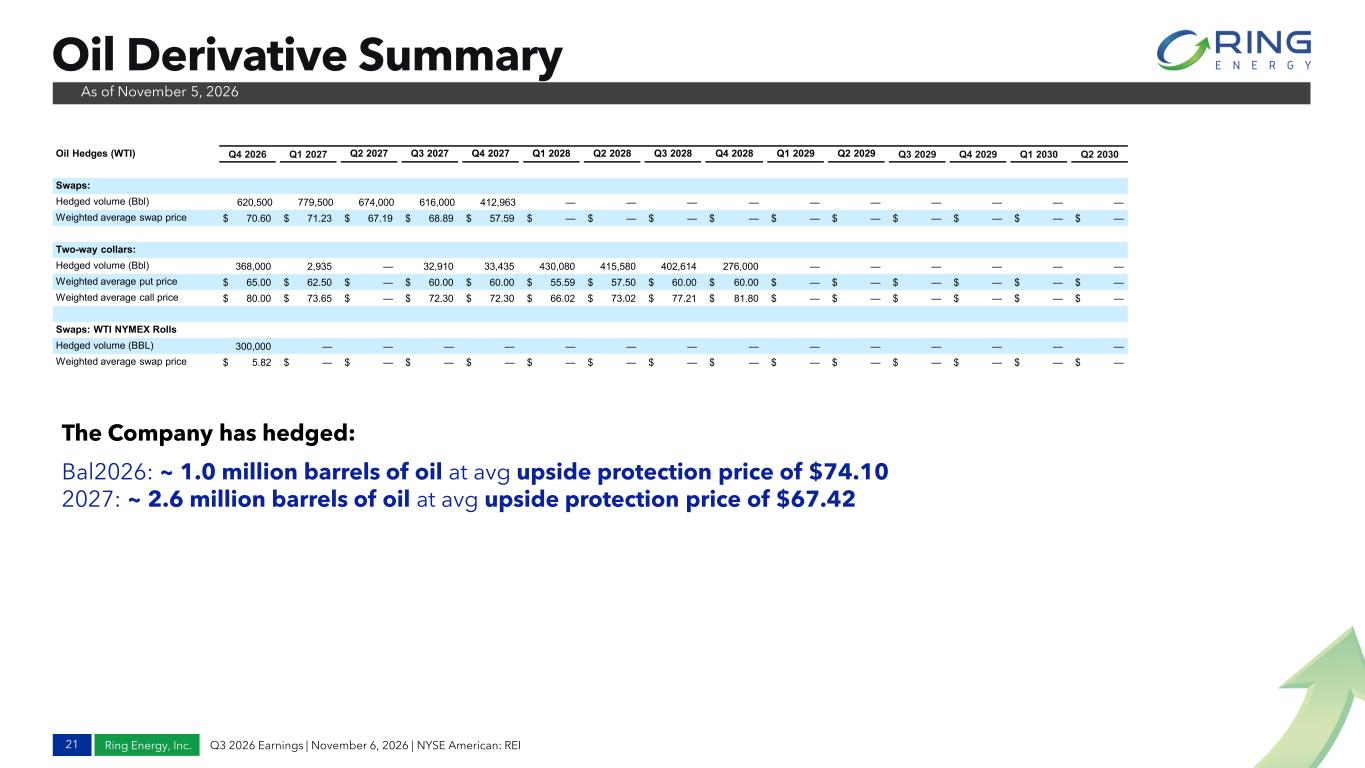
Ring Energy, Inc. Q3 2026 Earnings | November 6, 2026 | NYSE American: REI Oil Derivative Summary (1) The oil basis swap hedges are calculated as the fixed price (weighted average spread price above) less the difference between WTI Midland and WTI Cushing, in the issue of Argus Americas Crude. As of November 5, 2026 21 Oil Hedges (WTI) Q4 2026 Q1 2027 Q2 2027 Q3 2027 Q4 2027 Q1 2028 Q2 2028 Q3 2028 Q4 2028 Q1 2029 Q2 2029 Q3 2029 Q4 2029 Q1 2030 Q2 2030 Swaps: Hedged volume (Bbl) 620,500 779,500 674,000 616,000 412,963 — — — — — — — — — — Weighted average swap price $ 70.60 $ 71.23 $ 67.19 $ 68.89 $ 57.59 $ — $ — $ — $ — $ — $ — $ — $ — $ — $ — Two-way collars: Hedged volume (Bbl) 368,000 2,935 — 32,910 33,435 430,080 415,580 402,614 276,000 — — — — — — Weighted average put price $ 65.00 $ 62.50 $ — $ 60.00 $ 60.00 $ 55.59 $ 57.50 $ 60.00 $ 60.00 $ — $ — $ — $ — $ — $ — Weighted average call price $ 80.00 $ 73.65 $ — $ 72.30 $ 72.30 $ 66.02 $ 73.02 $ 77.21 $ 81.80 $ — $ — $ — $ — $ — $ — Swaps: WTI NYMEX Rolls Hedged volume (BBL) 300,000 — — — — — — — — — — — — — — Weighted average swap price $ 5.82 $ — $ — $ — $ — $ — $ — $ — $ — $ — $ — $ — $ — $ — $ — The Company has hedged: Bal2026: ~ 1.0 million barrels of oil at avg upside protection price of $74.10 2027: ~ 2.6 million barrels of oil at avg upside protection price of $67.42
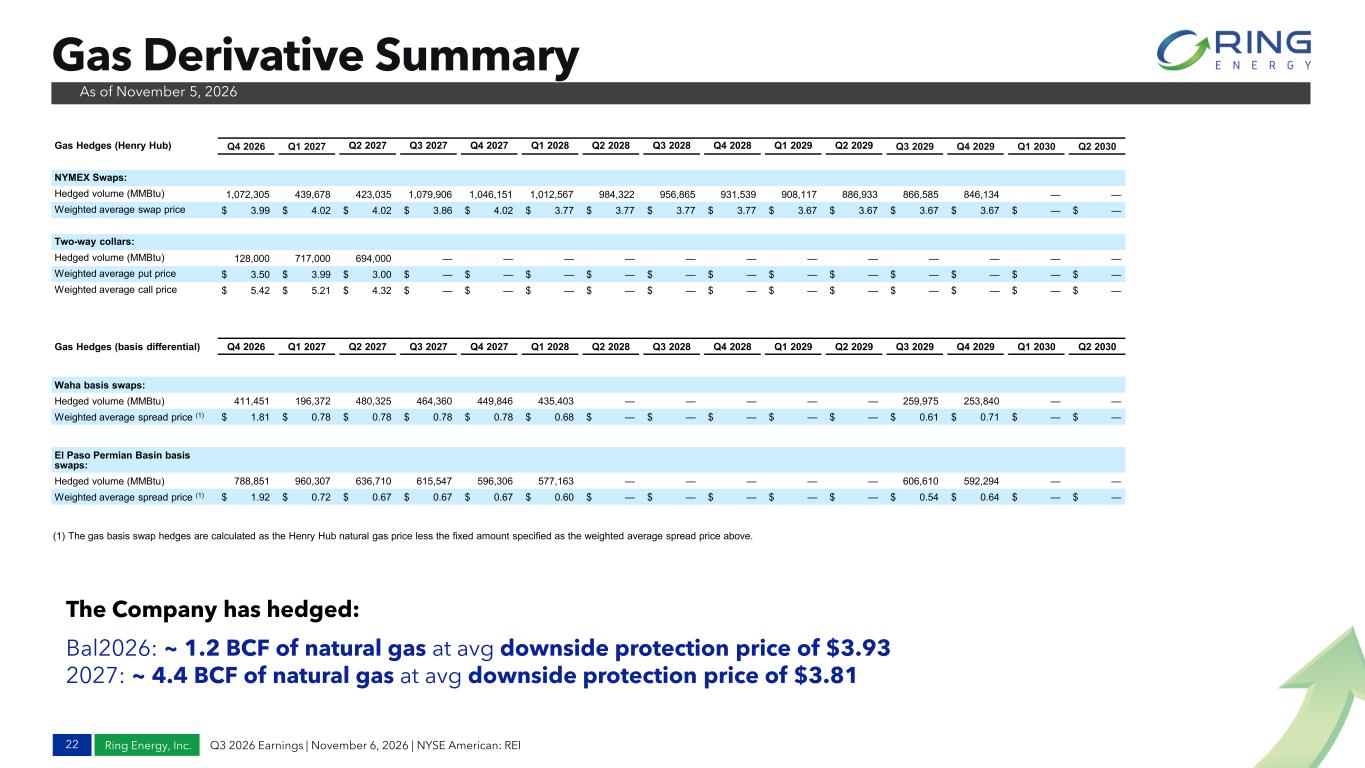
Ring Energy, Inc. Q3 2026 Earnings | November 6, 2026 | NYSE American: REI Gas Derivative Summary As of November 5, 2026 (1) The gas basis swap hedges are calculated as the Henry Hub natural gas price less the fixed amount specified as the weighted average spread price above. 22 Gas Hedges (Henry Hub) Q4 2026 Q1 2027 Q2 2027 Q3 2027 Q4 2027 Q1 2028 Q2 2028 Q3 2028 Q4 2028 Q1 2029 Q2 2029 Q3 2029 Q4 2029 Q1 2030 Q2 2030 NYMEX Swaps: Hedged volume (MMBtu) 1,072,305 439,678 423,035 1,079,906 1,046,151 1,012,567 984,322 956,865 931,539 908,117 886,933 866,585 846,134 — — Weighted average swap price $ 3.99 $ 4.02 $ 4.02 $ 3.86 $ 4.02 $ 3.77 $ 3.77 $ 3.77 $ 3.77 $ 3.67 $ 3.67 $ 3.67 $ 3.67 $ — $ — Two-way collars: Hedged volume (MMBtu) 128,000 717,000 694,000 — — — — — — — — — — — — Weighted average put price $ 3.50 $ 3.99 $ 3.00 $ — $ — $ — $ — $ — $ — $ — $ — $ — $ — $ — $ — Weighted average call price $ 5.42 $ 5.21 $ 4.32 $ — $ — $ — $ — $ — $ — $ — $ — $ — $ — $ — $ — Gas Hedges (basis differential) Q4 2026 Q1 2027 Q2 2027 Q3 2027 Q4 2027 Q1 2028 Q2 2028 Q3 2028 Q4 2028 Q1 2029 Q2 2029 Q3 2029 Q4 2029 Q1 2030 Q2 2030 Waha basis swaps: Hedged volume (MMBtu) 411,451 196,372 480,325 464,360 449,846 435,403 — — — — — 259,975 253,840 — — Weighted average spread price (1) $ 1.81 $ 0.78 $ 0.78 $ 0.78 $ 0.78 $ 0.68 $ — $ — $ — $ — $ — $ 0.61 $ 0.71 $ — $ — El Paso Permian Basin basis swaps: Hedged volume (MMBtu) 788,851 960,307 636,710 615,547 596,306 577,163 — — — — — 606,610 592,294 — — Weighted average spread price (1) $ 1.92 $ 0.72 $ 0.67 $ 0.67 $ 0.67 $ 0.60 $ — $ — $ — $ — $ — $ 0.54 $ 0.64 $ — $ — The Company has hedged: Bal2026: ~ 1.2 BCF of natural gas at avg downside protection price of $3.93 2027: ~ 4.4 BCF of natural gas at avg downside protection price of $3.81
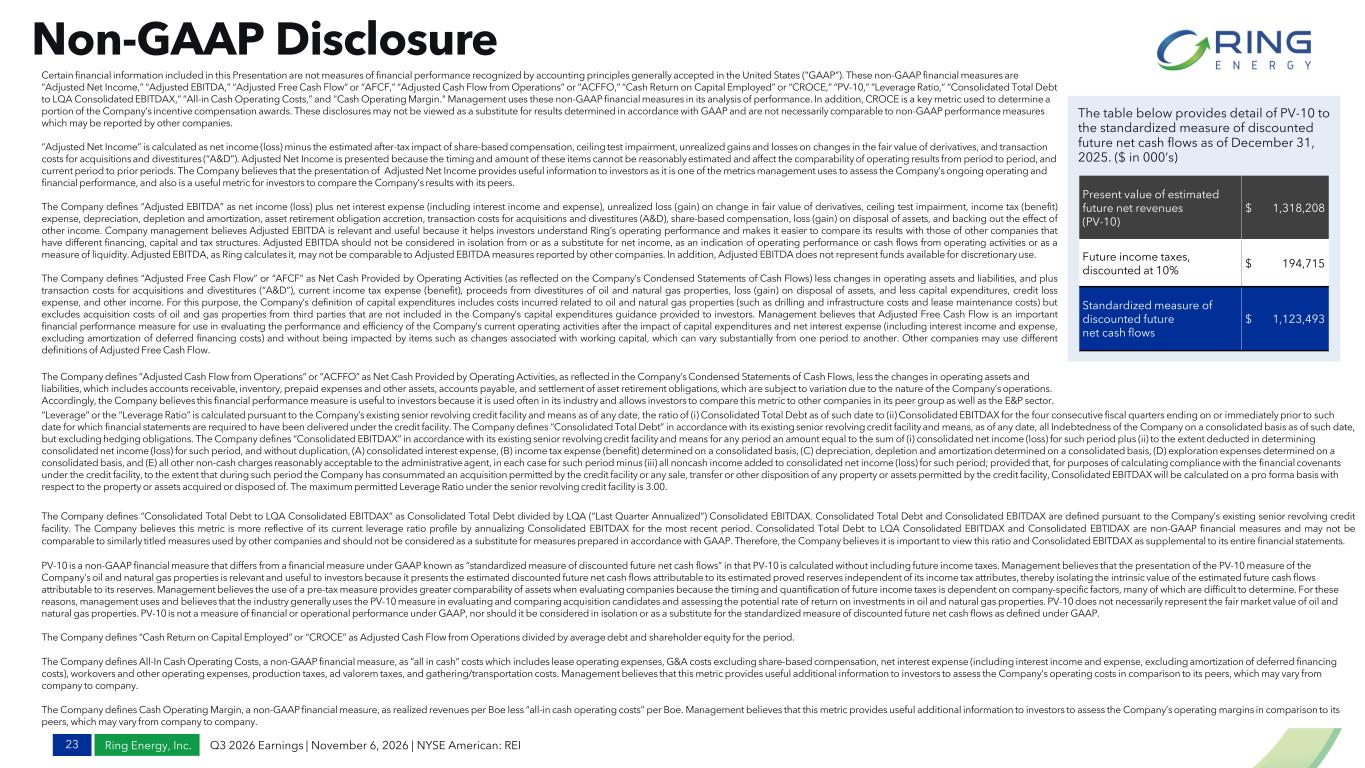
Ring Energy, Inc. Q3 2026 Earnings | November 6, 2026 | NYSE American: REI “Leverage” or the “Leverage Ratio” is calculated pursuant to the Company’s existing senior revolving credit facility and means as of any date, the ratio of (i) Consolidated Total Debt as of such date to (ii) Consolidated EBITDAX for the four consecutive fiscal quarters ending on or immediately prior to such date for which financial statements are required to have been delivered under the credit facility. The Company defines “Consolidated Total Debt” in accordance with its existing senior revolving credit facility and means, as of any date, all Indebtedness of the Company on a consolidated basis as of such date, but excluding hedging obligations. The Company defines “Consolidated EBITDAX” in accordance with its existing senior revolving credit facility and means for any period an amount equal to the sum of (i) consolidated net income (loss) for such period plus (ii) to the extent deducted in determining consolidated net income (loss) for such period, and without duplication, (A) consolidated interest expense, (B) income tax expense (benefit) determined on a consolidated basis, (C) depreciation, depletion and amortization determined on a consolidated basis, (D) exploration expenses determined on a consolidated basis, and (E) all other non-cash charges reasonably acceptable to the administrative agent, in each case for such period minus (iii) all noncash income added to consolidated net income (loss) for such period; provided that, for purposes of calculating compliance with the financial covenants under the credit facility, to the extent that during such period the Company has consummated an acquisition permitted by the credit facility or any sale, transfer or other disposition of any property or assets permitted by the credit facility, Consolidated EBITDAX will be calculated on a pro forma basis with respect to the property or assets acquired or disposed of. The maximum permitted Leverage Ratio under the senior revolving credit facility is 3.00. The Company defines “Consolidated Total Debt to LQA Consolidated EBITDAX” as Consolidated Total Debt divided by LQA (“Last Quarter Annualized”) Consolidated EBITDAX. Consolidated Total Debt and Consolidated EBITDAX are defined pursuant to the Company’s existing senior revolving credit facility. The Company believes this metric is more reflective of its current leverage ratio profile by annualizing Consolidated EBITDAX for the most recent period. Consolidated Total Debt to LQA Consolidated EBITDAX and Consolidated EBTIDAX are non-GAAP financial measures and may not be comparable to similarly titled measures used by other companies and should not be considered as a substitute for measures prepared in accordance with GAAP. Therefore, the Company believes it is important to view this ratio and Consolidated EBITDAX as supplemental to its entire financial statements. PV-10 is a non-GAAP financial measure that differs from a financial measure under GAAP known as “standardized measure of discounted future net cash flows” in that PV-10 is calculated without including future income taxes. Management believes that the presentation of the PV-10 measure of the Company’s oil and natural gas properties is relevant and useful to investors because it presents the estimated discounted future net cash flows attributable to its estimated proved reserves independent of its income tax attributes, thereby isolating the intrinsic value of the estimated future cash flows attributable to its reserves. Management believes the use of a pre-tax measure provides greater comparability of assets when evaluating companies because the timing and quantification of future income taxes is dependent on company-specific factors, many of which are difficult to determine. For these reasons, management uses and believes that the industry generally uses the PV-10 measure in evaluating and comparing acquisition candidates and assessing the potential rate of return on investments in oil and natural gas properties. PV-10 does not necessarily represent the fair market value of oil and natural gas properties. PV-10 is not a measure of financial or operational performance under GAAP, nor should it be considered in isolation or as a substitute for the standardized measure of discounted future net cash flows as defined under GAAP. The Company defines “Cash Return on Capital Employed” or “CROCE” as Adjusted Cash Flow from Operations divided by average debt and shareholder equity for the period. The Company defines All-In Cash Operating Costs, a non-GAAP financial measure, as “all in cash” costs which includes lease operating expenses, G&A costs excluding share-based compensation, net interest expense (including interest income and expense, excluding amortization of deferred financing costs), workovers and other operating expenses, production taxes, ad valorem taxes, and gathering/transportation costs. Management believes that this metric provides useful additional information to investors to assess the Company’s operating costs in comparison to its peers, which may vary from company to company. The Company defines Cash Operating Margin, a non-GAAP financial measure, as realized revenues per Boe less “all-in cash operating costs” per Boe. Management believes that this metric provides useful additional information to investors to assess the Company’s operating margins in comparison to its peers, which may vary from company to company. Non-GAAP Disclosure Certain financial information included in this Presentation are not measures of financial performance recognized by accounting principles generally accepted in the United States (“GAAP”). These non-GAAP financial measures are “Adjusted Net Income,” “Adjusted EBITDA,” “Adjusted Free Cash Flow” or “AFCF,” “Adjusted Cash Flow from Operations” or “ACFFO,” “Cash Return on Capital Employed” or “CROCE,” “PV-10,” “Leverage Ratio,” “Consolidated Total Debt to LQA Consolidated EBITDAX,” “All-in Cash Operating Costs,” and "Cash Operating Margin." Management uses these non-GAAP financial measures in its analysis of performance. In addition, CROCE is a key metric used to determine a portion of the Company’s incentive compensation awards. These disclosures may not be viewed as a substitute for results determined in accordance with GAAP and are not necessarily comparable to non-GAAP performance measures which may be reported by other companies. “Adjusted Net Income” is calculated as net income (loss) minus the estimated after-tax impact of share-based compensation, ceiling test impairment, unrealized gains and losses on changes in the fair value of derivatives, and transaction costs for acquisitions and divestitures (“A&D”). Adjusted Net Income is presented because the timing and amount of these items cannot be reasonably estimated and affect the comparability of operating results from period to period, and current period to prior periods. The Company believes that the presentation of Adjusted Net Income provides useful information to investors as it is one of the metrics management uses to assess the Company’s ongoing operating and financial performance, and also is a useful metric for investors to compare the Company’s results with its peers. The Company defines “Adjusted EBITDA” as net income (loss) plus net interest expense (including interest income and expense), unrealized loss (gain) on change in fair value of derivatives, ceiling test impairment, income tax (benefit) expense, depreciation, depletion and amortization, asset retirement obligation accretion, transaction costs for acquisitions and divestitures (A&D), share-based compensation, loss (gain) on disposal of assets, and backing out the effect of other income. Company management believes Adjusted EBITDA is relevant and useful because it helps investors understand Ring’s operating performance and makes it easier to compare its results with those of other companies that have different financing, capital and tax structures. Adjusted EBITDA should not be considered in isolation from or as a substitute for net income, as an indication of operating performance or cash flows from operating activities or as a measure of liquidity. Adjusted EBITDA, as Ring calculates it, may not be comparable to Adjusted EBITDA measures reported by other companies. In addition, Adjusted EBITDA does not represent funds available for discretionary use. The Company defines “Adjusted Free Cash Flow” or “AFCF” as Net Cash Provided by Operating Activities (as reflected on the Company’s Condensed Statements of Cash Flows) less changes in operating assets and liabilities, and plus transaction costs for acquisitions and divestitures (“A&D”), current income tax expense (benefit), proceeds from divestitures of oil and natural gas properties, loss (gain) on disposal of assets, and less capital expenditures, credit loss expense, and other income. For this purpose, the Company’s definition of capital expenditures includes costs incurred related to oil and natural gas properties (such as drilling and infrastructure costs and lease maintenance costs) but excludes acquisition costs of oil and gas properties from third parties that are not included in the Company’s capital expenditures guidance provided to investors. Management believes that Adjusted Free Cash Flow is an important financial performance measure for use in evaluating the performance and efficiency of the Company’s current operating activities after the impact of capital expenditures and net interest expense (including interest income and expense, excluding amortization of deferred financing costs) and without being impacted by items such as changes associated with working capital, which can vary substantially from one period to another. Other companies may use different definitions of Adjusted Free Cash Flow. The Company defines “Adjusted Cash Flow from Operations” or “ACFFO” as Net Cash Provided by Operating Activities, as reflected in the Company’s Condensed Statements of Cash Flows, less the changes in operating assets and liabilities, which includes accounts receivable, inventory, prepaid expenses and other assets, accounts payable, and settlement of asset retirement obligations, which are subject to variation due to the nature of the Company’s operations. Accordingly, the Company believes this financial performance measure is useful to investors because it is used often in its industry and allows investors to compare this metric to other companies in its peer group as well as the E&P sector. The table below provides detail of PV-10 to the standardized measure of discounted future net cash flows as of December 31, 2025. ($ in 000’s) Present value of estimated future net revenues (PV-10) $ 1,318,208 Future income taxes, discounted at 10% $ 194,715 Standardized measure of discounted future net cash flows $ 1,123,493 23
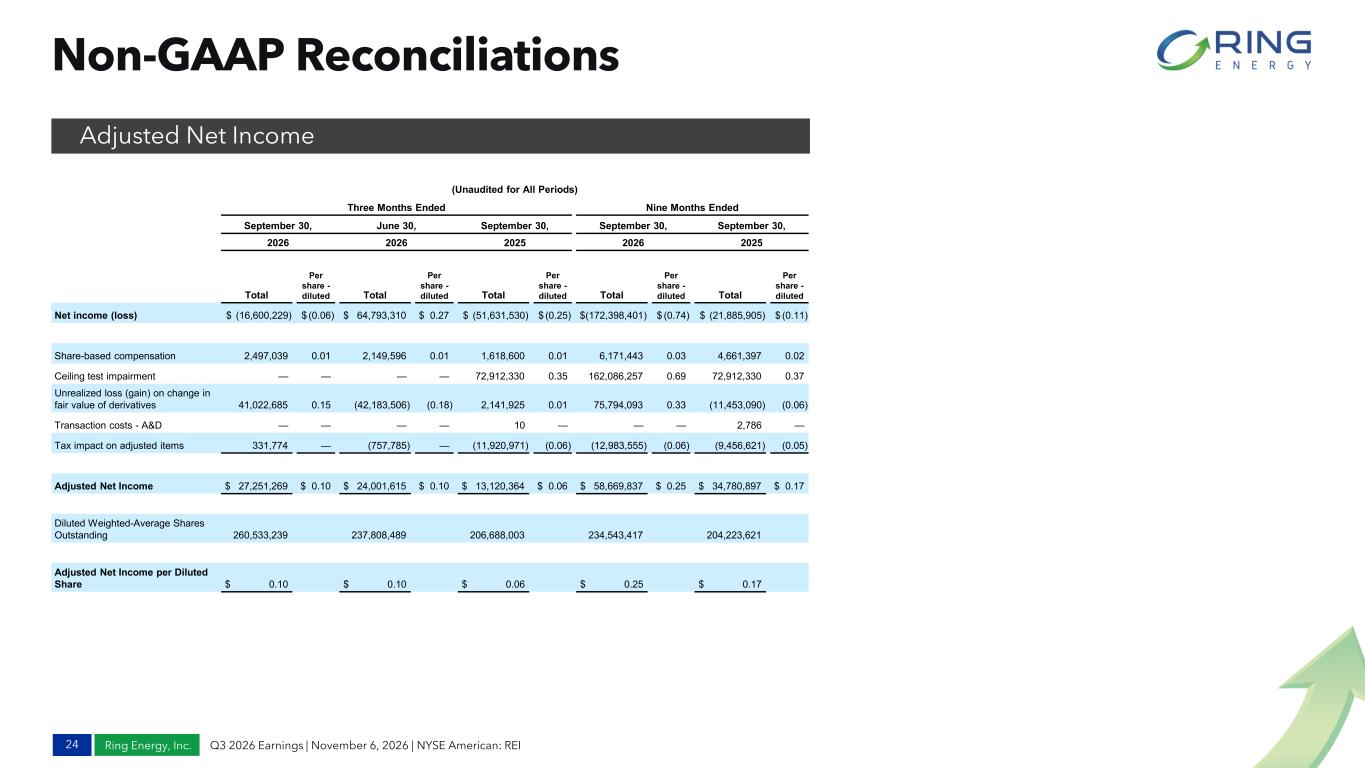
Ring Energy, Inc. Q3 2026 Earnings | November 6, 2026 | NYSE American: REI Non-GAAP Reconciliations Adjusted Net Income 24 (Unaudited for All Periods) Three Months Ended Nine Months Ended September 30, June 30, September 30, September 30, September 30, 2026 2026 2025 2026 2025 Total Per share - diluted Total Per share - diluted Total Per share - diluted Total Per share - diluted Total Per share - diluted Net income (loss) $ (16,600,229) $ (0.06) $ 64,793,310 $ 0.27 $ (51,631,530) $ (0.25) $(172,398,401) $ (0.74) $ (21,885,905) $ (0.11) Share-based compensation 2,497,039 0.01 2,149,596 0.01 1,618,600 0.01 6,171,443 0.03 4,661,397 0.02 Ceiling test impairment — — — — 72,912,330 0.35 162,086,257 0.69 72,912,330 0.37 Unrealized loss (gain) on change in fair value of derivatives 41,022,685 0.15 (42,183,506) (0.18) 2,141,925 0.01 75,794,093 0.33 (11,453,090) (0.06) Transaction costs - A&D — — — — 10 — — — 2,786 — Tax impact on adjusted items 331,774 — (757,785) — (11,920,971) (0.06) (12,983,555) (0.06) (9,456,621) (0.05) Adjusted Net Income $ 27,251,269 $ 0.10 $ 24,001,615 $ 0.10 $ 13,120,364 $ 0.06 $ 58,669,837 $ 0.25 $ 34,780,897 $ 0.17 Diluted Weighted-Average Shares Outstanding 260,533,239 237,808,489 206,688,003 234,543,417 204,223,621 Adjusted Net Income per Diluted Share $ 0.10 $ 0.10 $ 0.06 $ 0.25 $ 0.17
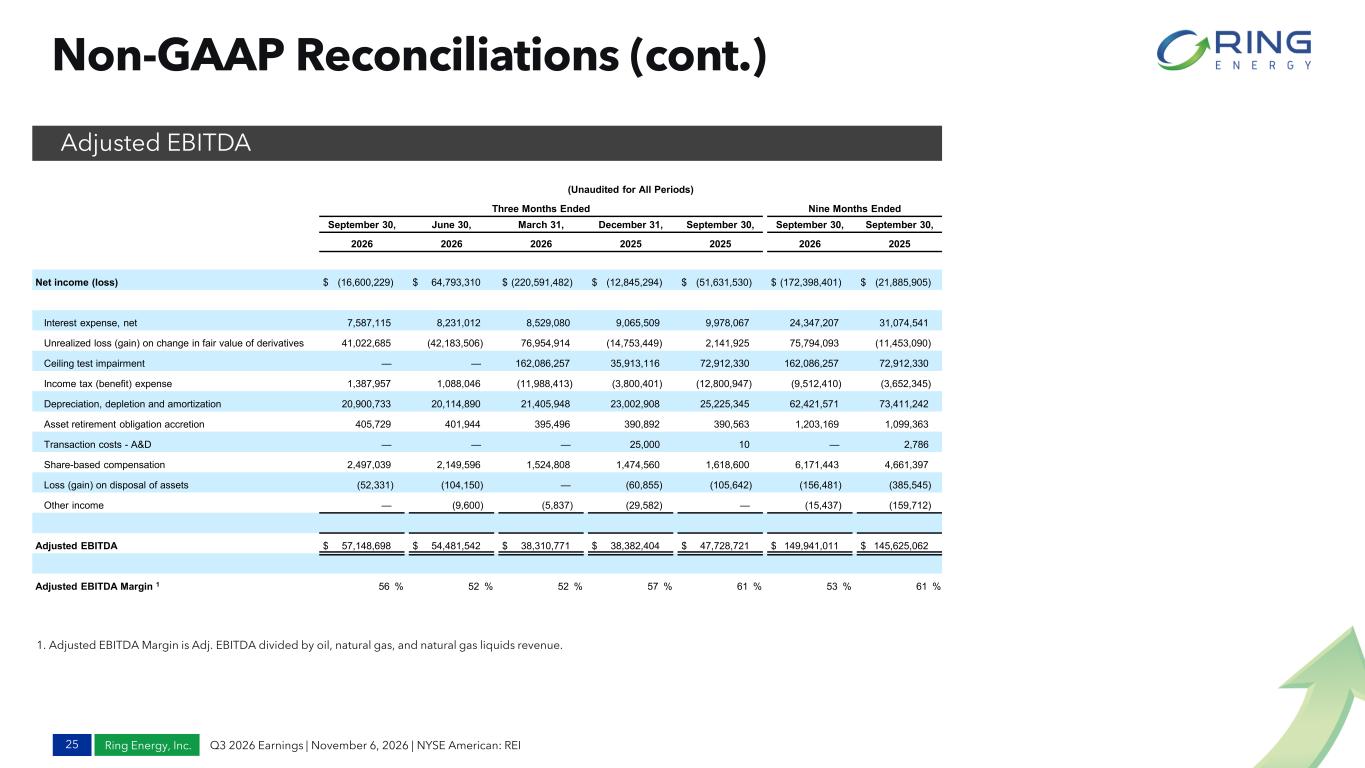
Ring Energy, Inc. Q3 2026 Earnings | November 6, 2026 | NYSE American: REI Non-GAAP Reconciliations (cont.) Adjusted EBITDA 1. Adjusted EBITDA Margin is Adj. EBITDA divided by oil, natural gas, and natural gas liquids revenue. 25 (Unaudited for All Periods) Three Months Ended Nine Months Ended September 30, June 30, March 31, December 31, September 30, September 30, September 30, 2026 2026 2026 2025 2025 2026 2025 Net income (loss) $ (16,600,229) $ 64,793,310 $ (220,591,482) $ (12,845,294) $ (51,631,530) $ (172,398,401) $ (21,885,905) Interest expense, net 7,587,115 8,231,012 8,529,080 9,065,509 9,978,067 24,347,207 31,074,541 Unrealized loss (gain) on change in fair value of derivatives 41,022,685 (42,183,506) 76,954,914 (14,753,449) 2,141,925 75,794,093 (11,453,090) Ceiling test impairment — — 162,086,257 35,913,116 72,912,330 162,086,257 72,912,330 Income tax (benefit) expense 1,387,957 1,088,046 (11,988,413) (3,800,401) (12,800,947) (9,512,410) (3,652,345) Depreciation, depletion and amortization 20,900,733 20,114,890 21,405,948 23,002,908 25,225,345 62,421,571 73,411,242 Asset retirement obligation accretion 405,729 401,944 395,496 390,892 390,563 1,203,169 1,099,363 Transaction costs - A&D — — — 25,000 10 — 2,786 Share-based compensation 2,497,039 2,149,596 1,524,808 1,474,560 1,618,600 6,171,443 4,661,397 Loss (gain) on disposal of assets (52,331) (104,150) — (60,855) (105,642) (156,481) (385,545) Other income — (9,600) (5,837) (29,582) — (15,437) (159,712) Adjusted EBITDA $ 57,148,698 $ 54,481,542 $ 38,310,771 $ 38,382,404 $ 47,728,721 $ 149,941,011 $ 145,625,062 Adjusted EBITDA Margin 1 56 % 52 % 52 % 57 % 61 % 53 % 61 %
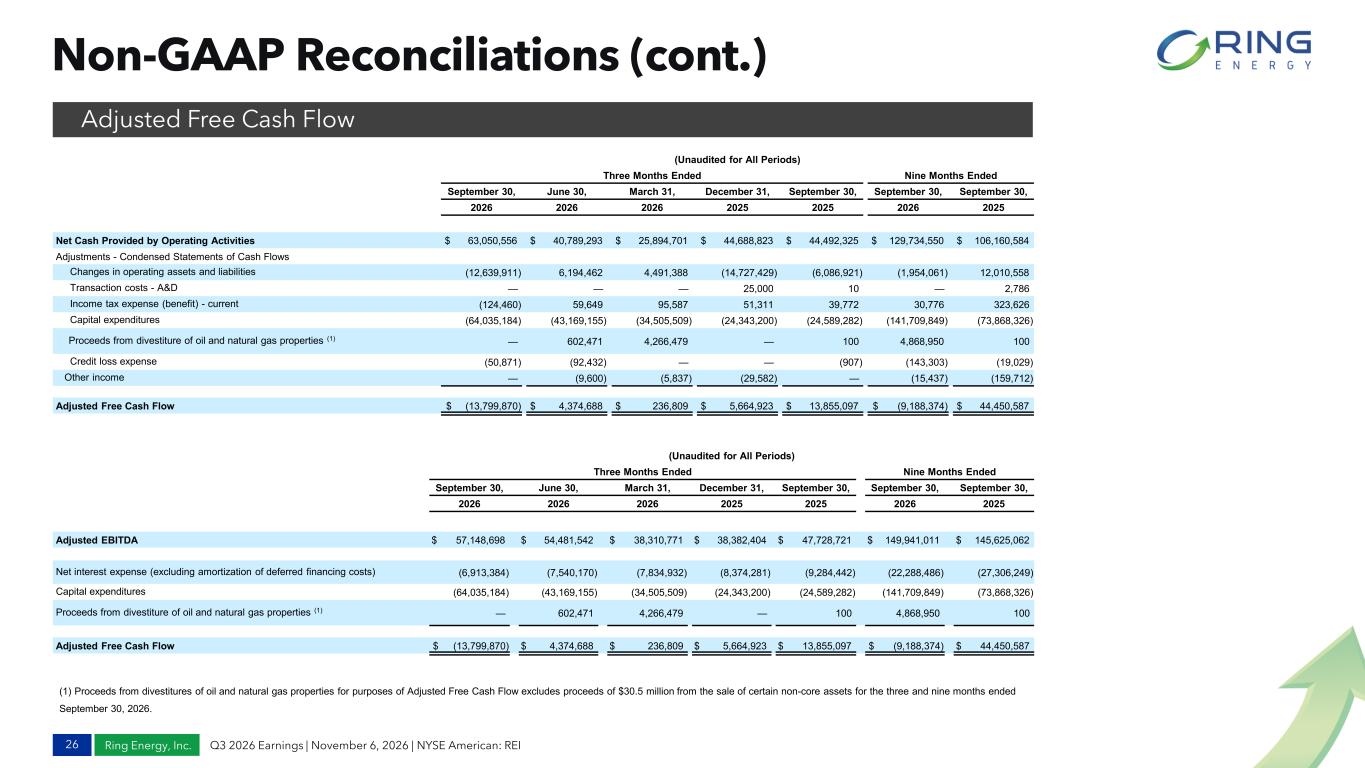
Ring Energy, Inc. Q3 2026 Earnings | November 6, 2026 | NYSE American: REI Non-GAAP Reconciliations (cont.) Adjusted Free Cash Flow 26 (Unaudited for All Periods) Three Months Ended Nine Months Ended September 30, June 30, March 31, December 31, September 30, September 30, September 30, 2026 2026 2026 2025 2025 2026 2025 Net Cash Provided by Operating Activities $ 63,050,556 $ 40,789,293 $ 25,894,701 $ 44,688,823 $ 44,492,325 $ 129,734,550 $ 106,160,584 Adjustments - Condensed Statements of Cash Flows Changes in operating assets and liabilities (12,639,911) 6,194,462 4,491,388 (14,727,429) (6,086,921) (1,954,061) 12,010,558 Transaction costs - A&D — — — 25,000 10 — 2,786 Income tax expense (benefit) - current (124,460) 59,649 95,587 51,311 39,772 30,776 323,626 Capital expenditures (64,035,184) (43,169,155) (34,505,509) (24,343,200) (24,589,282) (141,709,849) (73,868,326) Proceeds from divestiture of oil and natural gas properties (1) — 602,471 4,266,479 — 100 4,868,950 100 Credit loss expense (50,871) (92,432) — — (907) (143,303) (19,029) Other income — (9,600) (5,837) (29,582) — (15,437) (159,712) Adjusted Free Cash Flow $ (13,799,870) $ 4,374,688 $ 236,809 $ 5,664,923 $ 13,855,097 $ (9,188,374) $ 44,450,587 (Unaudited for All Periods) Three Months Ended Nine Months Ended September 30, June 30, March 31, December 31, September 30, September 30, September 30, 2026 2026 2026 2025 2025 2026 2025 Adjusted EBITDA $ 57,148,698 $ 54,481,542 $ 38,310,771 $ 38,382,404 $ 47,728,721 $ 149,941,011 $ 145,625,062 Net interest expense (excluding amortization of deferred financing costs) (6,913,384) (7,540,170) (7,834,932) (8,374,281) (9,284,442) (22,288,486) (27,306,249) Capital expenditures (64,035,184) (43,169,155) (34,505,509) (24,343,200) (24,589,282) (141,709,849) (73,868,326) Proceeds from divestiture of oil and natural gas properties (1) — 602,471 4,266,479 — 100 4,868,950 100 Adjusted Free Cash Flow $ (13,799,870) $ 4,374,688 $ 236,809 $ 5,664,923 $ 13,855,097 $ (9,188,374) $ 44,450,587 (1) Proceeds from divestitures of oil and natural gas properties for purposes of Adjusted Free Cash Flow excludes proceeds of $30.5 million from the sale of certain non-core assets for the three and nine months ended September 30, 2026.
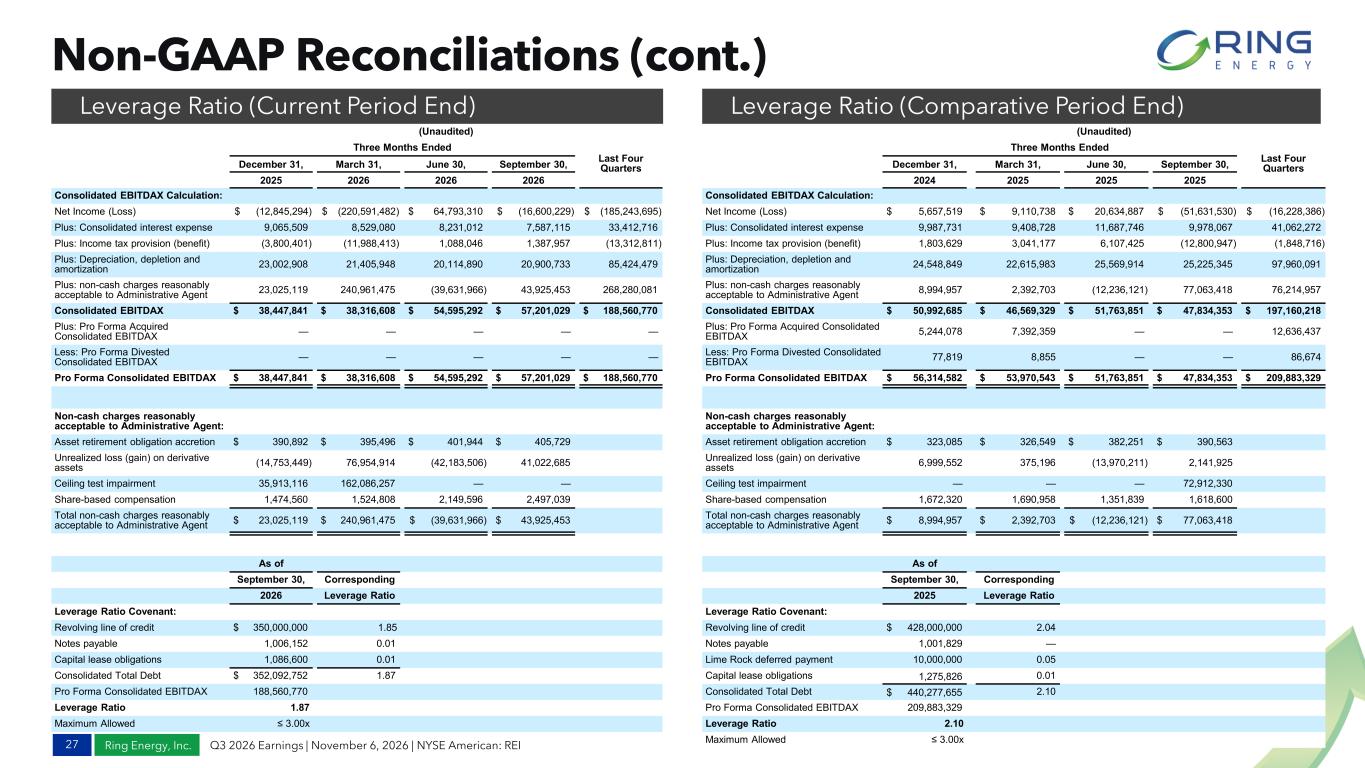
Ring Energy, Inc. Q3 2026 Earnings | November 6, 2026 | NYSE American: REI Non-GAAP Reconciliations (cont.) Leverage Ratio (Current Period End) Leverage Ratio (Comparative Period End) 27 (Unaudited) Three Months Ended Last Four QuartersDecember 31, March 31, June 30, September 30, 2025 2026 2026 2026 Consolidated EBITDAX Calculation: Net Income (Loss) $ (12,845,294) $ (220,591,482) $ 64,793,310 $ (16,600,229) $ (185,243,695) Plus: Consolidated interest expense 9,065,509 8,529,080 8,231,012 7,587,115 33,412,716 Plus: Income tax provision (benefit) (3,800,401) (11,988,413) 1,088,046 1,387,957 (13,312,811) Plus: Depreciation, depletion and amortization 23,002,908 21,405,948 20,114,890 20,900,733 85,424,479 Plus: non-cash charges reasonably acceptable to Administrative Agent 23,025,119 240,961,475 (39,631,966) 43,925,453 268,280,081 Consolidated EBITDAX $ 38,447,841 $ 38,316,608 $ 54,595,292 $ 57,201,029 $ 188,560,770 Plus: Pro Forma Acquired Consolidated EBITDAX — — — — — Less: Pro Forma Divested Consolidated EBITDAX — — — — — Pro Forma Consolidated EBITDAX $ 38,447,841 $ 38,316,608 $ 54,595,292 $ 57,201,029 $ 188,560,770 Non-cash charges reasonably acceptable to Administrative Agent: Asset retirement obligation accretion $ 390,892 $ 395,496 $ 401,944 $ 405,729 Unrealized loss (gain) on derivative assets (14,753,449) 76,954,914 (42,183,506) 41,022,685 Ceiling test impairment 35,913,116 162,086,257 — — Share-based compensation 1,474,560 1,524,808 2,149,596 2,497,039 Total non-cash charges reasonably acceptable to Administrative Agent $ 23,025,119 $ 240,961,475 $ (39,631,966) $ 43,925,453 As of September 30, Corresponding 2026 Leverage Ratio Leverage Ratio Covenant: Revolving line of credit $ 350,000,000 1.85 Notes payable 1,006,152 0.01 Capital lease obligations 1,086,600 0.01 Consolidated Total Debt $ 352,092,752 1.87 Pro Forma Consolidated EBITDAX 188,560,770 Leverage Ratio 1.87 Maximum Allowed ≤ 3.00x (Unaudited) Three Months Ended Last Four QuartersDecember 31, March 31, June 30, September 30, 2024 2025 2025 2025 Consolidated EBITDAX Calculation: Net Income (Loss) $ 5,657,519 $ 9,110,738 $ 20,634,887 $ (51,631,530) $ (16,228,386) Plus: Consolidated interest expense 9,987,731 9,408,728 11,687,746 9,978,067 41,062,272 Plus: Income tax provision (benefit) 1,803,629 3,041,177 6,107,425 (12,800,947) (1,848,716) Plus: Depreciation, depletion and amortization 24,548,849 22,615,983 25,569,914 25,225,345 97,960,091 Plus: non-cash charges reasonably acceptable to Administrative Agent 8,994,957 2,392,703 (12,236,121) 77,063,418 76,214,957 Consolidated EBITDAX $ 50,992,685 $ 46,569,329 $ 51,763,851 $ 47,834,353 $ 197,160,218 Plus: Pro Forma Acquired Consolidated EBITDAX 5,244,078 7,392,359 — — 12,636,437 Less: Pro Forma Divested Consolidated EBITDAX 77,819 8,855 — — 86,674 Pro Forma Consolidated EBITDAX $ 56,314,582 $ 53,970,543 $ 51,763,851 $ 47,834,353 $ 209,883,329 Non-cash charges reasonably acceptable to Administrative Agent: Asset retirement obligation accretion $ 323,085 $ 326,549 $ 382,251 $ 390,563 Unrealized loss (gain) on derivative assets 6,999,552 375,196 (13,970,211) 2,141,925 Ceiling test impairment — — — 72,912,330 Share-based compensation 1,672,320 1,690,958 1,351,839 1,618,600 Total non-cash charges reasonably acceptable to Administrative Agent $ 8,994,957 $ 2,392,703 $ (12,236,121) $ 77,063,418 As of September 30, Corresponding 2025 Leverage Ratio Leverage Ratio Covenant: Revolving line of credit $ 428,000,000 2.04 Notes payable 1,001,829 — Lime Rock deferred payment 10,000,000 0.05 Capital lease obligations 1,275,826 0.01 Consolidated Total Debt $ 440,277,655 2.10 Pro Forma Consolidated EBITDAX 209,883,329 Leverage Ratio 2.10 Maximum Allowed ≤ 3.00x
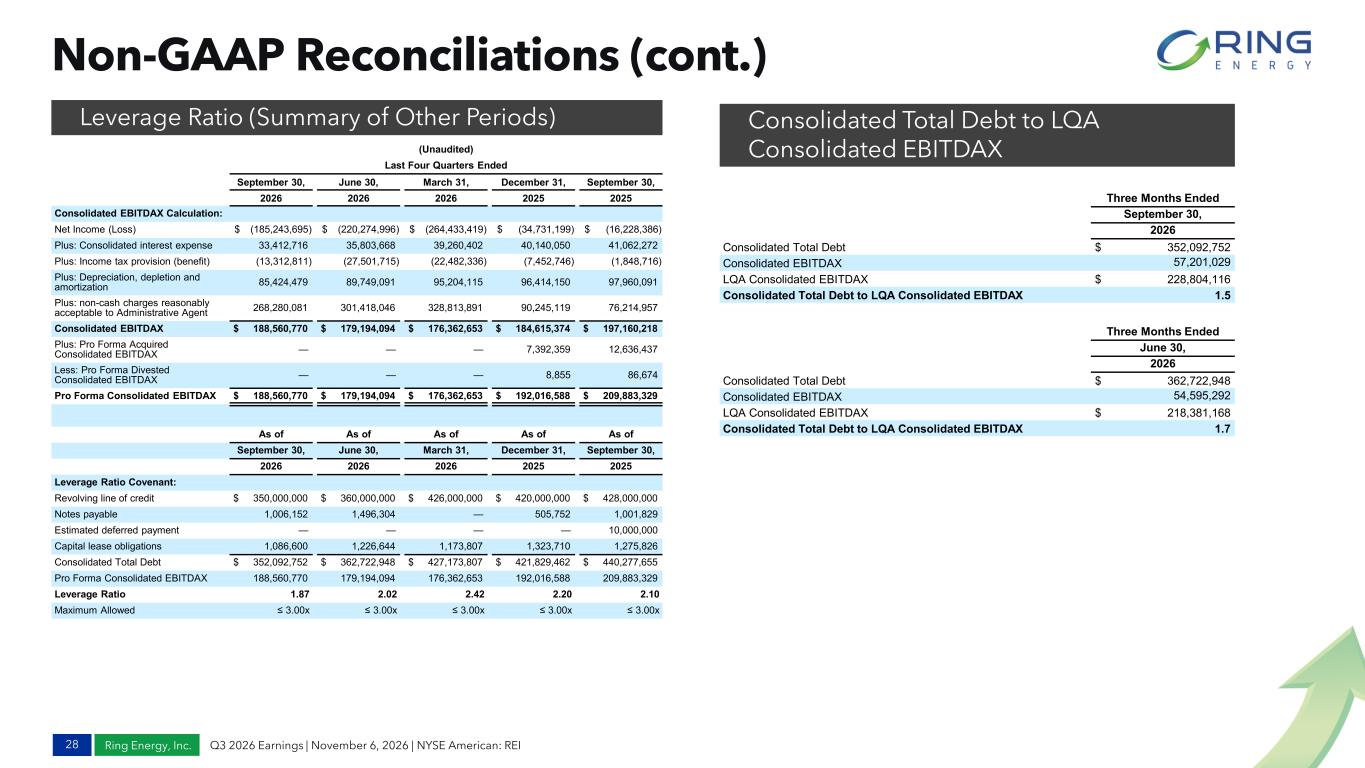
Ring Energy, Inc. Q3 2026 Earnings | November 6, 2026 | NYSE American: REI Non-GAAP Reconciliations (cont.) Leverage Ratio (Summary of Other Periods) 28 Three Months Ended June 30, 2026 Consolidated Total Debt $ 362,722,948 Consolidated EBITDAX 54,595,292 LQA Consolidated EBITDAX $ 218,381,168 Consolidated Total Debt to LQA Consolidated EBITDAX 1.7 Consolidated Total Debt to LQA Consolidated EBITDAX (Unaudited) Last Four Quarters Ended September 30, June 30, March 31, December 31, September 30, 2026 2026 2026 2025 2025 Consolidated EBITDAX Calculation: Net Income (Loss) $ (185,243,695) $ (220,274,996) $ (264,433,419) $ (34,731,199) $ (16,228,386) Plus: Consolidated interest expense 33,412,716 35,803,668 39,260,402 40,140,050 41,062,272 Plus: Income tax provision (benefit) (13,312,811) (27,501,715) (22,482,336) (7,452,746) (1,848,716) Plus: Depreciation, depletion and amortization 85,424,479 89,749,091 95,204,115 96,414,150 97,960,091 Plus: non-cash charges reasonably acceptable to Administrative Agent 268,280,081 301,418,046 328,813,891 90,245,119 76,214,957 Consolidated EBITDAX $ 188,560,770 $ 179,194,094 $ 176,362,653 $ 184,615,374 $ 197,160,218 Plus: Pro Forma Acquired Consolidated EBITDAX — — — 7,392,359 12,636,437 Less: Pro Forma Divested Consolidated EBITDAX — — — 8,855 86,674 Pro Forma Consolidated EBITDAX $ 188,560,770 $ 179,194,094 $ 176,362,653 $ 192,016,588 $ 209,883,329 As of As of As of As of As of September 30, June 30, March 31, December 31, September 30, 2026 2026 2026 2025 2025 Leverage Ratio Covenant: Revolving line of credit $ 350,000,000 $ 360,000,000 $ 426,000,000 $ 420,000,000 $ 428,000,000 Notes payable 1,006,152 1,496,304 — 505,752 1,001,829 Estimated deferred payment — — — — 10,000,000 Capital lease obligations 1,086,600 1,226,644 1,173,807 1,323,710 1,275,826 Consolidated Total Debt $ 352,092,752 $ 362,722,948 $ 427,173,807 $ 421,829,462 $ 440,277,655 Pro Forma Consolidated EBITDAX 188,560,770 179,194,094 176,362,653 192,016,588 209,883,329 Leverage Ratio 1.87 2.02 2.42 2.20 2.10 Maximum Allowed ≤ 3.00x ≤ 3.00x ≤ 3.00x ≤ 3.00x ≤ 3.00x Three Months Ended September 30, 2026 Consolidated Total Debt $ 352,092,752 Consolidated EBITDAX 57,201,029 LQA Consolidated EBITDAX $ 228,804,116 Consolidated Total Debt to LQA Consolidated EBITDAX 1.5
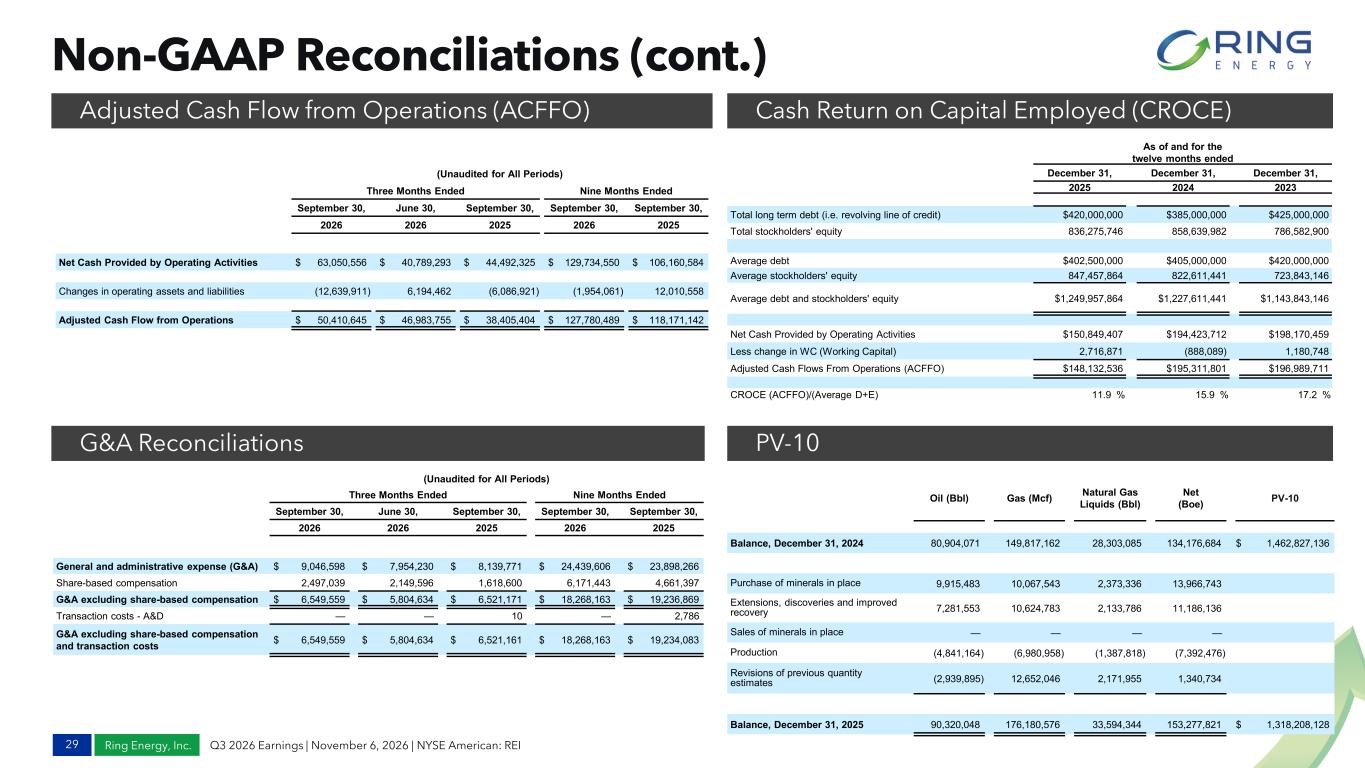
Ring Energy, Inc. Q3 2026 Earnings | November 6, 2026 | NYSE American: REI Non-GAAP Reconciliations (cont.) Adjusted Cash Flow from Operations (ACFFO) Cash Return on Capital Employed (CROCE) G&A Reconciliations PV-10 29 (Unaudited for All Periods) Three Months Ended Nine Months Ended September 30, June 30, September 30, September 30, September 30, 2026 2026 2025 2026 2025 Net Cash Provided by Operating Activities $ 63,050,556 $ 40,789,293 $ 44,492,325 $ 129,734,550 $ 106,160,584 Changes in operating assets and liabilities (12,639,911) 6,194,462 (6,086,921) (1,954,061) 12,010,558 Adjusted Cash Flow from Operations $ 50,410,645 $ 46,983,755 $ 38,405,404 $ 127,780,489 $ 118,171,142 (Unaudited for All Periods) Three Months Ended Nine Months Ended September 30, June 30, September 30, September 30, September 30, 2026 2026 2025 2026 2025 General and administrative expense (G&A) $ 9,046,598 $ 7,954,230 $ 8,139,771 $ 24,439,606 $ 23,898,266 Share-based compensation 2,497,039 2,149,596 1,618,600 6,171,443 4,661,397 G&A excluding share-based compensation $ 6,549,559 $ 5,804,634 $ 6,521,171 $ 18,268,163 $ 19,236,869 Transaction costs - A&D — — 10 — 2,786 G&A excluding share-based compensation and transaction costs $ 6,549,559 $ 5,804,634 $ 6,521,161 $ 18,268,163 $ 19,234,083 Oil (Bbl) Gas (Mcf) Natural Gas Liquids (Bbl) Net (Boe) PV-10 Balance, December 31, 2024 80,904,071 149,817,162 28,303,085 134,176,684 $ 1,462,827,136 Purchase of minerals in place 9,915,483 10,067,543 2,373,336 13,966,743 Extensions, discoveries and improved recovery 7,281,553 10,624,783 2,133,786 11,186,136 Sales of minerals in place — — — — Production (4,841,164) (6,980,958) (1,387,818) (7,392,476) Revisions of previous quantity estimates (2,939,895) 12,652,046 2,171,955 1,340,734 Balance, December 31, 2025 90,320,048 176,180,576 33,594,344 153,277,821 $ 1,318,208,128 As of and for the twelve months ended December 31, December 31, December 31, 2025 2024 2023 Total long term debt (i.e. revolving line of credit) $420,000,000 $385,000,000 $425,000,000 Total stockholders' equity 836,275,746 858,639,982 786,582,900 Average debt $402,500,000 $405,000,000 $420,000,000 Average stockholders' equity 847,457,864 822,611,441 723,843,146 Average debt and stockholders' equity $1,249,957,864 $1,227,611,441 $1,143,843,146 Net Cash Provided by Operating Activities $150,849,407 $194,423,712 $198,170,459 Less change in WC (Working Capital) 2,716,871 (888,089) 1,180,748 Adjusted Cash Flows From Operations (ACFFO) $148,132,536 $195,311,801 $196,989,711 CROCE (ACFFO)/(Average D+E) 11.9 % 15.9 % 17.2 %
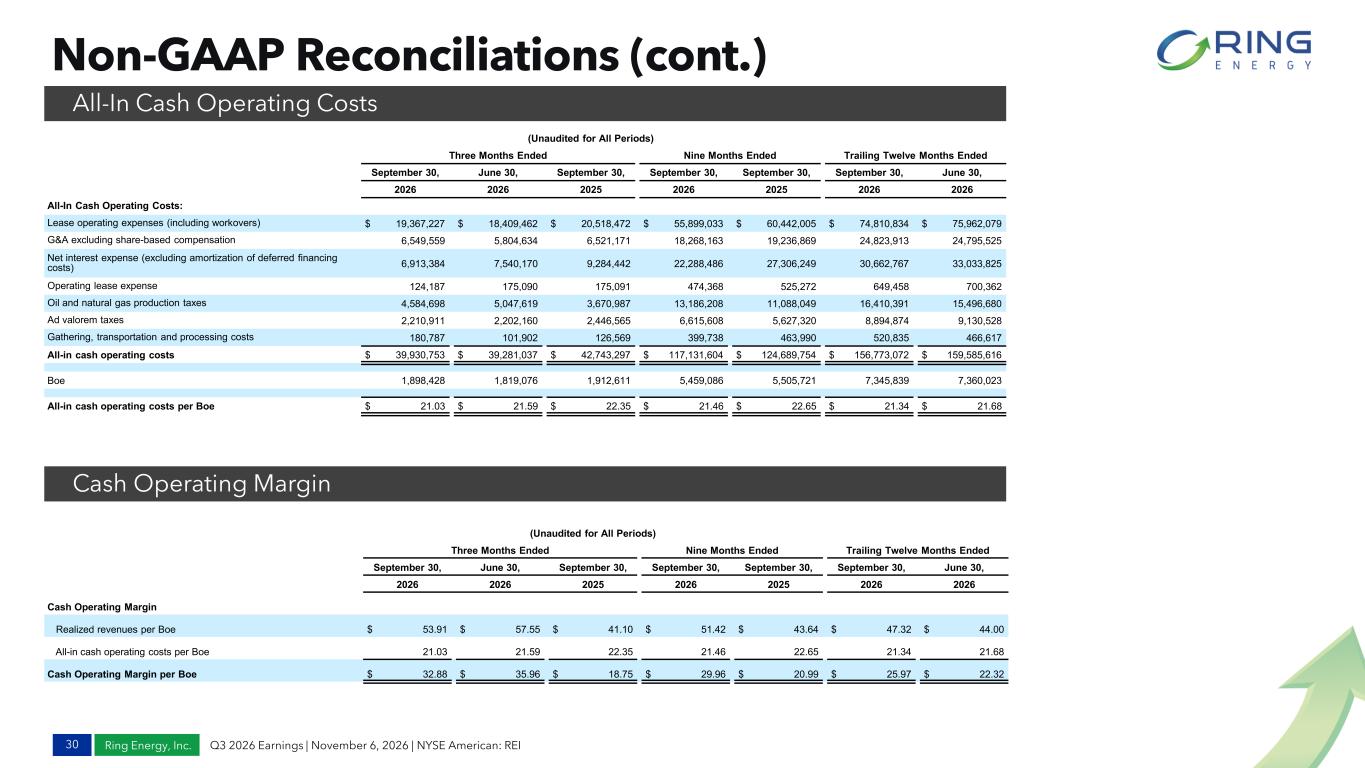
Ring Energy, Inc. Q3 2026 Earnings | November 6, 2026 | NYSE American: REI Non-GAAP Reconciliations (cont.) All-In Cash Operating Costs Cash Operating Margin 30 (Unaudited for All Periods) Three Months Ended Nine Months Ended Trailing Twelve Months Ended September 30, June 30, September 30, September 30, September 30, September 30, June 30, 2026 2026 2025 2026 2025 2026 2026 All-In Cash Operating Costs: Lease operating expenses (including workovers) $ 19,367,227 $ 18,409,462 $ 20,518,472 $ 55,899,033 $ 60,442,005 $ 74,810,834 $ 75,962,079 G&A excluding share-based compensation 6,549,559 5,804,634 6,521,171 18,268,163 19,236,869 24,823,913 24,795,525 Net interest expense (excluding amortization of deferred financing costs) 6,913,384 7,540,170 9,284,442 22,288,486 27,306,249 30,662,767 33,033,825 Operating lease expense 124,187 175,090 175,091 474,368 525,272 649,458 700,362 Oil and natural gas production taxes 4,584,698 5,047,619 3,670,987 13,186,208 11,088,049 16,410,391 15,496,680 Ad valorem taxes 2,210,911 2,202,160 2,446,565 6,615,608 5,627,320 8,894,874 9,130,528 Gathering, transportation and processing costs 180,787 101,902 126,569 399,738 463,990 520,835 466,617 All-in cash operating costs $ 39,930,753 $ 39,281,037 $ 42,743,297 $ 117,131,604 $ 124,689,754 $ 156,773,072 $ 159,585,616 Boe 1,898,428 1,819,076 1,912,611 5,459,086 5,505,721 7,345,839 7,360,023 All-in cash operating costs per Boe $ 21.03 $ 21.59 $ 22.35 $ 21.46 $ 22.65 $ 21.34 $ 21.68 (Unaudited for All Periods) Three Months Ended Nine Months Ended Trailing Twelve Months Ended September 30, June 30, September 30, September 30, September 30, September 30, June 30, 2026 2026 2025 2026 2025 2026 2026 Cash Operating Margin Realized revenues per Boe $ 53.91 $ 57.55 $ 41.10 $ 51.42 $ 43.64 $ 47.32 $ 44.00 All-in cash operating costs per Boe 21.03 21.59 22.35 21.46 22.65 21.34 21.68 Cash Operating Margin per Boe $ 32.88 $ 35.96 $ 18.75 $ 29.96 $ 20.99 $ 25.97 $ 22.32