

 |  |  |
Date: | Place: | Record Date: |
Thursday, June 4, 2026 at 10:00 a.m. Pacific Time | www.virtualshareholdermeeting. com/ERII2026 | April 6, 2026 |
By Order of the Board of Directors, | |
 | |
William W. Yeung | |
Chief Legal Officer and Corporate Secretary |
Important Notice Regarding the Availability of Proxy Materials for the Annual Stockholder Meeting |
To Be Held on June 4, 2026: This Proxy Statement, along with the 2025 Annual Report on Form 10-K for the fiscal year ended December 31, 2025, is available free of charge at the following website: www.proxyvote.com |
Table of Contents |
Page | ||
Human Capital Resources | ||
Board Composition | ||
Sustainability | ||
Page | ||
39 | ||
Executive Compensation Framework | ||
Table of Contents |
Page | ||
December 31, 2025 | ||
Page | ||
Proxy Statement |
Proxy Summary |
| |
Date and Time: | Virtual Meeting Access: |
Thursday, June 4, 2026, at 10:00 a.m., Pacific Time | www.virtualshareholdermeeting.com/ERII2026 |
|  |
Record Date: | Proxy Mail Date: |
April 6, 2026 | On or about April 20, 2026 |
 | |
Vote in Advance of the Meeting | |
Over the internet at www.proxyvote.com; or |
 |  |
By telephone at 1-800-690-6903; or | By mail — sign, date and return the proxy card or voting instruction form mailed to you. |
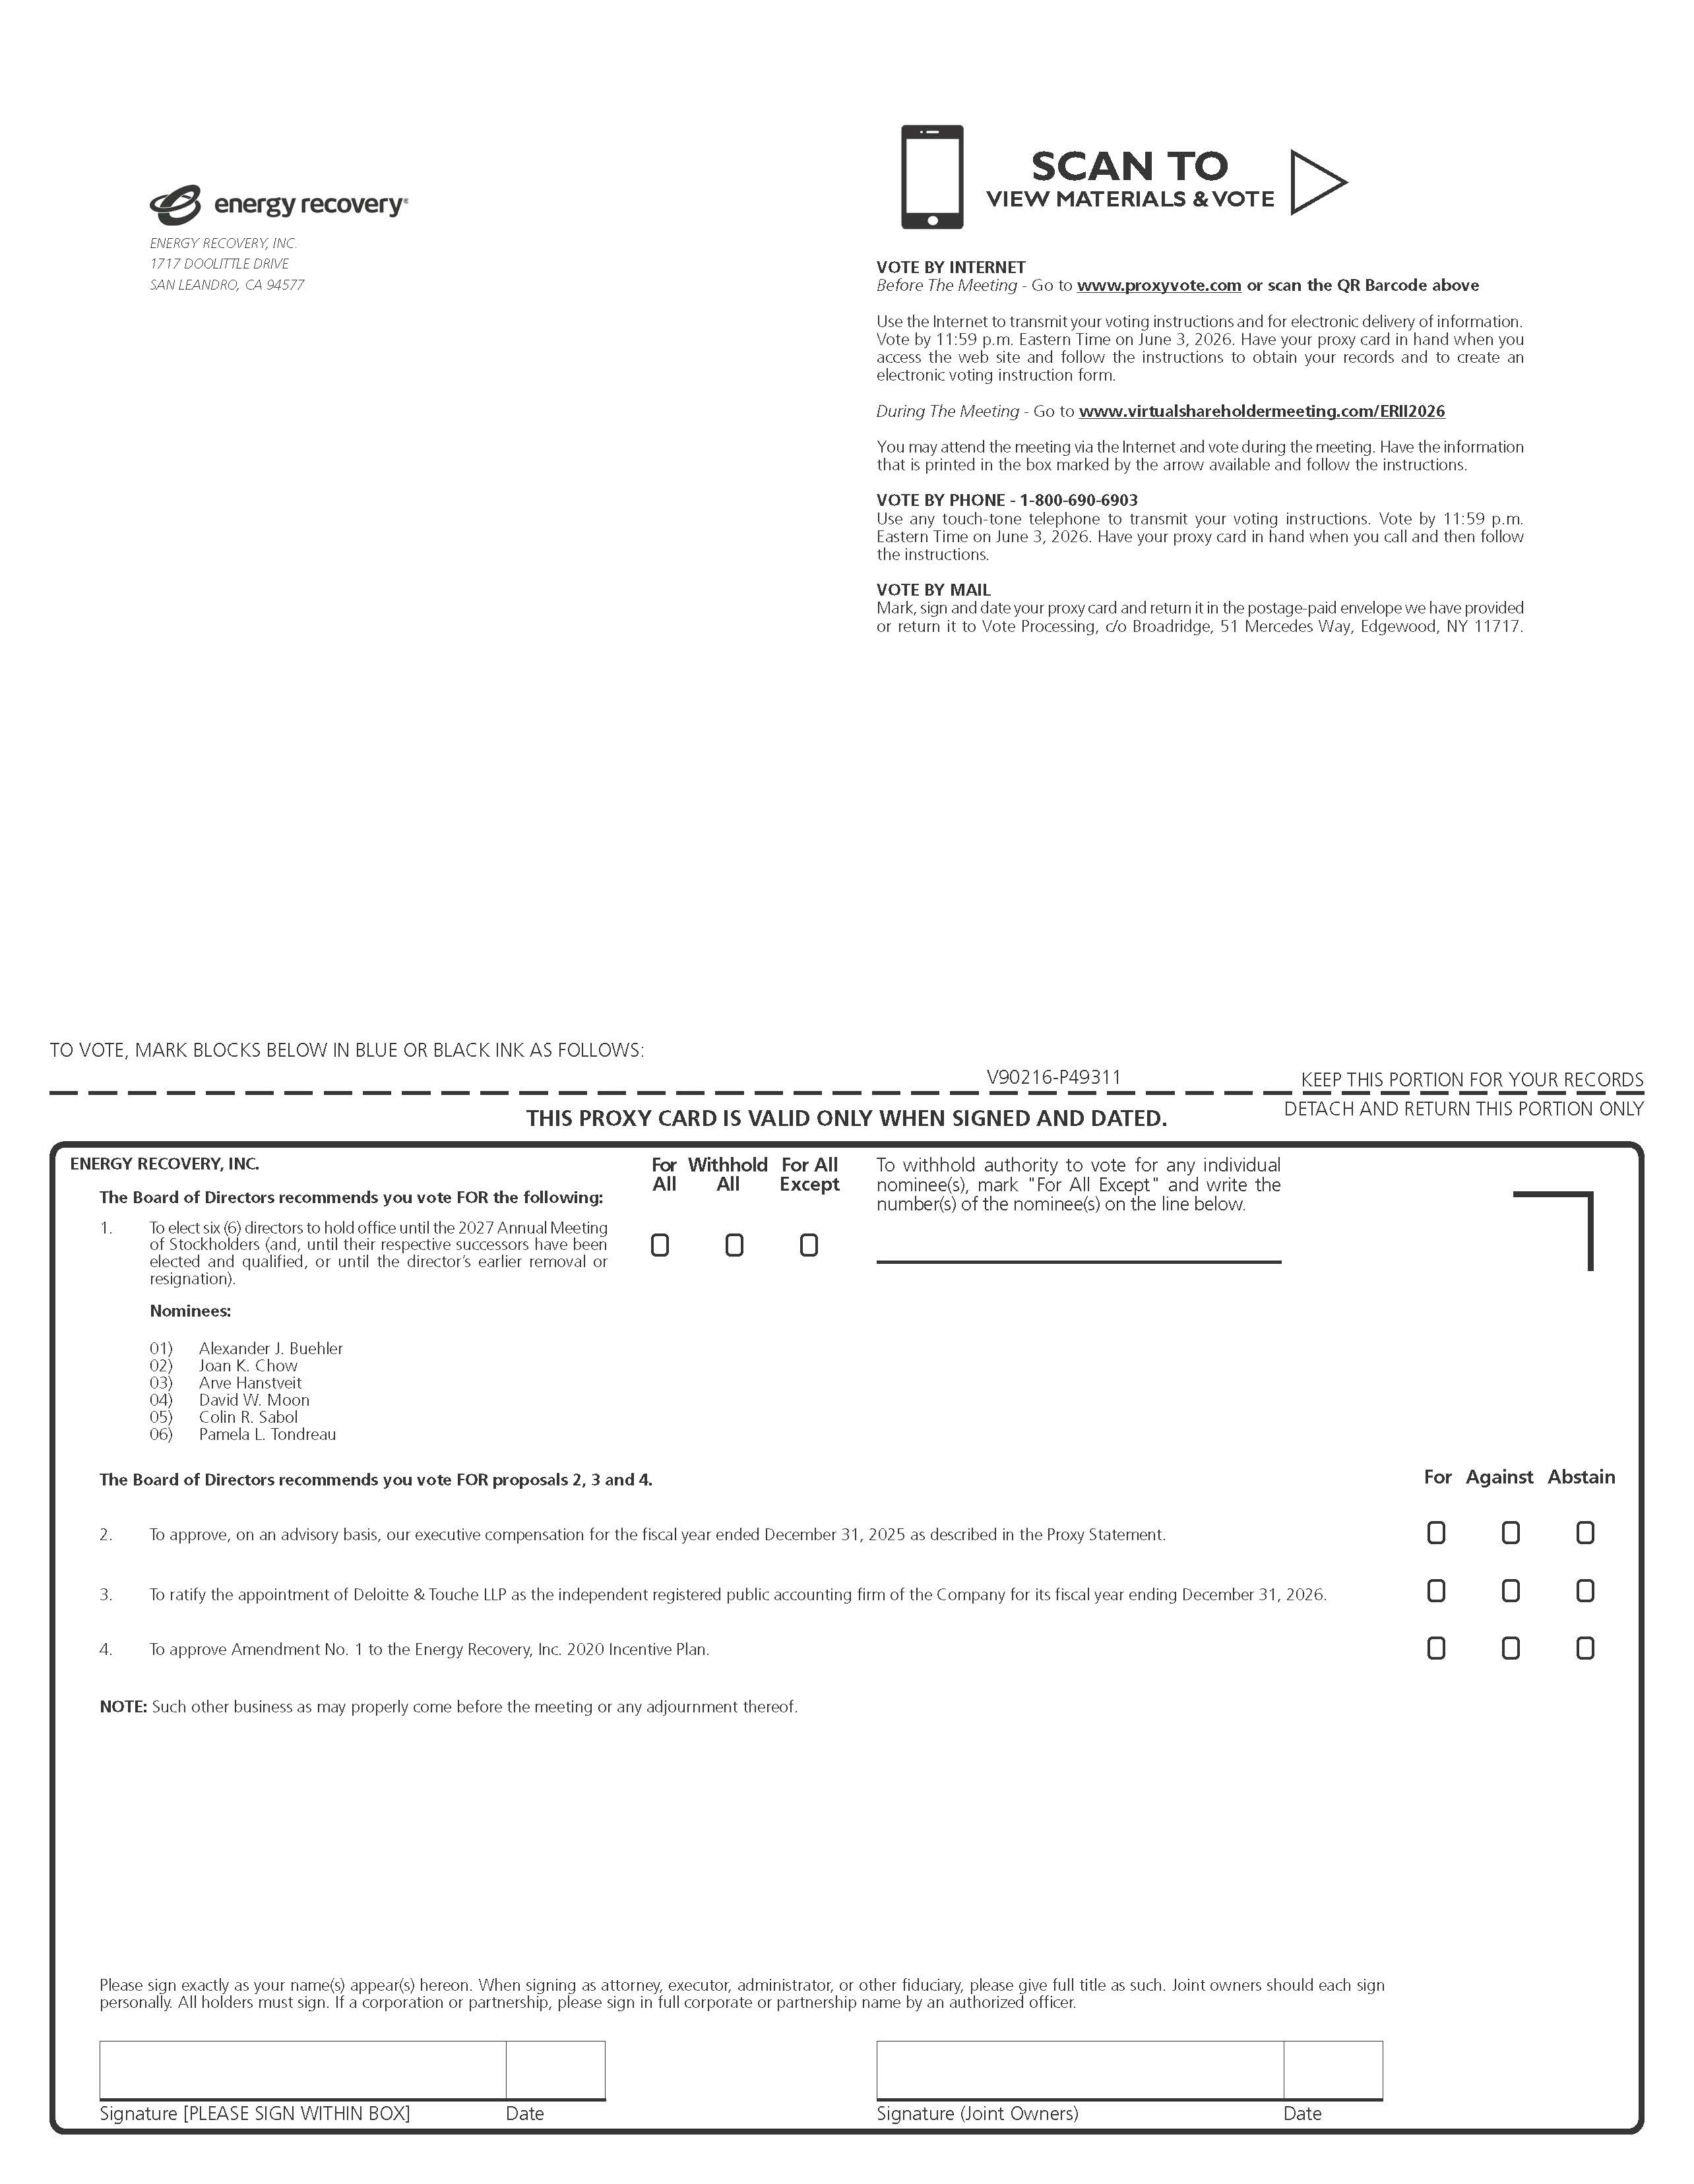
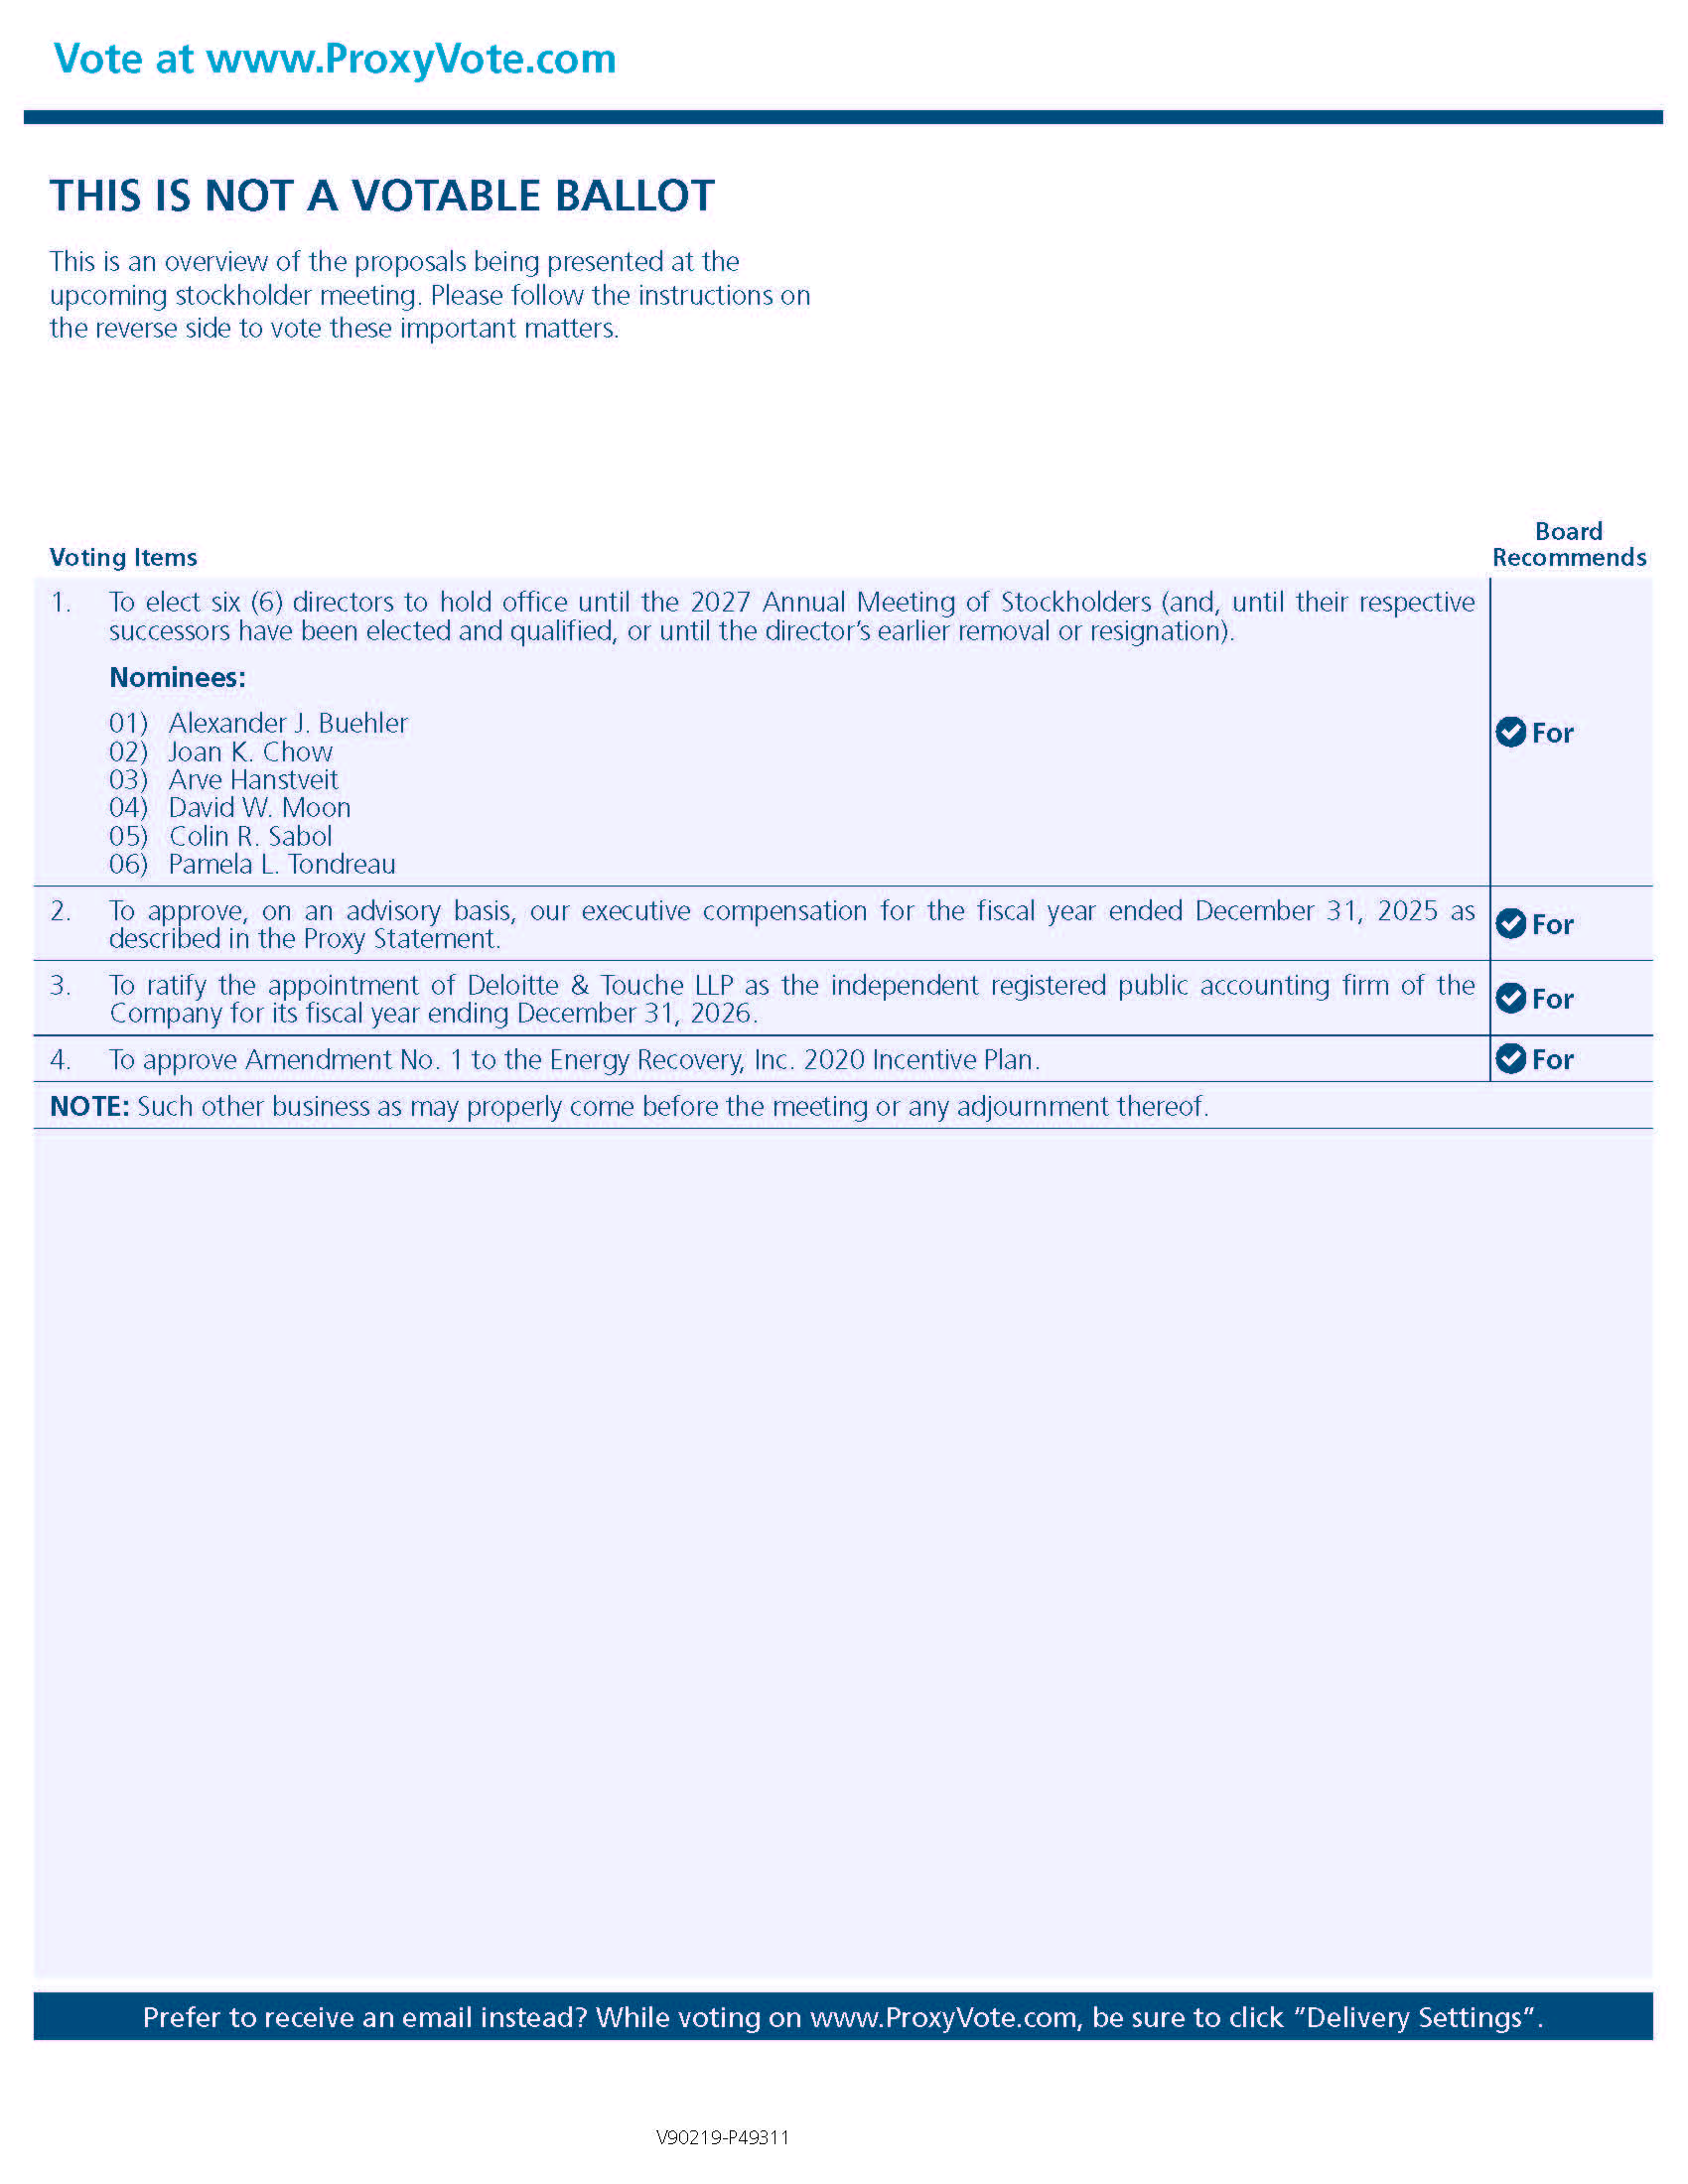
Matter | Board Recommendation | Page | |||
1. | FOR each Nominee | ||||
2. | FOR | ||||
3. | FOR | ||||
4. | FOR | ||||
Name | Age (1) | Director Since | Principal Occupation | Independent | Roles and Committee Memberships (1) | |||||
Alexander J. Buehler | 50 | 2015 | Former President and CEO of Integrated Water Services | Yes | Audit (Chair), Compensation | |||||
Joan K. Chow | 65 | 2021 | Former Executive Vice President and Chief Marketing Officer of Conagra Foods | Yes | Compensation (Chair), Audit | |||||
Arve Hanstveit | 71 | 1995 | CFO of Foldstar, Inc. | Yes | Nominating & Corporate Governance, Audit | |||||
David W. Moon | 64 | 2023 | President and CEO of Energy Recovery, Inc. | No | ||||||
Colin R. Sabol | 58 | 2023 | Former President of Measurement & Control Solutions at Xylem | Yes | Nominating & Corporate Governance (Chair), Compensation | |||||
Pamela L. Tondreau | 66 | 2019 | Former Executive Vice President and Chief Legal Officer of onsemi | Yes | Board Chair, Compensation, Nominating & Corporate Governance | |||||


What We Do | What We Don’t Do | |
✔Substantial portion of compensation is at-risk ✔Long-term vesting to promote retention and investor alignment ✔Rigorous stock ownership guidelines ✔Double trigger change in control severance ✔At-will employment of executive officers ✔Independent Compensation Committee ✔Independent compensation consultant ✔Annual executive compensation assessment tied to practices of a reasonable peer group of similar size/ value public companies ✔Risk assessment ✔Clawback policy ✔Annual incentives are based on achievement of rigorous performance goals ✔Executive compensation program does not encourage excessive risk taking | ✘No repricing ✘No excessive perquisites ✘No executive retirement plan benefits ✘No guaranteed bonuses or annual equity awards ✘No excessive severance ✘No excise tax gross-ups |
Proposal No. 1 – Election of Directors |
Director Nominees (Term Expiring in 2027) |
Alexander J. Buehler |
Joan K. Chow |
Arve Hanstveit |
David W. Moon |
Colin R. Sabol |
Pamela L. Tondreau |
Skill/Experience | Buehler | Chow | Hanstveit | Moon | Sabol | Tondreau |
Manufacturing/Operations | ✔ | ✔ | ✔ | ✔ | ✔ | |
Industry/Product Knowledge | ✔ | ✔ | ✔ | ✔ | ✔ | ✔ |
International Operations/Experience | ✔ | ✔ | ✔ | ✔ | ✔ | |
Finance/Accounting | ✔ | ✔ | ✔ | ✔ | ✔ | |
Product Innovation/R&D | ✔ | ✔ | ✔ | ✔ | ✔ | ✔ |
Energy | ✔ | ✔ | ✔ | ✔ | ✔ | |
Human Capital/Culture | ✔ | ✔ | ✔ | ✔ | ✔ | ✔ |
Strategic Transformation/M&A | ✔ | ✔ | ✔ | ✔ | ✔ | ✔ |
Corporate Strategy/Governance | ✔ | ✔ | ✔ | ✔ | ✔ | ✔ |
Risk Oversight | ✔ | ✔ | ✔ | ✔ | ✔ |
Director Since | Name, Principal Occupation, and Other Information | |
February 2015 | Alexander J. Buehler Age 50 |

Director Since | Name, Principal Occupation, and Other Information | |
December 2021 | Joan K. Chow Age 65 |

Director Since | Name, Principal Occupation, and Other Information | |
January 1995 | Arve Hanstveit Age 71 |

Director Since | Name, Principal Occupation, and Other Information | |
July 2023 | David W. Moon Age 64 |

Director Since | Name, Principal Occupation, and Other Information | |
July 2023 | Colin R. Sabol Age 58 |

Director Since | Name, Principal Occupation, and Other Information | |
July 2019 | Pamela L. Tondreau Age 66 |

Board Chair | CEO | Independent Committee Chairs | |||
Pamela L. Tondreau | David W. Moon | Alexander J. Buehler | Joan K. Chow | Colin R. Sabol | |
Audit Committee Chair | Compensation Committee Chair | Nominating & Corporate Governance Committee Chair | |||


Board Committee Memberships | ||||||||
Director | Age (1) | Audit | Compensation | Nominating & Corporate Governance | ||||
Alexander J. Buehler | 50 | Chair | Member | |||||
Joan K. Chow | 65 | Member | Chair | |||||
Arve Hanstveit | 71 | Member | Member | |||||
David W. Moon (2) | 64 | |||||||
Colin R. Sabol | 58 | Member | Chair | |||||
Pamela L. Tondreau (3) | 66 | Member | Member | |||||
Audit Committee | |||
Compensation Committee | |||
Nominating & Corporate Governance Committee | |||
Board of Directors | ||||||||||||||||||||||||||||||||||||||||||||||||||||||||||||||||
Overall responsibility for risk oversight, including: | ||||||||||||||||||||||||||||||||||||||||||||||||||||||||||||||||
–Strategic –Financial –Operational –Reputational | –Legal & regulatory –Technology –Succession | |||||||||||||||||||||||||||||||||||||||||||||||||||||||||||||||
Audit Committee | Compensation Committee | Nominating and Corporate Governance Committee | ||||||||||||||||||||||||||||||||||||||||||||||||||||||||||||||
–Accounting –Risk & compliance –Financial statements –Internal audit –Financial reporting process & controls –Cybersecurity & information technology | –Executive compensation design –Human capital management | –Board refreshment, diversity & succession planning –Sustainability –Compliance & ethics program –Corporate responsibility –CEO succession planning | ||||||||||||||||||||||||||||||||||||||||||||||||||||||||||||||
Retainer Fee | ||
$ | ||
Board Fees | ||
Cash Retainer | 50,000 | |
Equity Retainer (1) | 150,000 | |
200,000 | ||
Chair of the Board Fees (2) | ||
Cash Retainer | 50,000 | |
Equity Retainer (1) | 35,000 | |
85,000 | ||
Committee and Lead Independent Director Fees (2) (3) | ||
Lead Independent Director | 15,000 | |
Chair of the Audit Committee | 15,000 | |
Chair of the Compensation Committee | 10,000 | |
Chair of the Nominating & Corporate Governance Committee | 8,500 | |
Director | Fees Earned and Paid in Cash | Equity Awards (1) | Total | Unvested RSU Shares Held December 31, 2025 | ||||
($) | ($) | ($) | (#) | |||||
Alexander J. Buehler (2) | 65,000 | 149,993 | 214,993 | 12,038 | ||||
Joan K. Chow (3) | 60,000 | 149,993 | 209,993 | 12,038 | ||||
Arve Hanstveit (4) | 54,250 | 149,993 | 204,243 | 12,038 | ||||
David W. Moon (5) | — | — | — | — | ||||
Colin R. Sabol (6) | 54,250 | 149,993 | 204,243 | 12,038 | ||||
Pamela L. Tondreau (7) | 100,000 | 184,994 | 284,994 | 14,847 | ||||
Total | 333,500 | 2,084,963 | 2,418,463 | 62,999 | ||||
Proposal No. 2 – Non-Binding Advisory Vote on Executive Compensation |
Named Executive Officer | Title | |
David W. Moon (1) | President and Chief Executive Officer | |
Michael S. Mancini (2) | Chief Financial Officer | |
Rodney Clemente (3) | Senior Vice President, Water | |
Natarajan Ramanan (4) | Chief Technology Officer | |
William W. Yeung (5) | Chief Legal Officer | |
Objective | How we achieve this | |
✔ Attract, Retain and Motivate Executive Talent | We maintain pay targets and a compensation program design that align to broader market practices that attract mission critical executive talent | |
✔ Pay for Performance | We reward performance, incentivizing the Company’s key executives to exceed strategic, operational and financial goals | |
✔ Align Management and Shareholder Interests | We provide long-term, equity-based incentives and have robust stock ownership guidelines. In addition, our program design aligns outcomes and rewards with stockholder expectations. |
Corporate MBOs | Weight | ||
(%) | |||
1 – | Financial Performance — revenue target. | 35 | |
2 – | Financial Performance — adjusted EBITDA. | 35 | |
3 – | Financial Performance – Wastewater revenue target. | 15 | |
4 – | Financial Performance – CO2 revenue target. | 15 | |
Overall | 100 | ||
Clemente MBOs | Weight | ||
(%) | |||
1 – | Financial Performance — revenue target. | 35 | |
2 – | Financial Performance — adjusted EBITDA. | 35 | |
3 – | Financial Performance – Desalination revenue target. | 30 | |
Overall | 100 | ||
Component and Rationale | Target CEO Proportion | Actual CEO Proportion (1) | Target NEO Proportion | Actual NEO Proportion (2) | |||||||
Base Salary (3) | |||||||||||
Fixed pay to attract and retain talent, based on role, level of responsibilities and individual performance. | |||||||||||
Annual Incentives (4) | |||||||||||
Variable pay to incentivize and recognize performance in areas of short- term strategic importance. | |||||||||||
Long-Term Incentives (5) | |||||||||||
Equity-based pay to incentivize and recognize performance in areas of long-term strategic importance, promote retention and stability, and align executives with shareholders. | |||||||||||


Roles and Responsibilities in the Executive Compensation Process | ||
✔ Compensation Committee | The Compensation Committee oversees our executive compensation program, approves the MBOs for the Company and our NEOs and evaluates the results against those targets annually, determines the compensation of our CEO, our Other NEOs, and other executives, and reviews the design and implementation of our annual incentive and equity-based plans. The Compensation Committee makes its determinations regarding executive compensation based on a variety of factors including the NEO’s individual performance, peer group data, recommendations from the independent compensation consultant and management. In determining the compensation package for each of our Other NEOs, the Compensation Committee receives input and recommendations from our CEO and Chief Human Resources Officer. Executives do not have a role in determining their own compensation. The CEO does not have a role in determining his own compensation. | |
✔ Independent Compensation Consultant | The Compensation Committee retains Compensia as its independent compensation consultant to assist in the execution of the Compensation Committee’s duties. Compensia provides the Compensation Committee data analysis, guidance and recommendations on executive compensation levels relative to our peers, market trends in incentive plan design, risk and reward analysis of executive compensation plans and other compensation practices and policies. | |
✔ CEO | Our CEO makes compensation recommendations to the Compensation Committee for all executive officers, including our Other NEOs. Our CEO evaluates the performance of the executive officers and considers their responsibilities as well as the compensation analysis provided by Compensia. | |
✔ Other Members of Management | The Chief Human Resources Officer provides analysis regarding competitive practices and pay ranges, compensation programs, equity awards and benefit plans. The Chief Human Resources Officer and Chief Legal Officer attend non-executive sessions of the Compensation Committee to provide additional perspective and expertise. | |
ACM Research, Inc. | Aspen Aerogels, Inc. | Middlesex Water Company | ||
Aehr Test Systems | Ballard Power System, Inc. | nLIGHT, Inc. | ||
Alphatec Holdings, Inc. | CEVA, Inc. | Omega Flex, Inc. | ||
Altus Power, Inc. | Graham | PROCEPT BioRobotics Corp. | ||
Ambarella | Helios Technologies, Inc. | Thermon Group Holdings | ||
American Superconductor | Mesa Laboratories, Inc. | TransMedics Group | ||
Named Executive Officer | 2024 Base Salary | 2025 Base Salary (1) | Percent Increase from 2024 (2) | ||
($) | (%) | ||||
David W. Moon | 570,000 | 620,000 | 9 | ||
Michael S. Mancini | 400,000 | 400,000 | — | ||
Rodney Clemente | 390,000 | 400,000 | 3 | ||
Natarajan Ramanan (3) | N/A | 350,000 | — | ||
William W. Yeung | 374,000 | 394,000 | 5 | ||
Base Salary | x | NEO Target Bonus Percentage |
Minimum Threshold | Target | Maximum Threshold and Above | |||||
(%) | (%) | (%) | |||||
1 – | Financial Performance — revenue target. | 95 | 100 | 105 | |||
2 – | Financial Performance — adjusted EBITDA. | 85 | 100 | 115 | |||
3 – | Financial Performance – Wastewater revenue target. | 90 | 100 | 110 | |||
4 – | Financial Performance – CO2 revenue target. | 80 | 100 | 120 | |||
Minimum Threshold | Target | Maximum Threshold and Above | |||||
(%) | (%) | (%) | |||||
1 – | Financial Performance — revenue target. | 95 | 100 | 105 | |||
2 – | Financial Performance — adjusted EBITDA. | 85 | 100 | 115 | |||
3 - | Financial Performance – Desalination revenue target. | 96 | 100 | 104 | |||
Financial Performance Target | Total Waste Water Revenue | Total Attainment | |||||||||
Total Revenue | Adjusted EBITDA | Total CO2 Revenue | Total Desalination Revenue (1) | ||||||||
(%) | (%) | (%) | (%) | (%) | (%) | ||||||
Weighting | 35 | 35 | 15 | 15 | N/A | 100 | |||||
Achievement | |||||||||||
David W. Moon | 85 | 70 | 53 | 6 | N/A | 63 | |||||
Michael S. Mancini | 85 | 70 | 53 | 6 | N/A | 63 | |||||
Natarajan Ramanan | 85 | 70 | 53 | 6 | N/A | 63 | |||||
William W. Yeung | 85 | 70 | 53 | 6 | N/A | 63 | |||||
Weighting | 35 | 35 | N/A | N/A | 30 | 100 | |||||
Achievement | |||||||||||
Rodney Clemente | 85 | 70 | N/A | N/A | 91 | 82 | |||||
2025 AIP | ||||||||||
Named Executive Officer | AIP Target in Percent | AIP Target in $ (1) | MBO Achievement | 2025 AIP Paid in 2026 | ||||||
(%) | ($) | (%) | ($) | |||||||
David W. Moon | 100 | 615,833 | 63 | 0 | ||||||
Michael S. Mancini | 70 | 280,000 | 63 | 0 | ||||||
Rodney Clemente | 70 | 279,417 | 82 | 0 | ||||||
Natarajan Ramanan | 60 | 192,500 | 63 | 0 | ||||||
William W. Yeung | 60 | 235,400 | 63 | 0 | ||||||
Named Executive Officer | Key Contributor Bonus | ||
($) | |||
David W. Moon | 0 | ||
Michael S. Mancini | 70,000 | ||
Rodney Clemente | 70,000 | ||
Natarajan Ramanan | 0 | ||
William W. Yeung | 0 | ||
Named Executive Officer | RSUs | Value | ||
(#) | ($) | |||
David W. Moon (1) | 88,980 | 1,299,998 | ||
Michael S. Mancini (1) | 34,223 | 499,998 | ||
Rodney Clemente (1) | 34,223 | 499,998 | ||
Natarajan Ramanan (1) | 26,455 | 400,000 | ||
William W. Yeung (1) | 23,956 | 349,997 | ||
Named Executive Officer | Target Three Year Revenue | Value | Target Three Year EBITDA | Value | ||||
(#) | ($) | (#) | ($) | |||||
David W. Moon | 44,490 | 649,999 | 44,490 | 649,999 | ||||
Michael S. Mancini | 17,112 | 250,006 | 17,111 | 249,992 | ||||
Rodney Clemente | 17,112 | 250,006 | 17,111 | 249,992 | ||||
Natarajan Ramanan | 6,614 | 100,004 | 6,613 | 99,989 | ||||
William W. Yeung | 11,978 | 174,999 | 11,978 | 174,999 | ||||
Cash Compensation | •Additional 12 months of base salary upon termination | ||
•100% of participant’s target annual bonus in the year of the occurrence of the change of control | |||
COBRA Benefits | •Company paid coverage following first eligibility limited to the lower of 12 months or re-employment eligibility of a comparable plan with another employer | ||
Equity Compensation | •Immediate vesting of 100% of unvested equity awards upon termination | ||
Other Compensation | •Maximum of $10,000 of reasonable outplacement costs |
Named Executive Officer | Lump-Sum Payment (1) | Vesting of all Unvested Equity Compensation Awards (2) | COBRA Benefits for up to 12 Months (Medical, Dental and Vision Benefits) (3) | Maximum Outplacement Services Reimbursement | ||||
($) | ($) | ($) | ($) | |||||
David W. Moon | 1,240,000 | 3,214,586 | — | 10,000 | ||||
Michael S. Mancini | 680,000 | 923,337 | 48,918 | 10,000 | ||||
Rodney Clemente | 680,000 | 1,820,978 | 34,600 | 10,000 | ||||
Natarajan Ramanan (5) | 560,000 | 535,310 | 26,006 | 10,000 | ||||
William W. Yeung | 630,400 | 1,196,499 | 48,918 | 10,000 | ||||
Cash Compensation | •Additional 6 months of base salary upon termination | ||
COBRA Benefits | •Company paid coverage following first eligibility limited to the lower of 6 months or re-employment eligibility of a comparable plan with another employer | ||
Equity Compensation | •Immediate vesting of 25% of unvested equity awards upon termination | ||
•Extension of post-termination exercise period of vested stock options from 3 months to 6 months |
Named Executive Officer | Lump-Sum Payment (1) | Vesting of 25% of all Unvested Equity Compensation Awards (2) | COBRA Benefits for up to 6 Months (Medical, Dental and Vision Benefits) (3) | |||
($) | ($) | ($) | ||||
David W. Moon | 310,000 | 803,647 | — | |||
Michael S. Mancini | 200,000 | 230,834 | 24,459 | |||
Rodney Clemente | 200,000 | 455,245 | 17,300 | |||
Natarajan Ramanan (5) | 175,000 | 133,828 | 13,003 | |||
William W. Yeung | 197,000 | 299,125 | 24,459 | |||
Chair of the Compensation Committee | Committee Members | ||
Joan K. Chow | Alexander J. Buehler | Colin R. Sabol | Pamela L. Tondreau |

Stockholders Holding more than 5% of Common Stock | Shares Beneficially Owned (1) | Percent of Class (2) | ||
(#) | (%) | |||
Ameriprise Financial, Inc. (3) | 5,258,831 | 10.1 | ||
145 Ameriprise Financial Center Minneapolis, MN 55474 | ||||
Amundi (4) | 2,852,138 | 5.5 | ||
91-93 Boulevard Pasteur 75015 Paris, France | ||||
BlackRock, Inc. (5) | 4,875,598 | 9.4 | ||
50 Hudson Yards New York, NY 10001 | ||||
Directors, Named Executive Officers, and Current Group | Number of Shares Owned Directly and Indirectly | Number of Shares Exercisable or Vested within 60 days after April 6, 2026 | Total Shares Beneficially Owned (1) | Percent of Class (2) | ||||
(#) | (#) | (#) | (%) | |||||
Arve Hanstveit (6) | 530,471 | 64,687 | 595,158 | 1.1 | ||||
William W. Yeung (7) | 24,818 | 130,298 | 155,116 | 0.3 | ||||
David W. Moon (8) | 38,893 | 105,508 | 144,401 | 0.3 | ||||
Alexander J. Buehler | 54,290 | 80,014 | 134,304 | 0.3 | ||||
Rodney Clemente | — | 70,911 | 70,911 | 0.1 | ||||
Directors, Named Executive Officers, and Current Group | Number of Shares Owned Directly and Indirectly | Number of Shares Exercisable or Vested within 60 days after April 6, 2026 | Total Shares Beneficially Owned (1) | Percent of Class (2) | ||||
Pamela L. Tondreau | 41,043 | 28,964 | 70,007 | 0.1 | ||||
Michael S. Mancini | — | 95,550 | 95,550 | 0.2 | ||||
Joan K. Chow (9) | 23,484 | — | 23,484 | * | ||||
Colin R. Sabol | 17,359 | — | 17,359 | * | ||||
Natarajan Ramanan | — | 17,611 | 17,611 | * | ||||
All named executive officers and directors as a group (10 persons) | 730,358 | 593,543 | 1,323,901 | 2.5 | ||||
Named Executive Officer | Year | Salary | Stock Award (1) | Option Award (2) | Non-Equity Incentive Compensation (3) | All Other Compensation (4) | Total | |||||||
($) | ($) | ($) | ($) | ($) | ($) | |||||||||
David W. Moon | (5) | 2025 | 614,231 | 2,599,996 | — | — | 7,920 | 3,222,147 | ||||||
President and Chief Executive Officer | (5) | 2024 | 568,385 | 1,299,991 | 1,299,995 | 338,542 | 238,725 | 3,745,638 | ||||||
Michael S. Mancini | (6) | 2025 | 400,000 | 999,996 | — | 70,000 | 60,912 | 1,530,908 | ||||||
Chief Financial Officer | 2024 | 146,154 | — | 1,499,995 | 86,681 | 17,578 | 1,750,408 | |||||||
Rodney Clemente | 2025 | 398,846 | 999,996 | — | 70,000 | 51,040 | 1,519,882 | |||||||
Senior Vice President, Water | 2024 | 372,739 | 1,129,988 | — | 201,886 | 19,065 | 1,723,678 | |||||||
(7) | 2023 | 352,608 | 1,281,286 | — | 192,173 | 19,067 | 1,845,133 | |||||||
Natarajan Ramanan | 2025 | 275,962 | 599,992 | 434,010 | — | 38,511 | 1,348,475 | |||||||
Chief Technology Officer | ||||||||||||||
William W. Yeung | 2025 | 391,692 | 699,994 | — | — | 68,029 | 1,159,715 | |||||||
Chief Legal Officer | 2024 | 352,577 | 638,999 | — | 188,550 | 26,863 | 1,206,989 | |||||||
2023 | 332,732 | 659,389 | — | 177,135 | 26,413 | 1,195,669 | ||||||||
Named Executive Officer | Year | Insurance Premiums | 401(k) Match | Other (a) | Total | ||||||
($) | ($) | ($) | ($) | ||||||||
David W. Moon | 2025 | 7,920 | — | — | 7,920 | ||||||
2024 | 8,230 | 5,237 | 225,258 | 238,725 | |||||||
2023 | 442 | — | 176 | 618 | |||||||
Michael S. Mancini | 2025 | 53,612 | 7,300 | 60,912 | |||||||
2024 | 367 | 1,385 | 673 | 2,425 | |||||||
Rodney Clemente | 2025 | 40,540 | 10,500 | — | 51,040 | ||||||
2024 | 8,715 | 10,350 | — | 19,065 | |||||||
2023 | 8,565 | 9,900 | 601 | 19,067 | |||||||
Natarajan Ramanan | 2025 | 30,232 | 8,279 | — | 38,511 | ||||||
2024 | |||||||||||
2023 | |||||||||||
William W. Yeung | 2025 | 57,529 | 10,500 | — | 68,029 | ||||||
2024 | 16,513 | 10,350 | — | 26,863 | |||||||
2023 | 16,513 | 9,900 | — | 26,413 | |||||||
Year | Principal Executive Officer (1) | Other Named Executive Officers (2) | Value of Initial Fixed $100 Investment Based On: | Net Income | Operating Income | |||||||||||
Summary Compensation Table | Compensation Actually Paid (3) | Summary Compensation Table | Compensation Actually Paid (4) | Total Shareholder Return (5) | Peer Group Total Shareholder Return (6) | |||||||||||
($) | ($) | ($) | ($) | ($) | ($) | ($) | ($) | |||||||||
(In thousands, except value of initial fixed investment which are presented in whole dollars) | ||||||||||||||||
2025 | ||||||||||||||||
2024 | ||||||||||||||||
2023 | ||||||||||||||||
2022 | ||||||||||||||||
2021 | ||||||||||||||||
NEOs | 2025 | 2024 | 2023 | 2022 | 2021 | |||||
Joshua Ballard (a) | ü | ü | ü | ü | ||||||
Rodney Clemente | ü | ü | ü | ü | ü | |||||
Farshad Ghasripoor (b) | ü | ü | ü | ü | ||||||
Michael Mancini (c) | ü | ü | ||||||||
Natarajan Ramanan (d) | ü | |||||||||
William Yeung | ü | ü | ü | ü | ü | |||||
Deductions | Adjustments | |||||||||||||
Year | Summary Compensation Table | Stock Awards Granted in the Year | Fair Value of Equity Awards Granted in the Year and Unvested at Year End | Year over Year Change in Fair Value of Outstanding and Unvested Equity Awards | Year over Year Change in Fair Value of Equity Awards Granted in Prior Years that Vested in the Year | Total Adjustments from Amounts Presented in the Summary Compensation Table * | Total Compensation * | |||||||
($) | ($) | ($) | ($) | ($) | ($) | ($) | ||||||||
(In thousands) | ||||||||||||||
2025 | ( | ( | ( | |||||||||||
2024 | ( | ( | ( | |||||||||||
2023 | ( | ( | ( | |||||||||||
2022 | ( | ( | ( | |||||||||||
2021 | ( | |||||||||||||
Deductions | Adjustments | |||||||||||||||
Year | Summary Compensation Table | Stock Awards Granted in the Year | Fair Value of Equity Awards Granted in the Year and Unvested at Year End | Year over Year Change in Fair Value of Outstanding and Unvested Equity Awards | Year over Year Change in Fair Value of Equity Awards Granted in Prior Years that Vested in the Year | Fair Value at the End of the Prior Year of Equity Awards that Failed to Meet Vesting Conditions in the Year | Total Adjustments from Amounts Presented in the Summary Compensation Table * | Total Compensation * | ||||||||
($) | ($) | ($) | ($) | ($) | ($) | ($) | ($) | |||||||||
(In thousands) | ||||||||||||||||
2025 | ( | ( | ( | ( | ||||||||||||
2024 | ( | ( | ( | ( | ( | |||||||||||
2023 | ( | ( | ( | |||||||||||||
2022 | ( | ( | ( | ( | ||||||||||||
2021 | ( | |||||||||||||||
Estimated future payouts under non-equity incentive plan awards | All other stock awards: Number of shares of stock or units | All other option awards: Number of securities underlying options | Base price of stock awards or fair value of option awards | Grant date fair value of stock and option awards (1)(2) | ||||||||||||
Named Executive Officer | Grant Date | Threshold | Target | Maximum | ||||||||||||
($) | ($) | ($) | (#) | (#) | ($/Sh) | ($) | ||||||||||
David W. Moon (3) | 1/23/25 | — | 615,833 | — | 88,980 | 14.61 | 1,299,998 | |||||||||
Michael S. Mancini (3) | 1/23/25 | — | 280,000 | — | 34,223 | 14.61 | 499,998 | |||||||||
Rodney Clemente (3) | 1/23/25 | — | 279,417 | — | 34,223 | — | 14.61 | 499,998 | ||||||||
Natarajan Ramanan (3) | 3/3/25 | — | 192,500 | — | — | 65,030 | 6.15 | 434,010 | ||||||||
William W. Yeung (3) | 1/23/25 | — | 235,400 | — | 23,956 | — | 14.61 | 349,997 | ||||||||
Option Awards (1) | Stock Awards (1) | ||||||||||||||
Named Executive Officer | Date of Grant | Number of Securities Underlying Unexercised Options Exercisable | Number of Securities Underlying Unexercised Options Unexercisable | Option Exercise Price | Option Expiration Date | Number of shares or units of stock that have not vested | Market value of shares or units of stock that have not vested (2) | ||||||||
(#) | (#) | ($) | (#) | ($) | |||||||||||
David W. Moon | (3) | 1/25/24 | 93,334 | 101,451 | 16.16 | 1/25/34 | — | — | |||||||
(4) | 1/25/24 | — | — | — | 60,334 | 813,906 | |||||||||
(6) | 1/23/25 | 177,960 | 2,400,680 | ||||||||||||
93,334 | 101,451 | 238,294 | 3,214,586 | ||||||||||||
Michael S. Mancini | (3) | 8/5/24 | 76,440 | 152,882 | 16.03 | 8/5/34 | — | — | |||||||
(6) | 1/23/25 | 68,446 | 923,337 | ||||||||||||
76,440 | 152,882 | 68,446 | 923,337 | ||||||||||||
Rodney Clemente | (3) | 1/31/20 | 13,718 | — | 10.21 | 1/31/30 | — | — | |||||||
(3) | 2/1/21 | 33,519 | — | 13.96 | 2/1/31 | — | — | ||||||||
(3) | 1/28/22 | 23,180 | 494 | 18.99 | 1/28/32 | — | — | ||||||||
(4) | 1/28/22 | — | — | — | 2,304 | 31,081 | |||||||||
(4) | 1/30/23 | — | — | — | 4,087 | 55,134 | |||||||||
(4) | 7/25/23 | — | — | — | 7,707 | 103,957 | |||||||||
(5) | 1/25/24 | — | — | — | 52,444 | 707,470 | |||||||||
(6) | 1/23/25 | 68,446 | 923,337 | ||||||||||||
70,417 | 494 | 134,988 | 1,820,978 | ||||||||||||
Natarajan Ramanan | (7) | 3/3/25 | — | 65,030 | 15.12 | 3/3/35 | — | — | |||||||
(7) | 3/3/25 | — | — | — | 0 | 39,682 | 535,310 | ||||||||
— | 65,030 | 39,682 | 535,310 | ||||||||||||
William W. Yeung | (3) | 2/1/21 | 26,336 | — | 13.96 | 2/1/31 | — | — | |||||||
(3) | 1/28/22 | 19,870 | 423 | 18.99 | 1/28/32 | — | — | ||||||||
(4) | 1/28/22 | — | — | — | 1,975 | 26,643 | |||||||||
(4) | 1/30/23 | — | — | — | 3,503 | 47,255 | |||||||||
(5) | 7/25/23 | — | — | — | 5,558 | 74,977 | |||||||||
(4) | 1/25/24 | — | — | — | 29,657 | 400,073 | |||||||||
(6) | 1/23/25 | — | — | 47,912 | 646,333 | ||||||||||
46,206 | 423 | 88,605 | 1,195,281 | ||||||||||||
Option Awards | Stock Awards | |||||||
Named Executive Officer | Number of shares acquired on exercise | Value realized on exercise | Number of shares acquired on vesting | Valued realized on vesting (1) | ||||
(#) | ($) | (#) | ($) | |||||
David W. Moon | — | — | 20,111 | 289,598 | ||||
Michael S. Mancini | x | — | — | — | — | |||
x | ||||||||
x | ||||||||
Rodney Clemente | — | — | 35,306 | 509,571 | ||||
Natarajan Ramanan | x | — | — | — | — | |||
x | ||||||||
x | ||||||||
William W. Yeung | 69,656 | 478,755 | 24,269 | 351,773 | ||||


Proposal No. 3 – Ratification of Appointment of Independent Registered Public Accounting Firm |
2025 | 2024 | ||
($) | ($) | ||
Audit Fees (1) | 1,160,000 | 1,103,105 | |
Tax Fees (2) | 83,896 | 56,746 | |
All Other Fees (3) | 1,895 | 1,895 | |
Total | 1,245,791 | 1,161,746 | |
Chair of the Audit Committee | Committee Members | |
Alexander J. Buehler | Joan K. Chow | Arve Hanstveit |

Proposal No. 4 – Approval of Amendment No. 1 to the Energy Recovery, Inc. 2020 Incentive Plan |
Total shares underlying outstanding options | 1,376,267 |
Weighted-average exercise price of outstanding options | $13.83 |
Weighted-average remaining contractual life of outstanding options | 1.57 years |
Total shares underlying outstanding unvested restricted stock units | 1,302,870 |
Total shares of common stock outstanding | 52,001,859 |
Total shares available for grant under our equity compensation plans1 | 1,648,665 |
2023 | 2024 | 2025 | |||
Stock options granted | 14,341 | 720,793 | 144,185 | ||
Restricted stock unit awards granted | 538,316 | 750,670 | 1,010,854 | ||
Total equity awards granted | 552,657 | 1,471,463 | 1,155,039 | ||
Weighted-average (basic) common stock outstanding | 56,444 | 57,213 | 53,802 | ||
Annual equity plan utilization rate (“burn rate”) | 0.98% | 2.57% | 1.96% |
Name and Position/Group | Number of Shares Covered by Awards |
David W. Moon | 554,348 |
Michael S. Mancini | 380,466 |
Rodney Clemente | 266,769 |
Natarajan Ramanan | 156,312 |
William W. Yeung | 251,220 |
All executive officers as a group | 1,609,115 |
All non-employee directors as a group | 236,664 |
All employees, including all executive officers and non- employee directors, as a group | 2,268,521 |
Plan Category | Number of Securities to Be Issued Upon Exercise of Outstanding Options, Warrants, and Rights (# of Shares)(1) | Weighted- Average Exercise Price of Outstanding Options, Warrants, and Rights ($ per Share) | Number of Securities Remaining Available for Future Issuance Under Equity Compensation Plans (# of Shares) |
Equity compensation plans approved by security holders | 2,740,758 | $13.91 | 2,449,603 |
Equity compensation plans not approved by security holders | None | Not Applicable | Not Applicable |
OTHER MATTERS |
Proposal No. | Vote | Board Voting Recommendation | Routine or Non- Routine (1) | Discretionary Voting by Broker Permitted? | Vote Required for Approval | Impact of Abstention | Impact of Broker Non-votes (Uninstructed Shares) | |||||||
1 | Election of the director nominees | FOR | Non- routine | No | Plurality (2) | No impact | No impact | |||||||
2 | Advisory, non- binding approval of executive compensation | FOR | Non- routine | No | Majority of shares present or represented by proxy and entitled to vote | Has the same effect as a vote against | No impact | |||||||
3 | Ratification of independent public accountants | FOR | Routine | Yes | Majority of shares present or represented by proxy and entitled to vote | Has the same effect as a vote against | Broker has the discretion to vote | |||||||
4 | Approval of amendment to incentive plan | FOR | Non- routine | No | Majority of shares present or represented by proxy and entitled to vote | Has the same effect as a vote against | No impact | |||||||
ANNUAL REPORT |
APPENDIX A |
Date of Board Action May 5, 2020 | Action Initial Plan Adoption | Section/Effect of Amendment | Date of Shareholder Approval July 16, 2020 |
April 15, 2026 | Amendment No.1 | 4.1 |