TWO Reports Second Quarter 2026 Financial Results
NEW YORK, July 28, 2026 - TWO (Two Harbors Investment Corp., NYSE: TWO), an MSR-focused real estate investment trust (REIT), today announced its financial results for the quarter ended June 30, 2026.
Quarterly Summary
•Continued to advance toward closing of merger with CrossCountry Mortgage, LLC (CCM).
◦Pursuant to the definitive merger agreement, as amended, CCM will acquire all of the outstanding shares of TWO common stock for $12.00 per share.
◦Holders of TWO’s Series A, Series B and Series C Preferred Stock will have their shares redeemed following the closing of the transaction at $25.00 per share, plus any accumulated and unpaid dividends, in accordance with the terms of the preferred stock.
◦On July 2, 2026, TWO common stockholders approved the merger; the transaction is expected to close on August 3, 2026, subject to the satisfaction of certain remaining closing conditions.
◦On July 23, 2026, declared a “stub period” dividend of $0.12196 per share of common stock for the third quarter of 2026, subject to the consummation of the merger.
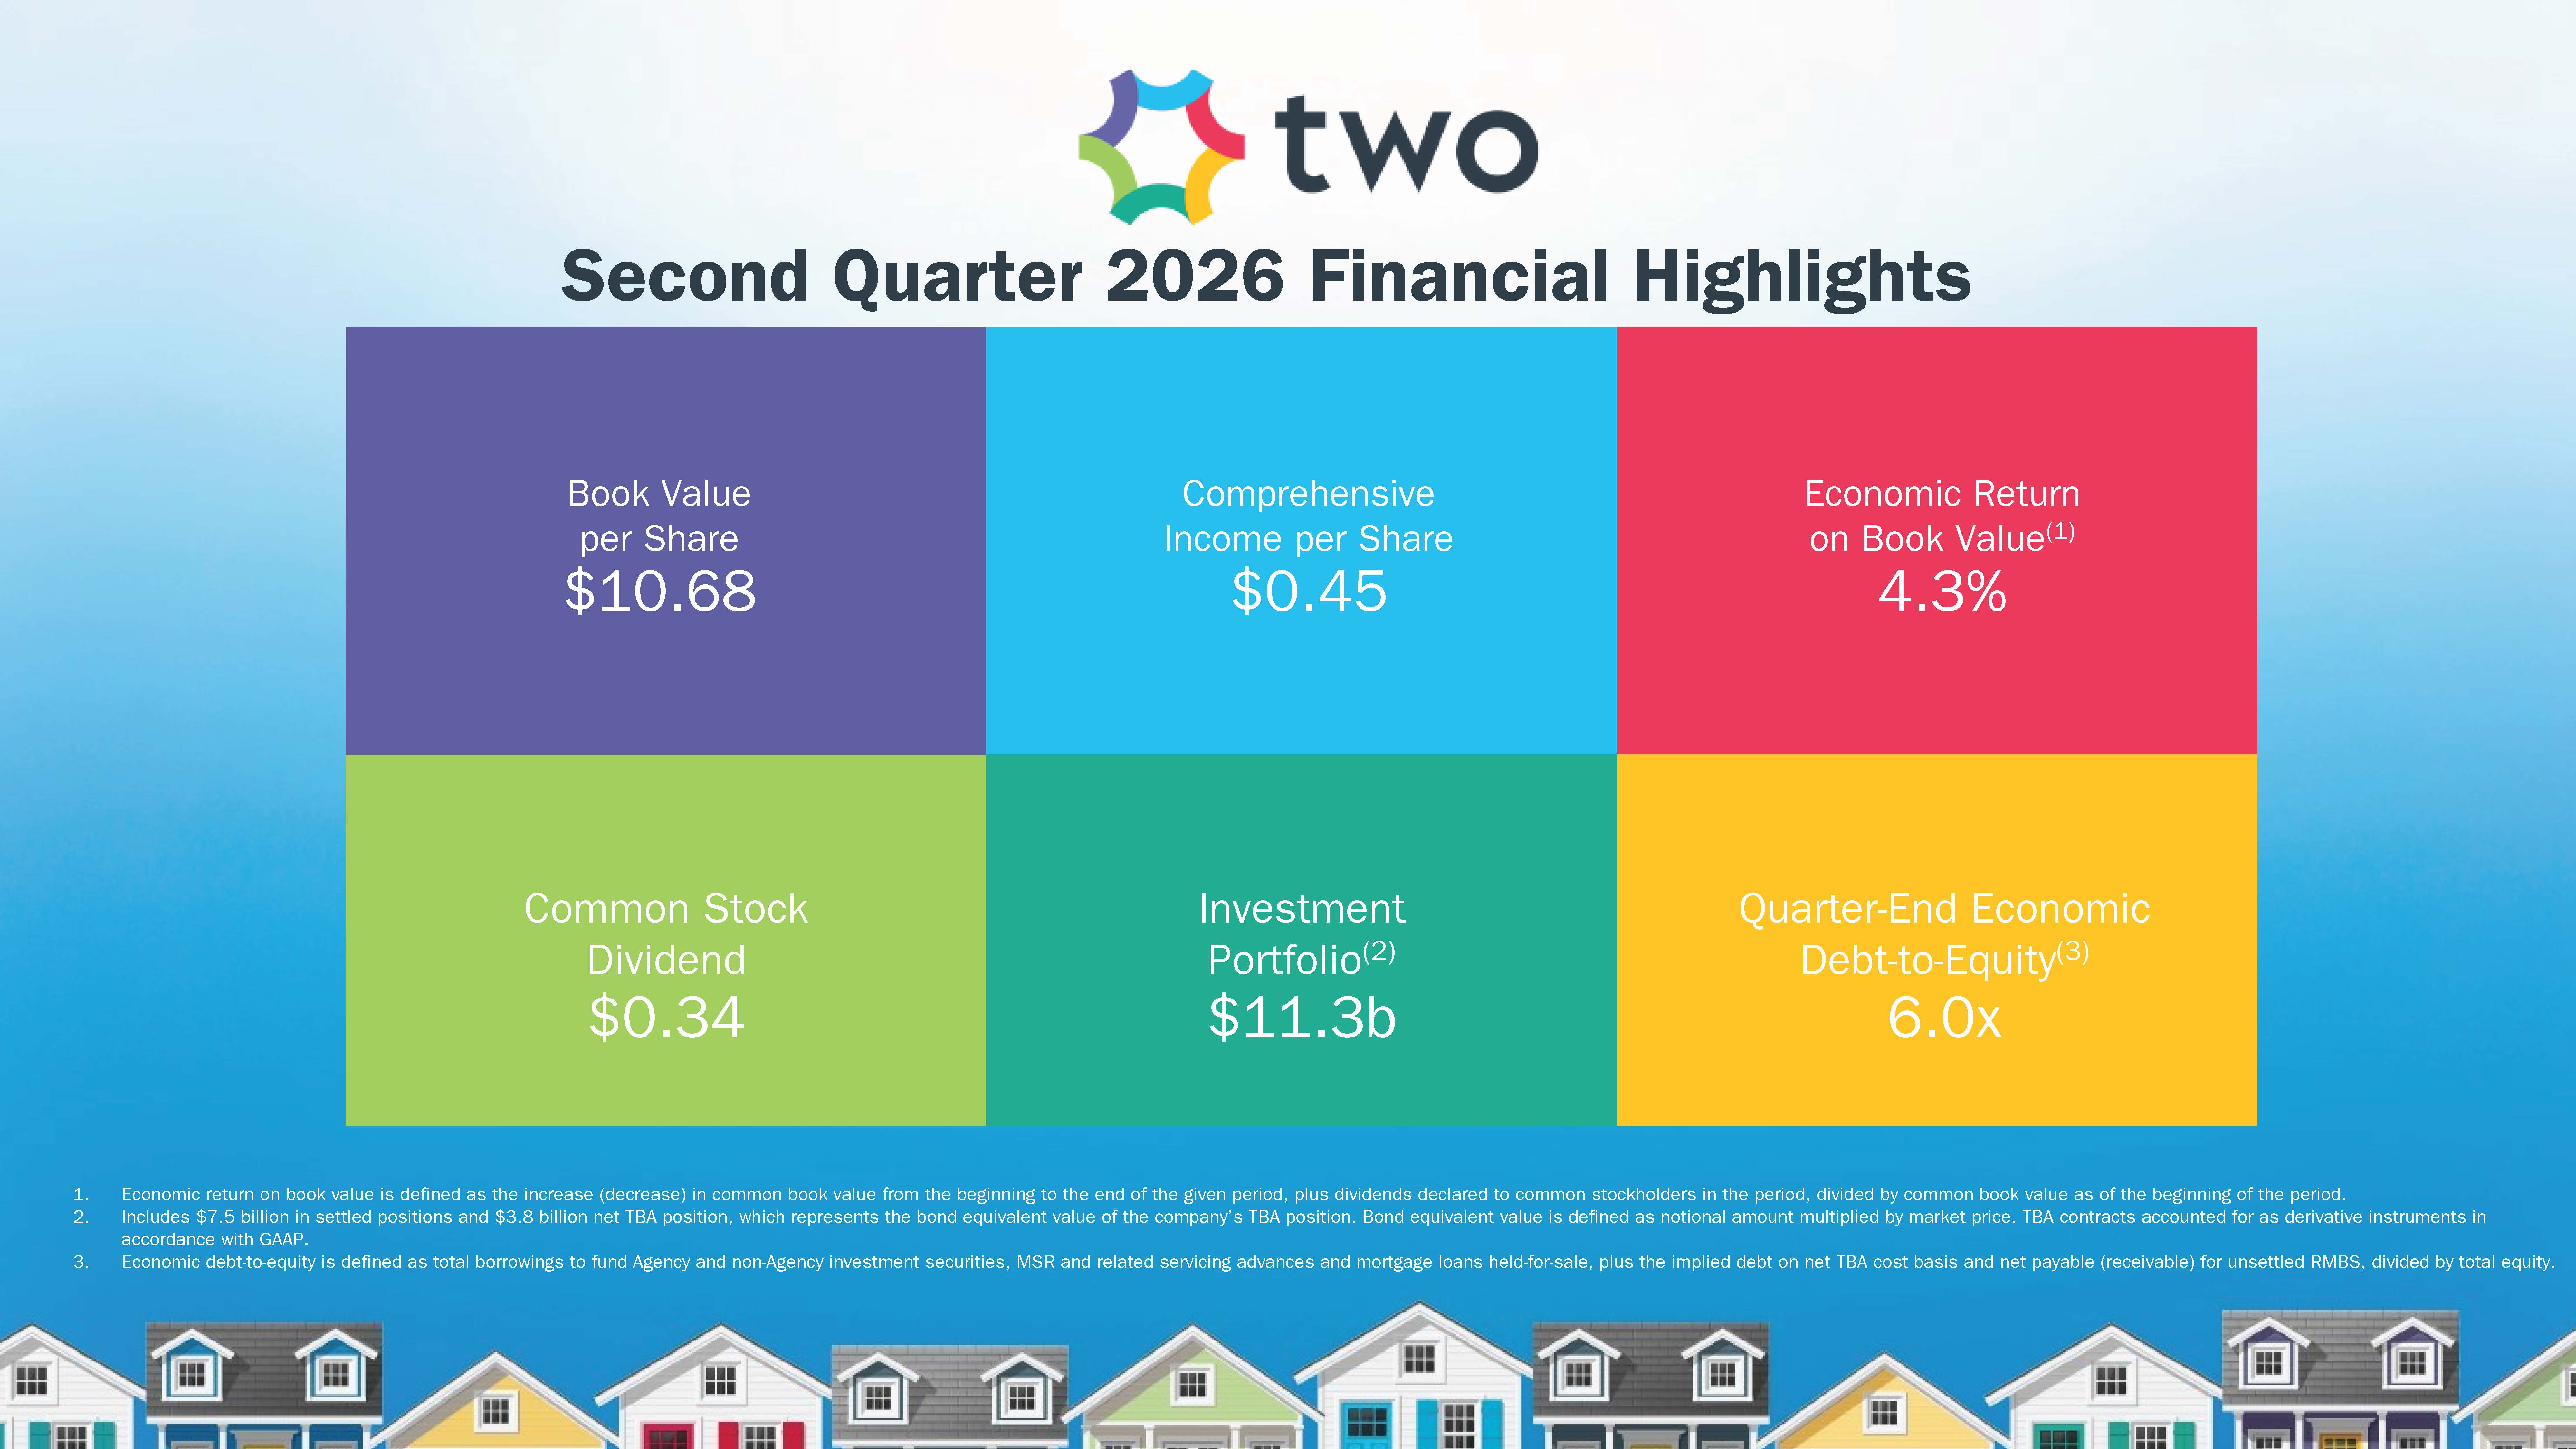
•Reported book value of $10.68 per common share, and declared a second quarter common stock dividend of $0.34 per share, representing a 4.3% quarterly economic return on book value.(1)
•Generated comprehensive income of $47.9 million, or $0.45 per weighted average basic common share.
•Added $186.5 million in unpaid principal balance (UPB) of MSR through flow-sale acquisitions and recapture.
•As of June 30, 2026, MSR portfolio had a weighted average gross coupon rate of 3.54% and a 60+ day delinquency rate of 0.79%, and had experienced a 3-month CPR of 6.3%.
•Funded $84.0 million UPB in loans and brokered an additional $48.8 million UPB in second lien loans.
________________
(1)Economic return on book value is defined as the increase (decrease) in common book value from the beginning to the end of the given period, plus dividends declared to common stockholders in the period, divided by common book value as of the beginning of the period.
Operating Performance
The following table summarizes the company’s GAAP and non-GAAP earnings measurements and key metrics for the second quarter of 2026 and first quarter of 2026:
| | | | | | | | | | | | | | | | | | | | | | | | | | | | | | | | | | | | | | |
| Operating Performance (unaudited) |
| (dollars in thousands, except per common share data) |
| | Three Months Ended June 30, 2026 |
| Three Months Ended March 31, 2026 |
Earnings Attributable to Common Stockholders | | Earnings |
| Per weighted average basic common share |
| Annualized return on average common equity |
| Earnings |
| Per weighted average basic common share |
| Annualized return on average common equity |
| Comprehensive Income (Loss) | | $ | 47,921 | |
| $ | 0.45 | |
| 17.0 | % |
| $ | (24,714) | | | $ | (0.24) | | | (8.4) | % |
| GAAP Net Income | | $ | 49,379 | |
| $ | 0.47 | |
| 17.5 | % |
| $ | 19,477 | | | $ | 0.18 | | | 6.6 | % |
| | | | | | | | | | | | |
Earnings Available for Distribution(1) | | $ | 29,600 | |
| $ | 0.28 | |
| 10.5 | % |
| $ | 35,756 | | | $ | 0.34 | | | 12.2 | % |
| | | | | | | | | | | | |
| | | | | | | | | | | | |
Operating Metrics | |
|
|
|
|
|
|
|
|
|
|
|
| Dividend per common share | | $ | 0.34 | |
|
|
|
|
| $ | 0.34 | |
|
|
|
|
Annualized dividend yield(2) | | 11.0 | % | | | | | | 11.9 | % | | | | |
| Book value per common share at period end | | $ | 10.68 | |
|
|
|
|
| $ | 10.57 | |
|
|
|
|
Economic return on book value(3) | | 4.3 | % | | | | | | (2.0) | % | | | | |
Operating expenses, excluding non-cash LTIP amortization and merger-related costs(4) | | $ | 36,314 | |
|
|
|
|
| $ | 39,391 | |
|
|
|
|
Operating expenses, excluding non-cash LTIP amortization and merger-related costs, as a percentage of average equity(4) | | 8.3 | % | | | | | | 8.8 | % | | | | |
_______________
(1)Earnings Available for Distribution, or EAD, is a non-GAAP measure. Please see page 11 for a definition of EAD and a reconciliation of GAAP to non-GAAP financial information. (2)Dividend yield is calculated based on annualizing the dividends declared in the given period, divided by the closing share price as of the end of the period.
(3)Economic return on book value is defined as the increase (decrease) in common book value from the beginning to the end of the given period, plus dividends declared to common stockholders in the period, divided by the common book value as of the beginning of the period.
(4)Excludes non-cash equity compensation expense of $1.4 million for the second quarter of 2026 and $4.4 million for the first quarter of 2026 and merger-related costs of $13.6 million for the second quarter of 2026 and $5.6 million for the first quarter of 2026. Merger-related costs consist of expenses incurred in connection with the company’s pending merger with CCM, as well as its terminated merger agreement with UWM Holdings Corporation.
Portfolio Summary
As of June 30, 2026, the company’s portfolio was comprised of $7.5 billion of Agency RMBS, MSR and other investment securities as well as their associated notional debt hedges. Additionally, the company held $3.8 billion bond equivalent value of net long to-be-announced securities (TBAs).
The following tables summarize the company’s investment portfolio as of June 30, 2026 and March 31, 2026:
| | | | | | | | | | | | | | | | | | | | | | | | | | |
|
|
|
Investment Portfolio Composition | | As of June 30, 2026 | | As of March 31, 2026 |
(dollars in thousands) | | (unaudited) | | (unaudited) |
| Agency RMBS | | $ | 5,143,043 | | | 68.8 | % | | $ | 6,568,185 | | | 73.4 | % |
Mortgage servicing rights(1) | | 2,336,324 | | | 31.2 | % | | 2,380,983 | | | 26.6 | % |
| Other | | 2,982 | | | — | % | | 3,149 | | | — | % |
| Aggregate Portfolio | | 7,482,349 | | | | | 8,952,317 | | | |
Net TBA position(2) | | 3,814,318 | | | | 2,976,531 | | |
| Total Portfolio | | $ | 11,296,667 | | | | | $ | 11,928,848 | | | |
________________
(1)Based on the prior month-end’s principal balance of the loans underlying the company’s MSR, increased for current month purchases.
(2)Represents bond equivalent value of TBA position. Bond equivalent value is defined as notional amount multiplied by market price. Accounted for as derivative instruments in accordance with GAAP.
| | | | | | | | | | | | | | |
| Portfolio Metrics Specific to Agency RMBS | | As of June 30, 2026 | | As of March 31, 2026 |
| | (unaudited) | | (unaudited) |
| | | | |
Weighted average cost basis(1) | | $ | 102.07 | | | $ | 101.72 | |
| | | | |
| Weighted average experienced three-month CPR | | 10.8 | % | | 8.6 | % |
| Gross weighted average coupon rate | | 6.3 | % | | 6.2 | % |
| Weighted average loan age (months) | | 29 | | | 24 | |
______________
(1)Weighted average cost basis includes Agency principal and interest RMBS only and utilizes carrying value for weighting purposes.
| | | | | | | | | | | | | | |
Portfolio Metrics Specific to MSR(1) | | As of June 30, 2026 | | As of March 31, 2026 |
(dollars in thousands) | | (unaudited) | | (unaudited) |
| Unpaid principal balance | | $ | 155,106,720 | | | $ | 158,871,352 | |
| Gross coupon rate | | 3.5 | % | | 3.5 | % |
| Current loan size | | $ | 319 | | | $ | 321 | |
Original FICO(2) | | 760 | | 760 |
| Original LTV | | 73 | % | | 73 | % |
| 60+ day delinquencies | | 0.8 | % | | 0.8 | % |
| Net servicing fee | | 25.3 basis points | | 25.3 basis points |
| | | | |
| | Three Months Ended June 30, 2026 | | Three Months Ended March 31, 2026 |
| | (unaudited) | | (unaudited) |
| Fair value losses | | $ | (47,239) | | | $ | (44,009) | |
| Servicing income | | $ | 118,350 | | | $ | 119,364 | |
| Servicing costs | | $ | 3,229 | | | $ | 1,807 | |
| Change in servicing reserves | | $ | (18) | | | $ | 41 | |
________________
(1)Metrics exclude residential mortgage loans in securitization trusts for which the company is the named servicing administrator. Portfolio metrics, other than UPB, represent averages weighted by UPB.
(2)FICO represents a mortgage industry accepted credit score of a borrower.
| | | | | | | | | | | | | | | | | | | | | | | | | | |
| | As of June 30, 2026 | | As of March 31, 2026 |
Serviced Mortgage Assets | | Number of Loans | | Unpaid Principal Balance | | Number of Loans | | Unpaid Principal Balance |
(dollars in thousands) | | (unaudited) | | (unaudited) |
| Mortgage servicing rights | | 655,023 | | | $ | 155,106,720 | | | 665,942 | | | $ | 158,871,352 | |
Subservicing(1) | | 184,963 | | | 40,834,058 | | | 179,899 | | | 40,051,658 | |
Servicing administrator(2) | | 495 | | | 258,559 | | | 505 | | | 265,953 | |
Mortgage loans held-for-sale(3) | | 56 | | | 12,542 | | | 70 | | | 18,391 | |
| | | | | | | | |
| Total serviced mortgage assets | | 840,537 | | | $ | 196,211,879 | | | 846,416 | | | $ | 199,207,354 | |
________________
(1)Off-balance sheet mortgage loans owned by third parties and subserviced by the company.
(2)Off-balance sheet mortgage loans owned by third parties for which the company acts as servicing administrator (subserviced by appropriately licensed third-party subservicers).
(3)Originated or purchased mortgage loans held-for-sale at period-end.
| | | | | | | | | | | | | | |
Other Investments and Risk Management Metrics | | As of June 30, 2026 | | As of March 31, 2026 |
(dollars in thousands) | | (unaudited) | | (unaudited) |
Net long TBA notional(1) | | $ | 3,828,003 | | | $ | 3,019,003 | |
Futures notional | | $ | (5,637,700) | | | $ | (6,354,300) | |
| | | | |
| | | | |
Interest rate swaps notional | | $ | 11,676,749 | | | $ | 11,435,749 | |
| | | | |
| | | | |
________________
(1)Accounted for as derivative instruments in accordance with GAAP.
Financing Summary
The following tables summarize the company’s secured and unsecured financing arrangements and related metrics as of June 30, 2026 and March 31, 2026:
| | | | | | | | | | | | | | | | | | | | | | | | | | |
| June 30, 2026 | | Balance | | Weighted Average Borrowing Rate | | Weighted Average Months to Maturity | | Number of Distinct Counterparties |
| (dollars in thousands, unaudited) | | | | | | | | |
| Repurchase agreements collateralized by securities | | $ | 5,057,324 | | | 3.83 | % | | 1.79 | | | 16 | |
| Repurchase agreements collateralized by MSR | | 575,000 | | | 6.69 | % | | 4.72 | | | 3 | |
| Repurchase agreements collateralized by mortgage loans | | 7,506 | | | 5.62 | % | | 2.82 | | | 1 | |
| | | | | | | | |
| Total repurchase agreements | | 5,639,830 | | | 4.12 | % | | 2.09 | | | 18 | |
Revolving credit facilities collateralized by MSR and related servicing advance obligations | | 862,771 | | | 6.67 | % | | 16.31 | | | 3 | |
Warehouse lines of credit collateralized by mortgage loans | | 4,333 | | | 5.59 | % | | 2.76 | | | 1 | |
| Unsecured senior notes | | 111,350 | | | 9.38 | % | | 49.55 | | | n/a |
| | | | | | | | |
| Total borrowings | | $ | 6,618,284 | | | | | | | |
| | | | | | | | | | | | | | | | | | | | | | | | | | |
| March 31, 2026 |
| Balance |
| Weighted Average Borrowing Rate |
| Weighted Average Months to Maturity |
| Number of Distinct Counterparties |
| (dollars in thousands, unaudited) |
|
|
|
|
|
|
|
|
| Repurchase agreements collateralized by securities |
| $ | 6,665,054 | |
| 3.85 | % |
| 2.32 | |
| 16 | |
| Repurchase agreements collateralized by MSR |
| 575,000 | |
| 6.71 | % |
| 7.05 | |
| 3 | |
| Repurchase agreements collateralized by mortgage loans | | 5,233 | | | 5.68 | % | | 2.75 | | | 1 | |
| | | | | | | | |
| Total repurchase agreements |
| 7,245,287 | |
| 4.07 | % |
| 2.69 | |
| 18 | |
Revolving credit facilities collateralized by MSR and related servicing advance obligations |
| 916,871 | |
| 6.68 | % | | 18.41 | |
| 3 | |
Warehouse lines of credit collateralized by mortgage loans | | 12,694 | | | 5.67 | % | | 2.83 | | | 1 | |
| Unsecured senior notes | | 111,200 | | | 9.38 | % | | 52.54 | | | n/a |
| | | | | | | | |
| Total borrowings |
| $ | 8,286,052 | |
|
|
|
|
|
|
| | | | | | | | | | | | | | |
| Borrowings by Collateral Type | | As of June 30, 2026 | | As of March 31, 2026 |
| (dollars in thousands) | | (unaudited) | | (unaudited) |
| Agency RMBS | | $ | 5,057,324 | | | $ | 6,665,054 | |
| Mortgage servicing rights and related servicing advance obligations | | 1,437,771 | | | 1,491,871 | |
| Other - secured | | 11,839 | | | 17,927 | |
Other - unsecured(1) | | 111,350 | | | 111,200 | |
| Total | | 6,618,284 | | | 8,286,052 | |
| TBA cost basis | | 3,802,578 | | | 2,981,694 | |
| Net payable (receivable) for unsettled RMBS | | — | | | (230,695) | |
| Total, including TBAs and net payable (receivable) for unsettled RMBS | | $ | 10,420,862 | | | $ | 11,037,051 | |
Debt-to-equity ratio at period-end(2) | | 3.8 | :1.0 | | 4.8 | :1.0 |
Economic debt-to-equity ratio at period-end(3) | | 6.0 | :1.0 | | 6.4 | :1.0 |
| | | | |
Cost of Financing by Collateral Type(4) | | Three Months Ended June 30, 2026 | | Three Months Ended March 31, 2026 |
| | (unaudited) | | (unaudited) |
| Agency RMBS | | 3.86 | % | | 3.98 | % |
Mortgage servicing rights and related servicing advance obligations(5) | | 7.16 | % | | 7.13 | % |
| Other - secured | | 5.84 | % | | 6.18 | % |
Other - unsecured(1)(5) | | 10.23 | % | | 9.35 | % |
| Annualized cost of financing | | 4.59 | % | | 4.68 | % |
Interest rate swaps(6) | | (0.05) | % | | (0.06) | % |
U.S. Treasury futures(7) | | (0.01) | % | | (0.11) | % |
TBAs(8) | | 3.73 | % | | 3.72 | % |
Total annualized cost of financing(8) | | 4.28 | % | | 4.20 | % |
____________________
(1)Unsecured borrowings under senior notes and, prior to their January 15, 2026 maturity date, convertible senior notes.
(2)Defined as total borrowings to fund Agency and non-Agency investment securities, MSR and related servicing advances and mortgage loans held-for-sale, divided by total equity.
(3)Defined as total borrowings to fund Agency and non-Agency investment securities, MSR and related servicing advances and mortgage loans held-for-sale, plus the implied debt on net TBA cost basis and net payable (receivable) for unsettled RMBS, divided by total equity.
(4)Excludes any repurchase agreements collateralized by U.S. Treasuries.
(5)Includes amortization of debt issuance costs.
(6)The cost of financing on interest rate swaps held to mitigate interest rate risk associated with the company’s outstanding borrowings includes interest spread income/expense and amortization of upfront payments made or received upon entering into interest rate swap agreements and is calculated using average borrowings balance as the denominator.
(7)The cost of financing on U.S. Treasury futures held to mitigate interest rate risk associated with the company’s outstanding borrowings is calculated using average borrowings balance as the denominator. U.S. Treasury futures income is the economic equivalent to holding and financing a relevant cheapest-to-deliver U.S. Treasury note or bond using short-term repurchase agreements.
(8)The implied financing benefit/cost of dollar roll income on TBAs is calculated using the average cost basis of TBAs as the denominator. TBA dollar roll income is the non-GAAP economic equivalent to holding and financing Agency RMBS using short-term repurchase agreements. TBAs are accounted for as derivative instruments in accordance with GAAP.
Conference Call
TWO will not be hosting a conference call to discuss its second quarter 2026 financial results. Investors may contact TWO Investor Relations at investors@twoinv.com with questions.
About TWO
Two Harbors Investment Corp., or TWO, a Maryland corporation, is a real estate investment trust that invests in mortgage servicing rights, residential mortgage-backed securities, and other financial assets. TWO is headquartered in St. Louis Park, MN.
FORWARD-LOOKING STATEMENTS
This press release may contain “forward-looking statements,” including certain plans, expectations, goals, projections and statements about the merger (the “CCM Merger”) with CrossCountry Intermediate Holdco, LLC (“CCM”), Two Harbors Investment Corp.’s (“TWO”) and CCM’s plans, objectives, expectations and intentions, the expected timing of completion of the proposed CCM Merger, the ability of the parties to complete the proposed CCM Merger considering the various closing conditions; and other statements that are not historical facts. Such statements are subject to numerous assumptions, risks, and uncertainties. Statements that do not describe historical or current facts, including statements about beliefs and expectations, are forward-looking statements. The forward-looking statements are intended to be subject to the safe harbor provided by Section 27A of the Securities Act of 1933, as amended, and Section 21E of the Securities Exchange Act of 1934, as amended, and the Private Securities Litigation Reform Act of 1995. All statements, other than statements of historical fact, included in this press release that address activities, events or developments that TWO or CCM expects, believes or anticipates will or may occur in the future are forward-looking statements. Words such as “project,” “predict,” “believe,” “expect,” “anticipate,” “potential,” “create,” “estimate,” “plan,” “continue,” “intend,” “could,” “foresee,” “should,” “would,” “may,” “will,” “guidance,” “look,” “outlook,” “goal,” “future,” “assume,” “forecast,” “build,” “focus,” “work,” or the negative of such terms or other variations thereof and words and terms of similar substance used in connection with any discussion of future plans, actions, or events identify forward-looking statements. However, the absence of these words does not mean that the statements are not forward-looking. Projected and estimated numbers are used for illustrative purposes only, are not forecasts and may not reflect actual results. These statements are not guarantees of future performance and involve certain risks, uncertainties and assumptions that are difficult to predict. TWO’s ability to predict results or the actual effect of future events, actions, plans or strategies is inherently uncertain. Although TWO believes the expectations reflected in any forward-looking statements are based on reasonable assumptions, it can give no assurance that their expectations will be attained and therefore, actual outcomes and results may differ materially from what is expressed or forecasted in such forward-looking statements.
There are a number of risks and uncertainties that could cause actual results to differ materially from the forward-looking statements included in this press release. These include, among other things: the expected timing and likelihood of completion of the proposed CCM Merger; the occurrence of any event, change or other circumstances that could give rise to the termination of the proposed CCM Merger; the potential failure to receive, on a timely basis or otherwise, the required approvals of the proposed CCM Merger, and the potential failure to satisfy the other conditions to the consummation of the proposed CCM Merger in a timely manner or at all; risks related to disruption of management’s attention from ongoing business operations due to the proposed CCM Merger; the risk that any announcements relating to the proposed CCM Merger could have adverse effects on the market price of TWO common stock; the risk that the proposed CCM Merger and its announcement could have an adverse effect on the ability of TWO to retain and hire key personnel and the effect on TWO’s operating results and business generally; the outcome of any legal proceedings relating to the proposed CCM Merger, including stockholder litigation in connection with the proposed CCM Merger; the risk that restrictions during the pendency of the proposed CCM Merger may impact TWO’s ability to pursue certain business opportunities or strategic transactions; that TWO may be adversely affected by other economic, business or competitive factors; changes in future loan production; the availability of suitable investment opportunities; changes in interest rates; changes in the yield curve; changes in prepayment rates; the availability and terms of financing; general economic conditions and market conditions; conditions in the market for mortgage-related investments; and legislative and regulatory changes that could adversely affect TWO’s business. All such factors are difficult to predict and are beyond the control of TWO and CCM, including those detailed in TWO’s annual reports on Form 10-K, quarterly reports on Form 10-Q and periodic reports on Form 8-K that are available on TWO’s website at www.twoinv.com/investors and on the Securities and Exchange Commission’s (the “SEC”) website at www.sec.gov.
Each of the forward-looking statements of TWO are based on assumptions that TWO believes to be reasonable but that may not prove to be accurate. Any forward-looking statement speaks only as of the date on which such statement is made, and TWO does not undertake any obligation to correct or update any forward-looking statement, whether as a result of new information, future events or otherwise, except as required by applicable law. Readers are cautioned not to place undue reliance on these forward-looking statements that speak only as of the date hereof.
Non-GAAP Financial Measures
In addition to disclosing financial results calculated in accordance with United States generally accepted accounting principles (GAAP), this press release presents non-GAAP financial measures, such as earnings available for distribution and related per basic common share measures. The non-GAAP financial measures presented by the company provide supplemental information to assist investors in analyzing the company’s results of operations and help facilitate comparisons to industry peers. However, because these measures are not calculated in accordance with GAAP, they should not be considered a substitute for, or superior to, the financial measures calculated in accordance with GAAP. The company’s GAAP financial results and the reconciliations from these results should be carefully evaluated. See the GAAP to non-GAAP reconciliation table on page 11 of this release.
Contact
TWO Investor Relations, investors@twoinv.com
# # #
| | | | | | | | | | | |
| TWO HARBORS INVESTMENT CORP. |
CONSOLIDATED BALANCE SHEETS |
| (dollars in thousands, except share data) |
| June 30,
2026 | | December 31,
2025 |
| (unaudited) | | |
| ASSETS | | | |
Available-for-sale securities, at fair value (amortized cost $5,137,549 and $6,516,016, respectively; allowance for credit losses $360 and $1,609, respectively) | $ | 5,091,319 | | | $ | 6,514,471 | |
| Mortgage servicing rights, at fair value | 2,336,324 | | | 2,421,910 | |
Mortgage loans held-for-sale, at fair value | 12,737 | | | 13,630 | |
| Cash and cash equivalents | 642,691 | | | 842,319 | |
| Restricted cash | 222,380 | | | 219,633 | |
| Accrued interest receivable | 23,141 | | | 29,229 | |
| Due from counterparties | 155,247 | | | 379,259 | |
| Derivative assets, at fair value | 69,366 | | | 87,549 | |
| Reverse repurchase agreements | 136,941 | | | 157,120 | |
| Other assets | 141,323 | | | 194,097 | |
| Total Assets | $ | 8,831,469 | | | $ | 10,859,217 | |
| LIABILITIES AND STOCKHOLDERS’ EQUITY | | | |
| Liabilities: | | | |
| Repurchase agreements | $ | 5,639,830 | | | $ | 7,255,540 | |
| Revolving credit facilities | 862,771 | | | 919,371 | |
| Warehouse lines of credit | 4,333 | | | 9,406 | |
| | | |
| Senior notes | 111,350 | | | 111,055 | |
| Convertible senior notes | — | | | 261,810 | |
| Derivative liabilities, at fair value | 1,891 | | | 4,254 | |
| Due to counterparties | 196,484 | | | 215,814 | |
| Dividends payable | 48,955 | | | 48,932 | |
| Accrued interest payable | 43,967 | | | 81,914 | |
| | | |
| Other liabilities | 177,003 | | | 163,194 | |
| Total Liabilities | 7,086,584 | | | 9,071,290 | |
| Stockholders’ Equity: | | | |
Preferred stock, par value $0.01 per share; 100,000,000 shares authorized and 24,870,817 shares issued and outstanding ($621,770 liquidation preference) | 601,467 | | | 601,467 | |
Common stock, par value $0.01 per share; 175,000,000 shares authorized and 105,133,008 and 104,806,311 shares issued and outstanding, respectively | 1,051 | | | 1,048 | |
| Additional paid-in capital | 5,954,412 | | | 5,948,478 | |
| Accumulated other comprehensive loss | (45,736) | | | (87) | |
| Cumulative earnings | 1,289,014 | | | 1,194,485 | |
| Cumulative distributions to stockholders | (6,055,323) | | | (5,957,464) | |
| Total Stockholders’ Equity | 1,744,885 | | | 1,787,927 | |
| Total Liabilities and Stockholders’ Equity | $ | 8,831,469 | | | $ | 10,859,217 | |
| | | | | | | | | | | | | | | | | | | | | | | |
| TWO HARBORS INVESTMENT CORP. |
CONSOLIDATED STATEMENTS OF COMPREHENSIVE INCOME (LOSS) |
(dollars in thousands, except per share amounts) |
| Certain prior period amounts have been reclassified to conform to the current period presentation |
| Three Months Ended | | Six Months Ended |
| June 30, | | June 30, |
| 2026 | | 2025 | | 2026 | | 2025 |
| (unaudited) | | (unaudited) |
Net interest expense: | | | | | |
| Interest income | $ | 83,536 | | | $ | 117,082 | | | $ | 172,186 | | | $ | 228,464 | |
| Interest expense | 89,557 | | | 136,701 | | | 184,718 | | | 268,415 | |
| Net interest expense | (6,021) | | | (19,619) | | | (12,532) | | | (39,951) | |
| Net servicing income: | | | | | | | |
| Servicing income | 129,070 | | | 158,354 | | | 259,213 | | | 315,213 | |
| Servicing costs | 3,211 | | | 2,386 | | | 5,059 | | | 5,583 | |
| Net servicing income | 125,859 | | | 155,968 | | | 254,154 | | | 309,630 | |
| Other income (loss): | | | | | | | |
| Loss on investment securities | (2,123) | | | (32,830) | | | (13,109) | | | (65,559) | |
| Loss on servicing asset | (47,239) | | | (35,902) | | | (91,248) | | | (72,123) | |
| Gain (loss) on derivative instruments | 46,678 | | | (84,207) | | | 62,319 | | | (181,547) | |
| Gain on mortgage loans held-for-sale | 704 | | | 883 | | | 2,756 | | | 1,552 | |
| Other income | 1,735 | | | 1,038 | | | 3,052 | | | 1,799 | |
| Total other loss | (245) | | | (151,018) | | | (36,230) | | | (315,878) | |
| Expenses: | | | | | | | |
| | | | | | | |
| Compensation and benefits | 23,309 | | | 21,469 | | | 50,007 | | | 48,058 | |
| Other operating expenses | 28,088 | | | 21,307 | | | 50,837 | | | 41,812 | |
| | | | | | | |
| Loss contingency accrual | — | | | 199,935 | | | — | | | 199,935 | |
| | | | | | | |
| | | | | | | |
| Total expenses | 51,397 | | | 242,711 | | | 100,844 | | | 289,805 | |
| Income (loss) before income taxes | 68,196 | | | (257,380) | | | 104,548 | | | (336,004) | |
| Provision for income taxes | 5,951 | | | 1,661 | | | 10,019 | | | 2,092 | |
| | | | | | | |
| | | | | | | |
| Net income (loss) | 62,245 | | | (259,041) | | | 94,529 | | | (338,096) | |
| | | | | | | |
| | | | | | | |
| Dividends on preferred stock | (12,866) | | | (13,239) | | | (25,673) | | | (26,425) | |
| | | | | | | |
| Net income (loss) attributable to common stockholders | $ | 49,379 | | | $ | (272,280) | | | $ | 68,856 | | | $ | (364,521) | |
| Basic earnings (loss) per weighted average common share | $ | 0.47 | | | $ | (2.62) | | | $ | 0.65 | | | $ | (3.51) | |
| Diluted earnings (loss) per weighted average common share | $ | 0.46 | | | $ | (2.62) | | | $ | 0.65 | | | $ | (3.51) | |
| | | | | | | |
| | | | | | | |
| | | | | | | |
| | | | | | | |
| Comprehensive income (loss): | | | | | | | |
| Net income (loss) | $ | 62,245 | | | $ | (259,041) | | | $ | 94,529 | | | $ | (338,096) | |
| Other comprehensive (loss) income: | | | | | | | |
| Unrealized (loss) gain on available-for-sale securities | (1,458) | | | 50,473 | | | (45,649) | | | 207,645 | |
| Other comprehensive (loss) income | (1,458) | | | 50,473 | | | (45,649) | | | 207,645 | |
| Comprehensive income (loss) | 60,787 | | | (208,568) | | | 48,880 | | | (130,451) | |
| | | | | | | |
| | | | | | | |
| Dividends on preferred stock | (12,866) | | | (13,239) | | | (25,673) | | | (26,425) | |
| | | | | | | |
Comprehensive income (loss) attributable to common stockholders | $ | 47,921 | | | $ | (221,807) | | | $ | 23,207 | | | $ | (156,876) | |
| | | | | | | |
| | | | | | | |
|
|
|
|
| | | |
| | | | | | | |
| | | |
| | | | | | | |
| | | | | | | |
| | | | | | | |
| | | | | | | |
| | | | | | | |
| | | | | | | |
| | | | | | | |
| | | | | | | |
| | | | | | | |
| | | | | | | |
| | | | | | | |
| | | | | | | | | | | | | | | | | | | | | | | |
| TWO HARBORS INVESTMENT CORP. |
| INTEREST INCOME AND INTEREST EXPENSE |
(in thousands) |
|
| Three Months Ended | | Six Months Ended |
| June 30, | | June 30, |
| 2026 | | 2025 | | 2026 | | 2025 |
| (unaudited) | | (unaudited) |
| Interest income: | | | | | |
| Available-for-sale securities | $ | 76,516 | | | $ | 108,842 | | | $ | 157,203 | | | $ | 209,260 | |
| | | | | | | |
| | | | | | | |
| Mortgage loans held-for-sale | 153 | | | 145 | | | 322 | | | 198 | |
| Other | 6,867 | | | 8,095 | | | 14,661 | | | 19,006 | |
| Total interest income | 83,536 | | | 117,082 | | | 172,186 | | | 228,464 | |
| Interest expense: | | | | | | | |
| Repurchase agreements | 69,556 | | | 110,288 | | | 144,083 | | | 217,366 | |
| | | | | | | |
| Revolving credit facilities | 16,339 | | | 20,343 | | | 32,689 | | | 40,469 | |
Warehouse lines of credit | 89 | | | 129 | | | 198 | | | 184 | |
| | | | | | | |
| Senior notes | 2,845 | | | 1,496 | | | 5,686 | | | 1,496 | |
| Convertible senior notes | — | | | 4,445 | | | 710 | | | 8,900 | |
Other | 728 | | | — | | | 1,352 | | | — | |
| Total interest expense | 89,557 | | | 136,701 | | | 184,718 | | | 268,415 | |
| Net interest expense | $ | (6,021) | | | $ | (19,619) | | | $ | (12,532) | | | $ | (39,951) | |
| | | | | | | | | | | |
TWO HARBORS INVESTMENT CORP. |
RECONCILIATION OF GAAP TO NON-GAAP FINANCIAL INFORMATION |
(dollars in thousands, except share data) |
Certain prior period amounts have been reclassified to conform to the current period presentation |
| | | |
| Three Months Ended |
| June 30,
2026 | | March 31,
2026 |
| (unaudited) | | (unaudited) |
| Reconciliation of comprehensive income (loss) to Earnings Available for Distribution: |
| |
|
| Comprehensive income (loss) attributable to common stockholders | $ | 47,921 | | | $ | (24,714) | |
| | | |
| Adjustment for other comprehensive loss attributable to common stockholders: |
| | |
| Unrealized loss on available-for-sale securities | 1,458 | | | 44,191 | |
| Net income attributable to common stockholders | $ | 49,379 | | | $ | 19,477 | |
| | | |
| Adjustments to exclude reported realized and unrealized (gains) losses: |
| | |
| Realized loss on securities | 2,153 | | | 10,885 | |
| Unrealized loss on securities | 1 | | | 86 | |
| (Reversal of) provision for credit losses | (31) | | | 15 | |
| Realized and unrealized loss on mortgage servicing rights | 47,239 | | | 44,009 | |
| Realized and unrealized gain on derivative instruments | (44,044) | | | (11,897) | |
| | | |
| Other gains | — | | | (4) | |
| Other adjustments: | | | |
MSR amortization(1) | (58,477) | | | (59,893) | |
TBA dollar roll income(2) | 13,066 | | | 15,874 | |
U.S. Treasury futures income(3) | 248 | | | 3,370 | |
Change in servicing reserves | (18) | | | 41 | |
Non-cash equity compensation expense | 1,436 | | | 4,422 | |
Merger-related costs(4) | 13,647 | | | 5,634 | |
| | | |
| | | |
| | | |
| Net provision for income taxes on non-EAD | 5,001 | | | 3,737 | |
Earnings available for distribution to common stockholders(5) | $ | 29,600 | | | $ | 35,756 | |
| | | |
Weighted average basic common shares | 104,937,007 | | | 104,876,645 | |
Earnings available for distribution to common stockholders per weighted average basic common share | $ | 0.28 | | | $ | 0.34 | |
_____________
(1)MSR amortization refers to the portion of change in fair value of MSR primarily attributed to the realization of expected cash flows (runoff) of the portfolio, which is deemed a non-GAAP measure due to the company’s decision to account for MSR at fair value.
(2)TBA dollar roll income is the economic equivalent to holding and financing Agency RMBS using short-term repurchase agreements.
(3)U.S. Treasury futures income is the economic equivalent to holding and financing a relevant cheapest-to-deliver U.S. Treasury note or bond using short-term repurchase agreements.
(4)Merger-related costs consist of expenses incurred in connection with the company’s pending merger with CCM, as well as its terminated merger with UWM.
(5)EAD is a non-GAAP measure that we define as comprehensive income (loss) attributable to common stockholders, excluding realized and unrealized gains and losses on the aggregate investment portfolio, gains and losses on repurchases of preferred stock, provision for (reversal of) credit losses, reserve expense for representation and warranty obligations on MSR, non-cash compensation expense related to equity incentive plans and merger-related costs. As defined, EAD includes net interest income, accrual and settlement of interest on derivatives, dollar roll income on TBAs, U.S. Treasury futures income, servicing income, net of estimated amortization on MSR and certain cash related operating expenses. EAD provides supplemental information to assist investors in analyzing the company’s results of operations and helps facilitate comparisons to industry peers. EAD is one of several measures our board of directors considers to determine the amount of dividends to declare on our common stock and should not be considered an indication of our taxable income or as a proxy for the amount of dividends we may declare.