
UNITED STATES
SECURITIES AND EXCHANGE COMMISSION
Washington, D.C. 20549
FORM
(Mark one)
| ANNUAL REPORT PURSUANT TO SECTION 13 OR 15(d) OF THE SECURITIES EXCHANGE ACT OF 1934 |
For
the fiscal year ended
OR
| TRANSITION REPORT PURSUANT TO SECTION 13 OR 15(d) OF THE SECURITIES EXCHANGE ACT OF 1934 |
For the transition period from __________ to __________
Commission
file number:
(Exact name of registrant as specified in its charter)
(State or Other Jurisdiction of Incorporation or Organization) |
(I.R.S. Employer Identification Number) |
(Address of Principal Executive Offices, including Zip Code)
(Registrant’s Telephone Number, including Area Code)
Securities registered pursuant to Section 12(b) of the Act:
| Title of Each Class | Trading Symbol | Name of Each Exchange on Which Registered | ||
Securities registered pursuant to Section 12(g) of the Act: None
Indicate by check mark if the registrant is a well-known seasoned issuer, as defined in Rule 405 of the Securities Act.
Yes
☐
Indicate by check mark if the registrant is not required to file reports pursuant to Section 13 or Section 15(d) of the Act.
Yes
☐
Indicate by check mark whether the registrant (1) has filed all reports required to be filed by Section 13 or 15(d) of the Securities Exchange Act of 1934 during the preceding 12 months (or for such shorter period that the registrant was required to file such reports), and (2) has been subject to such filing requirements for the past 90 days.
Indicate by check mark whether the registrant has submitted electronically every Interactive Data File required to be submitted pursuant to Rule 405 of Regulation S-T (§232.405 of this chapter) during the preceding 12 months (or for such shorter period that the registrant was required to submit such files).
Indicate by check mark whether the registrant is a large accelerated filer, an accelerated filer, a non-accelerated filer, a smaller reporting company or an emerging growth company. See the definitions of “large accelerated filer,” “accelerated filer,” “smaller reporting company” and “emerging growth company” in Rule 12b-2 of the Exchange Act.
| Large accelerated filer | ☐ | Accelerated filer | ☐ | |
| ☒ | Smaller reporting company | |||
| Emerging growth company |
If an emerging growth company, indicate by check mark if the registrant has elected not to use the extended transition period for complying with any new or revised financial accounting standards provided pursuant to Section 13(a) of the Exchange Act. ☐
Indicate
by check mark whether the registrant has filed a report on and attestation to its management’s assessment of the effectiveness
of its internal control over financial reporting under Section 404(b) of the Sarbanes-Oxley Act (15 U.S.C. 7262(b)) by the registered
public accounting firm that prepared or issued its audit report.
If
securities are registered pursuant to Section 12(b) of the Act, indicate by check mark whether the financial statements of the registrant
included in the filing reflect the correction of an error to previously issued financial statements.
Indicate by check mark whether any of those error corrections are restatements that required a recovery analysis of incentive-based compensation received by any of the registrant’s executive officers during the relevant recovery period pursuant to § 240.10D-1(b). ☐
Indicate by check mark whether the registrant is a shell company (as defined in Rule 12b-2 of the Act).
Yes
☐ No
The
aggregate market value of common stock held by non-affiliates of the registrant as of June 30, 2025 was approximately $
The number of shares of the registrant’s common stock outstanding as of February 26, 2026 was .
DOCUMENTS INCORPORATED BY REFERENCE
MICROVISION, INC.
ANNUAL REPORT ON FORM 10-K
FOR THE YEAR ENDED DECEMBER 31, 2025
TABLE OF CONTENTS
| 2 |
PART I.
Preliminary Note Regarding Forward-Looking Statements
This Annual Report contains forward-looking statements, within the meaning of Section 27A of the Securities Act of 1933, as amended (the “Securities Act”), and Section 21E of the Securities Exchange Act of 1934, as amended (the “Exchange Act”), and is subject to the safe harbor created by those sections. Such statements may include, but are not limited to, projections of revenues and expenses, and measures of income or loss, status of product development and performance, market opportunity and future demand, partner and customer engagement, cooperative agreements, strategic plans, future operations, financing needs or plans of MicroVision, Inc. (“we,” “our,” or “us”), as well as assumptions relating to the foregoing. The words “anticipate,” “could,” “believe,” “estimate,” “expect,” “goal,” “may,” “plan,” “will,” and similar expressions identify forward-looking statements. Factors that could cause actual results to differ materially from those projected in our forward-looking statements include risk factors identified below in Item 1A.
ITEM 1. BUSINESS
Overview
MicroVision, Inc. is defining the next generation of lidar-based perception solutions for automotive, industrial, and security & defense markets. We deliver integrated hardware and software solutions designed for real-world performance, automotive-grade reliability, and economic scalability. Our diverse portfolio of lidar sensors, with both short- and long-range lidar solutions, feature solid-state sensors with varying wavelengths, advanced sensor architectures, design-to-cost engineering, and open software solutions.
Our solutions enable advanced driver assistance systems, or ADAS, and autonomy features for customers in a wide range of markets, including automotive, industrial, and security & defense. Target industrial sectors include robotics, automated warehouse, agriculture, and mining. Our integrated hardware and software solutions enable intelligent autonomous, active safety, and automation systems which depend on secure, cost-effective, and energy-efficient solutions. Our software has been developed in close collaboration with automotive customers and also has broad application in industrial, defense, and commercial vehicle sectors.
With engineering teams in the U.S. and Germany, we develop and supply integrated solutions, incorporating application software and processing data from differentiated sensor systems. Our extensive experience in developing and productizing core lidar hardware and software components, along with our expertise in edge computing, positions us as a valuable commercial partner capable of delivering high-value, low-power products.
Founded in 1993, MicroVision, Inc. is a pioneer in laser beam scanning, or LBS technology, which is based on our patented technology in micro-electromechanical systems, or MEMS, laser diodes, opto-mechanics, electronics, algorithms and software and how those elements are packaged into a small form factor. Throughout our history, we have combined our proprietary technology with our development expertise to create innovative solutions to address existing and emerging market needs, such as augmented reality microdisplay engines; interactive display modules; consumer lidar components; and, more recently, lidar sensors and software solutions for automotive, industrial, and security & defense markets.
In January 2023, we acquired certain strategic assets of Germany-based Ibeo Automotive Systems GmbH, which was founded in 1998 as a lidar hardware and software provider. Ibeo developed and launched the first lidar sensor to be automotive qualified for serial production with a premium, or Tier 1, automotive supplier and that is currently available in passenger cars by premium original equipment manufacturers, or OEMs. Ibeo developed software solutions, including perception and validation software, also used by premium OEMs. In addition, Ibeo sold its products for non-automotive uses such as industrial, agriculture, smart infrastructure, and robotics applications.
In January 2026, we completed the acquisition of assets from Scantinel Photonics GmbH, based in Germany. Scantinel develops a unique lidar-on-chip solution, utilizing 1550nm frequency-modulated continuous wave, or FMCW, technology. Our 1550nm FMCW lidar solution has applications for long-range use cases across our target markets, with particularly compelling advantages for the commercial vehicle market.
| 3 |
In February 2026, we completed the strategic acquisition of assets primarily comprising the worldwide lidar business of Luminar Technologies, Inc. The acquired assets include the IRIS sensor, a 1550nm time-of-flight long-range lidar, and its next generation HALO sensor, built off the same architecture as IRIS but with improved performance and reduced size and cost. The automotive-grade IRIS sensor achieved start of production in April 2024, with subsequent deliveries used in vehicles for road data collection and system training. The acquisition also included SENTINEL, under development as a full-stack software platform supporting safety and autonomy applications for passenger vehicles and commercial trucks.
Our hardware solutions include a broad and multi-featured portfolio of lidar sensors, which can be integrated with our software or with our customers’ software, targeted for sale to automotive OEMs and Tier 1 suppliers, industrial mobility and autonomy companies, and security & defense contractors. Our lidar sensors, all solid state, include MOVIA™, a flash-based short- to mid-range sensor; MAVIN™, a MEMS-based 905nm long-range sensor capable of small object detection; IRIS and HALO, each a 1550nm long-range sensor; and our Scantinel 1550nm long-range FMCW lidar. Our software stack has met the rigorous requirements of automotive qualification and incorporates advanced features, like localization and fusion. We also develop customer-specific application software, allowing expansion into a wide array of sectors.
In 2025, we recorded an impairment charge of $10.1 million in connection with perception software acquired from Ibeo, a $9.9 million write-down of select MOVIA L sensor inventory, as well as a $2.2 million impairment charge associated with certain production machinery and tooling equipment related to our MAVIN sensor. Additionally, in 2025, we recorded an adverse purchase commitment of $3.2 million related to the production of select MOVIA L sensor inventory. See Part II, Item 8, Note 9. Financial Statement Components for additional discussion. (Note that the application of accounting rules related to asset impairment involve assessment of recorded book value but do not necessarily impact resale value.)
In 2024, we reduced the dedicated resources and investment into further development of our MOSAIK™ suite a tool for validating vehicle sensors for ADAS and autonomous driving, or AD, applications. Specifically, in 2024, in an effort to better align our resources with our product plan, we restructured and reorganized our workforce and related expenditures to strategically focus on our perception software and MAVIN and MOVIA products. While this 41% reduction in workforce added approximately $6.0 million to our fiscal year 2024 expenses, this action extended our financial runway through reduced personnel expenses and other operational efficiencies. See Part II, Item 8, Note 14. Restructuring Charges for additional discussion.
In the recent past, we developed micro-display concepts and designs for use in head-mounted augmented reality, or AR, headsets and developed a 1440i MEMS module supporting AR headsets. This technology was integrated into products marketed to consumer and military sectors.
We have incurred significant losses since inception and we expect to continue to incur significant losses in the near term. We have funded our operations to date primarily through the sale of common stock, convertible preferred stock, warrants, the issuance of convertible debt and, to a lesser extent, from development contract revenues, product sales and licensing activities. In October 2024, we entered into a securities purchase agreement with an institutional investor for the sale of up to $75.0 million in senior secured convertible notes. See Part II, Item 8, Note 7. Notes Payable and Derivative Liability. In February 2025, we entered into another securities purchase agreement with the same institutional investor for the issuance and sale of $8.0 million in shares of common stock, plus warrants to purchase additional shares of common stock for approximately $9.0 million. See Part II, Item 8, Note 8. Warrant Liability. In February 2026, we entered into a securities purchase and exchange agreement with the same investor, pursuant to which we issued two senior secured convertible notes due March 2028 – one for approximately $20.6 million in exchange for the previously existing senior secured convertible note due March 2026 and the other for approximately $22.4 million. See Part II, Item 8, Note 17. Subsequent Events for additional discussion.
MicroVision, Inc. was founded in 1993 as a Washington corporation and reincorporated in 2003 under the laws of the State of Delaware. Our headquarters is located at 18390 NE 68th Street, Redmond, Washington 98052, and our telephone number is (425) 936-6847.
| 4 |
Our annual reports on Form 10-K, quarterly reports on Form 10-Q, current reports on Form 8-K, and all amendments to those reports are available free-of-charge from the investor page of our website, accessible at www.microvision.com, as soon as reasonably practicable after such material is electronically filed with the Securities and Exchange Commission, or SEC. Copies of these filings may also be obtained by visiting the SEC’s website, www.sec.gov, which contains current, quarterly and annual reports, proxy and information statements and other information regarding issuers that file electronically.
Our Industry and Market Strategy
Our perception solutions address autonomy and mobility opportunities and challenges in a variety of markets, with our primary focus being automotive ADAS and AD; industrial markets, including robotics, warehouse automation, agriculture, and mining; and security & defense applications.
Our lidar sensors and software were initially developed to address the needs of the Level 2+, or L2+, and Level 3, or L3, ADAS markets to be used in automotive safety and autonomous driving applications. Our solution-based development approach recognizes two key realities of the L2+ and L3 markets: that safety is mission critical and that automotive OEMs require cost efficiency and integration adaptability. With these factors in mind, we believe that our wide array of technologically diverse lidar sensors and software support critical safety needs by providing ADAS features, such as automatic emergency braking, forward collision warning, and automatic emergency steering, and other performance attributes that passenger vehicle and commercial trucking OEMs require at an acceptable price point.
In the industrial sector, we believe that our core technology is integral in the automated guided vehicle, or AGV, and autonomous mobile robot, or AMR, markets. We target our solutions for sale to OEMs in the AGV and AMR markets, as well as to companies in sectors that use their products. The advancement of warehouse and stockyard automation, integrated autonomous supply chains, and enhanced pickup and delivery systems requires cutting-edge innovation in the sensor systems guiding AMRs and traditional AGVs. Smart farming and automated mining operations improve safety, efficiency, productivity, and sustainability by leveraging our lidar sensors and software solutions.
Moreover, we tailor our solutions to meet the needs of industrial and automotive OEMs, integrating our lidar and edge computing to support high-level capabilities, save development cost and time for OEMs with no training required for our sensor-fused output, reduce system cost by requiring fewer and cheaper sensors and reduced processing, and enable seamless integration with an OEM’s existing architecture. Our unique solution for the AGV/AMR and the L2+/L3 markets, we believe, has the potential to achieve our goal of enabling mission-critical safety systems while solving for OEMs’ cost and integration objectives.
With this customer-centric approach, our go-to-market strategy depends on building partnerships with OEMs, Tier-1 automotive suppliers, and industrial operators, and also with silicon companies to support our solution on their compute platforms. Our strategy includes working to establish direct marketing and co-development relationships and we may also derive revenue in the form of licensing revenue.
Beyond industrial and automotive, our strategy includes targeting our hardware-only and integrated solutions and core technologies for security & defense applications. Drawing on MicroVision’s history as a supplier of innovative technology to the military, such as its high-definition wearable display technologies, we believe our solutions and technologies provide compelling use cases in the expanding defense tech sector.
In 2025, we established our Aerial Systems team, with deep experience in aeronautical engineering, avionics, unmanned aerial systems, or UAS, development, and related software, to accelerate development of our lidar-based perception systems for drones, unmanned guided vehicles, or UGVs, and mobile autonomous vehicles. Our solid-state lidar imaging and advanced software offers a drone-agnostic solution for a broad range of intelligence, surveillance, and reconnaissance, or ISR, mapping, and other security & defense applications.
Our Technology and Competitive Strength
We believe a significant competitive strength for us today is the technological depth and breadth of our lidar sensors, as well as our related software. The key differentiator for our offerings lies in our capability to provide an integrated and validated hardware and software solution for automotive and industrial customers. Core to our lidar sensors, software, and custom ASICs is proprietary technology that we have been developing, refining, productizing and protecting for nearly 30 years.
| 5 |
Our flash-based, solid-state lidar technology, which comprises our MOVIA family of sensors, was developed according to highly rigorous automotive-grade standards, delivering reliability in a small form factor suitable for a variety of applications in automotive, industrial, and other rugged environments. The robust and versatile MOVIA L sensor has no moving parts and sustains a 50G shock load, while it outputs a high-resolution, 4D point cloud. The smaller MOVIA S is intended to address short-range automotive applications, while also meeting unique needs in industrial and security & defense applications. Integrated with our software, MOVIA sensors have low power consumption requirements and perform well in adverse weather conditions.
Our newly acquired IRIS lidar and variants combine a 1550nm laser, transmitter, and receiver and provide long-range sensing that we expect will meet OEM specifications for advanced safety and autonomy. This technology provides automotive-grade, efficient, and affordable solutions that are scalable, reliable, and optimal for series production. These sensors are dynamically configurable dual-axis scan sensors that detect objects up to 600 meters away over a horizontal field of view of 120° and a software configurable vertical field of view of up to 30°. This provides high point densities in excess of 200 points per square degree that enables long-range detection, tracking, and classification over the whole field of view. IRIS and its variants have been refined to meet the size, weight, cost, power, and reliability requirements of automotive qualified series production sensors.
The IRIS next-generation sensor, called HALO, is being designed for mass adoption in the automotive market. Building off the same 1550nm laser architecture of IRIS, the HALO sensor will incorporate next-generation chip technologies expected to enable a 4x improvement in performance, a 3x reduction in size, a 2x improvement in thermal efficiency, and more than a 2x improvement in cost. HALO is being designed to provide backwards system compatibility to existing customers of IRIS, with a reduced form factor and greater energy efficiency.
Our micro-electromechanical systems, or MEMS-based high-speed lidar sensor, which we call MAVIN, use our pioneering laser beam scanning (LBS) technology. Our patented LBS technology combines a MEMS scanning mirror, laser diode light sources, electronics, and optics that are controlled using our proprietary system control algorithms along with edge computing and machine learning in some systems. The MEMS scanning mirror is a key component of our technology system and is one of our core competencies. Our MEMS scanning mirror is a silicon device that oscillates in a precisely controlled closed loop pattern so that we can place a pixel of light at a precise point. This allows us to generate a projected image pixel-by-pixel for use in lidar sensing and display. Scanning modules with our technology can be designed to operate in one of three different modes: lidar sensing only, display and lidar sensing combined, and display only. Our proprietary scan locking feature ensures that our sensors are immune from interference from sunlight and from other lidar sensors. Although developed for automotive applications, MAVIN is suitable for industrial and security & defense applications that require long-range solutions.
Early applications of our proprietary MEMS and laser-scanning technologies included heads up displays for the U.S. military and automotive systems. The contemplated uses of our technology require incorporation of our components into the products of other companies or partners. More recently, our technology can be found in a Microsoft heads up display product. In the past, we have worked with other global brands to incorporate our core technology into their consumer products.
MicroVision’s perception software efficiently enables small object detection, lane detection, road boundaries, and dynamic object tracking and classification. Object recognition is at the core of our perception solution, classifying objects and road users as well as small obstacles and overhanging loads, which is achieved using sophisticated algorithms to interpret complex visual information from one or multiple sensors. Our perception solution delivers highly accurate environment representation, thus enabling industrial and automotive customers to achieve reliable and efficient autonomous and mobility applications.
The integration of our perception software into our lidar sensors reduces power consumption and space needs by utilizing a highly efficient system-on-chip, or SoC, and optimizing our perception software for processing sensor measurements directly on the sensors. As external ECU hardware is expensive, our integrated solution lowers costs and the system architecture is simplified as the sensor-specific perception processing occurs seamlessly within the sensor.
| 6 |
Our Products and Revenue Strategy
Our product suite includes our diverse and multi-featured lidar sensor hardware, as well as integrated software. Our highly diverse array of lidar sensors includes short-, mid-, and long-range sensors, time-of-flight and FMCW, varying wavelengths including 905nm, 940nm, and 1550nm, and flash-based and MEMS-based. Our high-performance, solid-state sensors address mission-critical safety and security applications in automotive, industrial, and security & defense sectors Our sensor hardware solutions are well augmented by our software. We also provide engineering services in connection with these hardware and software products, as well as development of custom application software.
Our perception solutions are targeted for sale to a wide variety of markets, including automotive, industrial, and security & defense. Our software was developed in collaboration with an automotive OEM customer and successfully passed through that OEM’s development qualification processes. Our IRIS, HALO, and MOVIA sensors are also based on technology developed according to automotive-grade standards. The immediate availability of our MOVIA and IRIS sensors support a revenue strategy that includes royalty revenues from automotive production, as well as sales in multiple markets including industrial, smart infrastructure, robotics, and commercial vehicles. Our HALO, FMCW, and MAVIN lidar systems are targeted for sale to automotive OEMs and Tier 1 automotive suppliers, though also suitable for industrial and security & defense applications that require a robust solution with long-range detection.
Our solutions in the automotive industry target ADAS and AD needs of automotive OEMs and Tier 1 automotive suppliers with revenue derived from high-volume supply agreements, as well as non-recurring development revenue.
In the industrial sector, we are focused on opportunities involving AGVs and AMRs, cobots, and mobile autonomous vehicles, or MAVs, where our key differentiating features include various combinations of low power consumption, an integrated solution, embedded localization software, and small object detection. Revenue would be derived from volume supply and licensing arrangements with automated warehouse operators, materials handling OEMs, and robotics manufacturers, among others in the industrial sector.
Research and Development
We believe our research and development efforts have earned us a leadership position in the field of lidar sensors and applications as applied to automotive, industrial, security & defense markets. Our ability to attract customers and grow revenue will depend on our ability to maintain our technology leadership, to continually improve performance, reduce costs, and ensure functional safety and flexible design. Our research and development teams as of December 31, 2025 were located in the U.S. and Germany and were comprised of approximately 135 engineering and technical staff in optics, software engineering, electrical engineering, product engineering, aeronautical engineering, avionics, and photonics.
Sales and Marketing
Our sales and marketing approach is account based, business-to-business targeting of automotive OEMs, industrial automation equipment, and security & defense contractors, automated warehouse operators, agriculture and mining companies, automotive Tier 1 suppliers, defense tech companies, and potential customers in several other industrial markets. Our business development efforts are headed by executive management and business development representatives and are supported by engineers that assist customers during the design cycles of products. We have business development offices for our automotive, industrial, and security & defense solutions located in the United States, Europe, and Asia. We engage potential customers directly, participate in trade shows, and maintain a website. In 2025, we established a Defense Advisory Board, whose members have extensive networks and deep expertise in the security and defense sector, to support our pursuit of commercial opportunities and strategic partnerships in that market.
| 7 |
Manufacturing
We continue to invest in our manufacturing capabilities, evaluating long-term Tier 1 relationships and establishing new relationships with contract manufacturers. When we have produced products or components, our products were manufactured by a contract manufacturer based on our proprietary design, process, test, quality, and reliability standards and incorporated our core technologies, including MEMS and ASICs that were produced to order by semiconductor foundries. To date, our manufacturing has not been subject to seasonal variations as our shipments have been relatively small and in the early stages of product introduction. In the future, depending on our customers’ product mix, we may be affected by seasonal fluctuations which could affect working capital demands. Many of the raw materials used in our components are standard, although our MEMS, MEMS die, and ASICs have historically been manufactured to our specifications by separate single-source suppliers.
Competitive Conditions
Many companies have developed and are attempting to develop lidar sensors and autonomy and mobility solutions; the competitive landscape is highly crowded and rapidly evolving. We compete with pureplay lidar developers, most of which have raised and exhausted significant capital in their development and production efforts. Some of these companies have announced partnerships with OEMs, Tier 1 suppliers, and contract manufacturers that, even if nonexclusive, may appear more credible than we do in the marketplace. We also face competition from industrial and automotive OEMs and automotive Tier 1 suppliers that have internally developed lidar sensors. All of these OEMs and Tier 1s are significantly larger, more well-resourced, have long operating histories and enjoy relevant brand recognition. Many lidar developers are also building ADAS solutions with which our solutions compete. Our competitors may succeed in developing innovative technologies and products that could render our technology or products commercially infeasible or technologically obsolete.
The autonomy, mobility, and lidar sensing industries have been characterized by rapid and significant technological advances. Our perception solutions, technology systems, and sensor products may not be competitive with such advances, and we may not have sufficient funds to invest in new technologies, products or processes. Although we believe our technology and solutions could deliver higher performance and have other advantages, manufacturers of competing technologies may develop improvements that could reduce or eliminate the anticipated advantages of our solutions.
Intellectual Property and Proprietary Rights
We create intellectual property from three sources: internal research and development activities, technology acquisitions, and performance on development contracts. The inventions covered by our patent applications generally relate to systems controls in our LBS technology, component miniaturization, power reduction, feature enhancements, specific implementation of various system components, and design elements to facilitate mass production. Protecting these key-enabling technologies and components is a fundamental aspect of our strategy to penetrate diverse markets with unique products. As such, we intend to continue to develop our portfolio of proprietary and patented technologies at the system, component, and process levels.
Our extensive patent portfolio is large and broad, and we currently have over 700 issued patents and pending patents worldwide. As our technology develops, we not only apply for new patents, but we also periodically review our patent portfolio and eliminate patents that are deemed of low value. Moreover, the number of patents in our portfolio will vary at any given time as patents may expire or be abandoned to better utilize resources expended to maintain and generate new intellectual property.
Our ability to compete effectively in the markets we may enter may depend, in part, on our ability and the ability of our licensors to maintain the proprietary nature of the relevant technologies.
We also rely on unpatented proprietary technology. To protect our rights in these areas, we require all employees, and where appropriate, contractors, consultants, advisors and collaborators, to enter into confidentiality and non-compete agreements. There can be no assurance, however, that these agreements will provide meaningful protection for our trade secrets, know-how or other proprietary information in the event of any unauthorized use, misappropriation or disclosure of such trade secrets, know-how or other proprietary information.
| 8 |
We have registered names and phrases, including “MAVIN™,” “MOVIA™,” “MOSAIK™, “SAFE MOBILITY AT THE SPEED OF LIFE,” and “MicroVision®,” with the United States Patent and Trademark Office and in various foreign countries.
Our Employees, People Operations, and Workplace Safety
At the end of fiscal year 2025, throughout our global offices, we had approximately 190 predominantly full-time employees. We do not hire seasonal workers and none of our employees are represented by a labor union or works council.
Our principal objectives with respect to our workforce are to attract, retain, motivate, and reward our employees to achieve positive results for our customers and for MicroVision. To achieve these objectives, our employee benefit programs seek to (i) support skill building and prepare our employees for advancement through continuous learning, (ii) reward our employees through compensation awards and resources intended to motivate our employees and promote well-being, and (iii) continuously identify opportunities for development through regular employee input and engagement. We offer competitive compensation and benefits.
We also strive for excellence and inclusivity among our employees, management, and board of directors, and seek to promote job opportunities to a wide pool of qualified candidates who can bring multiple perspectives and a variety of backgrounds and experiences into our workplace. We are also committed to providing an inclusive work environment free of discrimination or harassment of any kind, supported by our leadership team and through our policies, communications, and reporting and resolution resources.
Protecting the safety, health, and well-being of our employees is also a key priority and we have implemented policies and practices to support this. In particular, given the work that we do, we engage third party independent experts in the field of laser safety to assist in meeting safety specifications. In addition, we monitor developments in the area of permissible laser exposure limits as established by International Electrotechnical Commission, or IEC, and others. Independent experts have concluded that laser exposure to the eye resulting from use of LBS devices under normal operating conditions would be below the calculated maximum permissible exposure level set by the IEC.
ITEM 1A. RISK FACTORS
You should carefully consider the risks described below together with the other information set forth in this report, which could materially affect our business, financial condition and future results. The risks described below are not the only risks facing our company. Risks and uncertainties not currently known to us or that we currently deem to be immaterial also may materially adversely affect our business, financial condition and operating results.
Risk Factors Related to Our Business
We have a history of operating losses and expect to incur significant losses in the future.
We have had substantial losses since our inception. We cannot assure you that we will ever become or remain profitable.
| ● | As of December 31, 2025, we had an accumulated deficit of $957.3 million. | |
| ● | We incurred net losses of $862.3 million from inception through 2024, and a net loss of $95.0 million during the year ended December 31, 2025. |
The likelihood of our success must be considered in light of the expenses, difficulties and delays frequently encountered by companies formed to develop and commercialize new technologies. In particular, our operations to date have focused primarily on research and development, initially of our Laser Beam Scanning, or LBS, technology system, including products built around that technology, and more recently of other core technologies around which our automotive lidar sensors are built. We are unable to accurately estimate future revenues and operating expenses based upon historical performance.
| 9 |
We cannot be certain that we will succeed in obtaining additional development revenue or commercializing our technology or products at scale. In light of these factors, we expect to continue to incur significant losses and negative cash flow through 2026 and the foreseeable future. There is significant risk that we will not achieve positive cash flow at any time in the future.
We will require additional capital to fund our operations at the level necessary to implement our business plan. Raising additional capital will dilute the value of current shareholders’ investment in us. Additionally, we may be unable to raise capital at the level we expect or on terms acceptable to us.
Based on our current operating plan, we anticipate that we have sufficient cash and cash equivalents to fund our operations for at least the next 12 months. We will, however, require additional capital to fund our operating plan past that time. We will seek to obtain additional capital through the issuance of equity or debt securities, development revenue, product sales, and/or licensing activities. There can be no assurance that any such efforts to obtain additional capital would be successful.
We are currently focused on developing and commercializing our lidar sensors and perception solutions. This involves introducing new technologies into an emerging market which creates significant uncertainty about our ability to accurately project the amounts and timing of revenue, costs, and cash flows. Our capital requirements will depend on many factors, including, but not limited to, the commercial success of our technologies, the rate at which OEMs and other customers introduce systems incorporating our solutions and technologies and the market acceptance and competitive position of such systems. Our expenses have increased significantly as a result of recent asset acquisitions, including Ibeo in January 2023, Scantinel Photonics in January 2026, and Luminar Technologies in February 2026, and related headcount increases with each acquisition. If revenues continue to be less than we anticipate, if the mix of revenues and the associated margins vary from anticipated amounts, or if expenses exceed the amounts budgeted, we may require additional capital earlier than expected to fund our operations. In addition, our operating plan provides for the development of strategic relationships with suppliers of components, products and systems, and equipment manufacturers that may require additional investment by us.
Additional capital may not be available to us or, if available, may not be available at a level or on terms acceptable to us or on a timely basis. Raising additional capital may involve issuing securities with rights and preferences that are senior to our common stock and may dilute the value of our current shareholders’ investment in us. Moreover, raising capital through the sale of our equity securities is dependent upon the availability of the requisite shares of authorized stock, which is driven by the market price of our stock and the approval of our stockholders. If adequate capital resources are not available on a timely basis, we may consider limiting our operations substantially and we may be unable to continue as a going concern. This limitation of operations could include reducing investments in our research and development projects, staff, operating costs, and capital expenditures which could jeopardize our ability to achieve our business goals or satisfy our customer requirements.
Risks Related to our Financial Statements and Results
Our revenue is generated from a small number of customers, and as we have experienced recently and in the past, losing a significant customer negatively impacts our revenue.
For the year ended December 31, 2025, a leading manufacturer of agricultural equipment accounted for $0.5 million in revenue, an automotive supplier accounted for $0.2 million in revenue, an automotive manufacturer accounted for $0.2 million in revenue, and an automotive driving solutions provider accounted for $0.1 million in revenue. This represents 42%, 19%, 15%, and 12% of our total revenue, respectively. For the year ended December 31, 2024, a leading manufacturer of agricultural equipment accounted for $2.8 million in revenue, a major global trucking OEM accounted for $0.6 million in revenue, and an automotive supplier accounted for $0.5 million in revenue. This represents 60%, 13%, and 10% of our total revenue, respectively. Our revenue has been negatively affected by the loss of certain of these customers and could continue to be if not replaced with new, materially equivalent customer wins.
| 10 |
We have, in the past, identified a material weakness in our internal controls.
We have in the past and may in the future identify material weaknesses in our internal controls, or fail to establish and maintain effective disclosure controls and procedures and internal control over financial reporting, either of which could result in material misstatements in our financial statements and a failure to meet our reporting obligations. Any such failure could cause investors to lose confidence in the accuracy of our financial reports, harm our reputation, and adversely affect the market price of our common stock.
Our internal controls over financial reporting beginning in fiscal year 2024 include controls of our subsidiary, MicroVision GmbH, which became a significant subsidiary upon the closing of our acquisition of assets from Ibeo in 2023. Given the added complexity stemming from the inclusion of our German subsidiary within our control environment, the risk of a material weakness in internal controls will be higher than it has been to date.
Our stock price has fluctuated in the past, has recently been volatile and may be volatile in the future, and as a result, investors in our common stock could incur substantial losses.
Our stock price has fluctuated significantly in the past, has recently been volatile, and may be volatile in the future. Over the 52-week period ending February 26, 2026, our common stock has traded at a low of $0.65 and a high of $1.73. We may continue to experience sustained depression or substantial volatility in our stock price in the foreseeable future unrelated to our operating performance or prospects. For the fiscal year ended December 31, 2025, we incurred a loss per share of $0.35.
As a result of this volatility, investors may experience losses on their investment in our common stock. The market price for our common stock may be influenced by many factors, including the following:
| ● | investor reaction to our business strategy; | |
| ● | the success of competitive products or technologies; | |
| ● | strategic developments; | |
| ● | the timing and results of our development and commercialization efforts with respect to our perception solutions and lidar sensors; | |
| ● | changes in regulatory or industry standards applicable to our solutions or technologies; | |
| ● | variations in our or our competitors’ financial and operating results; | |
| ● | developments concerning our collaborations or partners; | |
| ● | developments or disputes with any third parties that supply, manufacture, sell or market any of our products or component parts; | |
| ● | developments or disputes concerning patents or other proprietary rights, including patents, litigation matters and our ability to obtain patent protection for our technology; | |
| ● | actual or perceived defects in any of our products, if commercialized, and any related product liability claims; | |
| ● | our ability or inability to raise additional capital and the terms on which we raise it; | |
| ● | declines in the market prices of stocks generally; | |
| ● | trading volume of our common stock; | |
| ● | sales of our common stock by us or our stockholders; | |
| ● | general economic, industry and market conditions; and | |
| ● | the effects of other events or factors, including war, terrorism and other international conflicts, public health issues including health epidemics or pandemics, and natural disasters such as fire, hurricanes, earthquakes, tornados or other adverse weather and climate conditions, whether occurring in the United States or elsewhere. |
Since the price of our common stock has fluctuated in the past, has suffered recent declines and may be volatile in the future, investors in our common stock could incur substantial losses. In the past, following periods of volatility in the market, securities class-action litigation has often been instituted against companies. Such litigation, if instituted against us, could result in substantial costs and diversion of management’s attention and resources, which could materially and adversely affect our business, financial condition, results of operations and growth prospects. There can be no guarantee that our stock price will remain at current levels or that future sales of our common stock will not be at prices lower than those sold to investors.
| 11 |
Additionally, securities of certain companies have in the past few years experienced significant and extreme volatility in stock price due to short sellers of shares of common stock, known as a “short squeeze.” These short squeezes have caused extreme volatility in both the stock prices of those companies and in the market and have led to the price per share of those companies to trade at a significantly inflated rate that is disconnected from the underlying value of the company. Many investors who have purchased shares in those companies at an inflated rate face the risk of losing a significant portion of their original investment, as in many cases the price per share has declined steadily as interest in those stocks has abated. There can be no assurance that our shares will not be subject to a short squeeze in the future, and investors may lose a significant portion or all of their investment if they purchase our shares at a rate that is significantly disconnected from our underlying value.
If we are unable to maintain our listing on The Nasdaq Global Market, it could become more difficult to sell our stock in the public market.
Our common stock is listed on The Nasdaq Global Market. To maintain our listing on this market, we must meet Nasdaq’s listing maintenance standards. On January 12, 2026, we received a notification letter from Nasdaq advising that, based upon the closing bid price for the last 30 consecutive business days, the Company no longer met the continued listing requirement to maintain a minimum bid price of $1 per share, as set forth in Nasdaq Listing Rule 5450(a)(1).
As a result of recent declines and volatility in our stock price, there is a significant risk that we could fail to regain compliance with the minimum bid price requirement. If we are unable to regain compliance within the 180-day period and then continue to meet Nasdaq’s listing maintenance standards for any reason, such as our minimum bid price falling below $1 for 30 consecutive trading days, our common stock could be delisted from The Nasdaq Global Market. If our common stock were delisted, we may seek to list our common stock on The Nasdaq Capital Market, the NYSE American or on a regional stock exchange or, if one or more broker-dealer market makers comply with applicable requirements, the over-the-counter, or OTC, market. Listing on such other market or exchange could reduce the liquidity of our common stock. If our common stock were to trade in the OTC market, an investor would find it more difficult to dispose of, or to obtain accurate quotations for the price of, the common stock.
A delisting from The Nasdaq Global Market and failure to obtain listing on another market or exchange would subject our common stock to so-called penny stock rules that impose additional sales practice and market-making requirements on broker-dealers who sell or make a market in such securities. Consequently, removal from The Nasdaq Global Market and failure to obtain listing on another market or exchange could affect the ability or willingness of broker-dealers to sell or make a market in our common stock and the ability of purchasers of our common stock to sell their securities in the secondary market.
On February 26, 2026, the closing price of our common stock was $0.78 per share.
Our lack of significant financial resources may limit our revenues, potential profits, overall market share, or value.
Our products and solutions compete with other pureplay lidar developers, most of which have raised and exhausted significant capital in their development and production efforts. We also face competition from OEMs and Tier 1 suppliers that have internally developed lidar sensors. All of these OEMS and Tier 1s are significantly larger, more well-resourced, have long operating histories and enjoy relevant brand recognition. With greater resources over the past several years, our pureplay lidar competitors have in the past developed and commercialized products more quickly than us and may now have access to more entrenched sales channels. This historical imbalance in financial resources and access could result for us in reduced revenues, lower margins or loss of market share, any of which could reduce the value of our business. Additionally, for a variety of reasons, customers may choose to purchase from suppliers that have substantially greater financial or other resources than we have.
Risks Related to Fundraising Transactions and the Convertible Note
Our stockholders will experience further dilution if we issue additional equity securities in future fundraising transactions.
We are generally not restricted from issuing additional common stock, including any securities that are convertible into or exchangeable for, or that represent the right to receive, common stock. If we issue additional common stock, or securities convertible into or exchangeable or exercisable for common stock (such as the recent issuance by us pursuant to the securities purchase and exchange agreement dated February 23, 2026), our stockholders could experience additional dilution, and any such issuances may result in downward pressure on the price of our common stock.
| 12 |
Sales of shares of our common stock by the holder of the February 2026 convertible note may cause our stock price to decline.
Sales of substantial amounts of our shares of common stock in the public market by the holder of the convertible note issued by us in February 2026, or the perception that those sales may occur, could cause the market price of shares of our common stock to decline and impair our ability to raise capital through the sale of additional shares of our common stock.
We do not currently intend to pay dividends on our common stock, and any return to investors is expected to come, if at all, only from potential increases in the price of our common stock.
At the present time, we intend to use available funds to finance our operations. Accordingly, while any payment of dividends would be at the discretion of our board of directors, no cash dividends on our common shares have been declared or paid by us and we have no intention of paying any such dividends in the foreseeable future. Any return to investors is expected to come, if at all, only from potential increases in the price of our common stock.
There are risks associated with our outstanding convertible note that could adversely affect our business and financial condition.
On February 23, 2026, we issued two senior secured convertible notes in the aggregate principal amount of $43.0 million pursuant to the securities purchase and exchange agreement dated February 23, 2026. The convertible notes provide for certain events of default, such as our failing to make timely payments under the note and failing to timely comply with the reporting requirements of the Exchange Act. The February 2026 securities purchase and exchange agreement and the convertible notes also contain customary affirmative and negative covenants, including limitations on incurring additional indebtedness, the creation of additional liens on our assets, and entering into investments, as well as a minimum liquidity requirement.
Our ability to remain in compliance with the covenants under the convertible notes depends on, among other things, our operating performance, competitive developments, financial market conditions and stock exchange listing of our common stock, all of which are significantly affected by financial, business, economic and other factors. We are not able to control many of these factors. Accordingly, our cash flow may not be sufficient to allow us to pay principal on the notes or meet our other obligations thereunder. Our level of indebtedness under the securities purchase and exchange agreement could have other important consequences, including the following:
| ● | we may need to use a substantial portion of our cash flow from operations to pay principal on the convertible notes, which would reduce funds available to us for other purposes such as working capital, capital expenditures, potential acquisitions and other general corporate purposes; | |
| ● | we may be unable to refinance our indebtedness under the securities purchase and exchange agreement or to obtain additional financing for working capital, capital expenditures, acquisitions, or general corporate purposes; | |
| ● | we may be unable to comply with financial and other covenants related to the convertible notes, which could result in an event of default that, if not cured or waived, may result in acceleration of the notes and would have an adverse effect on our business and prospects, could cause us to lose the rights to our intellectual property, and could force us into bankruptcy or liquidation; | |
| ● | the conversion of the convertible notes could result in significant dilution of our common stock, which could result in significant dilution to our existing stockholders and cause the market price of our common stock to decline; and | |
| ● | we may be more vulnerable to an economic downturn or recession and adverse developments in our business. |
There can be no assurance that we will be able to manage any of these risks successfully.
| 13 |
Our obligations to the holder pursuant to the February 2026 convertible notes are secured by a security interest in all of our bank and securities accounts, now owned and hereafter created or acquired, and if we default on those obligations, the holder could foreclose on our bank and securities accounts.
Our obligations under the convertible notes and the related transaction documents, are secured by a security interest in all of our bank and securities accounts, now owned and hereafter created or acquired. As a result, if we default on our obligations under the convertible note the collateral agent on behalf of the holder could foreclose on the security interests and liquidate some or all of our bank and securities accounts, which would harm our business, financial condition and results of operations and could require us to reduce or cease operations and investors may lose all or part of your investment.
Risks Related to Our Operations
Difficulty in qualifying a contract manufacturer, Tier 1 partner, or foundry for our products, or experiencing challenges in our supply chain, could cause delays that may result in lost future revenues and damaged customer relationships.
Historically, we have relied on single or limited-source suppliers to manufacture our products. Establishing and maintaining a relationship with a contract manufacturer, automotive Tier 1 partner, or foundry is a time-consuming process, as our unique technologies may require significant manufacturing process adaptation to achieve full manufacturing capacity. To the extent that we are not able to maintain our existing or establish a new relationship with a contract manufacturer, Tier 1 partner, or foundry in a timely manner or at prices or on other terms that are acceptable to us, we may be unable to meet contract or production milestones. Moreover, changes or challenges in our supply chain could result in increased cost and delays and subject us to risks and uncertainties regarding, but not limited to, product warranty, product liability and quality control standards. The loss of any single or limited-source supplier, the failure of any of these suppliers to perform as expected or the disruption in the supply chain of components from these suppliers could cause significant delays in product deliveries, which could result in lost future revenues and damaged customer relationships.
Historically, we have been dependent on third parties to develop, manufacture, sell and market products incorporating our technology.
Our business strategy for commercializing our technology in products has historically included entering into development, manufacturing, licensing, sales and marketing arrangements with OEMs, ODMs and other third parties. These arrangements reduce our level of control over production and distribution and may subject us to risks and uncertainties regarding, but not limited to, product warranty, product liability and quality control standards.
We cannot be certain that we will be able to negotiate arrangements on acceptable terms, if at all, or that these arrangements will be successful in yielding commercially viable products. If we cannot establish or maintain these arrangements, we would require additional capital to undertake such activities on our own and would require extensive manufacturing, sales and marketing expertise that we do not currently possess and that may be difficult to obtain.
The production of our sensors is dependent on producing or sourcing certain key components and raw materials at acceptable price levels. If we are unable to adequately reduce and control the costs of such key components, we will be unable to realize manufacturing cost targets, which could reduce the market adoption of our products, damage our reputation with current or prospective customers, and harm our brand, business, prospects, financial condition and operating results.
In addition, we could encounter significant delays in introducing our products and technology or find that the development, manufacture or sale of products incorporating our technology would not be feasible. To the extent that we enter into development, manufacturing, licensing, sales and marketing or other arrangements, our revenues will depend upon the performance of third parties. We cannot be certain that any such arrangements will be successful.
| 14 |
We could face lawsuits related to our use of our core technologies, which would be costly, and any adverse outcome could limit our ability to commercialize our technologies or products.
We are aware of several patents held by third parties that relate to certain aspects of light scanning displays, 3D sensing products, and other technologies that are core to our sensor hardware. These patents could be used as a basis to challenge the validity, limit the scope or limit our ability to obtain additional or broader patent rights of our patents. A successful challenge to the validity of our patents could limit our ability to commercialize our technology or products incorporating the relevant technologies and, consequently, materially reduce our ability to generate revenues. Moreover, we cannot be certain that patent holders or other third parties will not claim infringement by us with respect to current and future technology. Because U.S. patent applications are held and examined in secrecy, it is also possible that presently pending U.S. applications could eventually be issued with claims that could be infringed by our products or our technology.
The defense and prosecution of a patent suit would be costly and time-consuming, even if the outcome were ultimately favorable to us. An adverse outcome in the defense of a patent suit could subject us to significant costs, require others and us to cease selling products incorporating our technology, require us to cease licensing our technology or require disputed rights to be licensed from third parties. Such licenses, if available, would increase our operating expenses. Moreover, if claims of infringement are asserted against our future co-development partners or customers, those partners or customers may seek indemnification from us for any damages or expenses they incur.
If we fail to manage expansion effectively, our revenue and expenses could be adversely affected.
Our ability to successfully offer products and solutions incorporating our technologies and implement our business plan in a rapidly evolving market requires an effective planning and management process. In particular following our recent asset acquisitions, the growth in business and relationships with customers and other third parties has placed, and will continue to place, a significant strain on our management systems and resources. We will need to continue to improve our financial and managerial controls, reporting systems and procedures, and will need to continue to train and manage our workforce. We continue to strengthen our compliance programs, including our compliance programs related to product certifications (in particular, certifications applicable to the automotive market), export controls, privacy, cybersecurity, and anti-corruption. We may not be able to implement improvements in an efficient or timely manner and may discover deficiencies in existing controls, programs, systems and procedures, which could have an adverse effect on our business, reputation and financial results.
We target customers that are large companies with substantial negotiating power and potentially competitive internal solutions; if we are unable to sell our products to these customers, our prospects will be adversely affected.
Our potential customers, including industrial and automotive OEMs, are large, multinational companies with substantial negotiating power relative to us and, in some instances, may have internal solutions that are competitive to our products. These large, multinational companies also have significant resources, which may allow them to acquire or develop competitive technologies either independently or in partnership with others. Accordingly, even after investing significant resources to develop a product, we may not secure a series production award or, even after securing a series production award, may not be able to commercialize a product on profitable terms or scale. If our products are not selected by these large companies or if these companies develop or acquire competitive technology or negotiate terms that are disadvantageous to us, it will have an adverse effect on our business prospects.
Our technology and products may be subject to environmental, health and safety regulations that could increase our development and production costs.
Our technologies and products could become subject to environmental, health and safety regulations or amendments that could negatively impact our ability to commercialize our technologies and products. Compliance with any such current or new regulations would likely increase the cost to develop and commercialize products, and violations may result in fines, penalties or suspension of production. If we become subject to any environmental, health, or safety laws or regulations that require us to cease or significantly change our operations to comply, our business, financial condition and operating results could be adversely affected.
| 15 |
Our operating results may be adversely impacted by worldwide political and economic uncertainties and specific conditions in the markets we address.
At various times in our history, including currently and in the recent past, general worldwide economic conditions have experienced downturns due instability in global tariffs, to slower economic activity, concerns about inflation, increased energy costs, decreased consumer confidence, reduced corporate profits and capital spending, and adverse business conditions. Any continuation or worsening of global economic and financial conditions could materially adversely affect: (i) our ability to raise, or the cost of, needed capital, (ii) demand for our current and future products, and (iii) our ability to commercialize products. Additionally, the outbreak of wars or infectious diseases, as experienced currently and in the recent past, may cause an unexpected deterioration in economic conditions. We cannot predict the timing, strength, or duration of any economic slowdown or subsequent economic recovery, worldwide, regionally or in automotive, the industrial, or security & defense sectors.
Because a significant proportion of our company is outside of the U.S. and we utilize foreign suppliers and manufacturers, our operating results could be harmed by economic, political, regulatory and other factors in foreign countries.
During 2021, we established an office in Germany and on January 31, 2023, we completed our acquisition of certain assets of Ibeo, with the result that we now have more employees and operations in Germany than in the U.S. In addition, we currently use foreign suppliers and partners and plan to continue to do so to manufacture current and future components and products, where appropriate. These international operations are subject to inherent risks, which may adversely affect us, including, but not limited to:
| ● | Political and economic instability, international terrorism and the outbreak of war, such as recent aggressions and ongoing conflict in the Middle East and the Russian invasion and continuing war against Ukraine; | |
| ● | High levels of inflation, as has historically been the case in a number of countries in Asia; | |
| ● | Burdens and costs of compliance with a variety of foreign laws, regulations and sanctions; | |
| ● | Foreign taxes and duties; | |
| ● | Significant instability in tariff rates or other trade, tax or monetary policies; | |
| ● | Changes or volatility in currency exchange rates and interest rates; | |
| ● | Global or regional health crises and epidemics; and | |
| ● | Disruptions in global supply chains. |
We have recently made and may in the future make acquisitions. If we fail to successfully select, execute or integrate our acquisitions, then our business, results of operations and financial condition could be materially adversely affected.
In January 2023, January 2026, and February 2026, we completed acquisitions of certain assets from Ibeo Automotive Systems GmbH, Scantinel Photonics GmbH, and Luminar Technologies, Inc., respectively. For each of these acquisitions, we expended significant management time and effort, as well as capital, identifying, evaluating, negotiating, and executing these transactions. We have also invested, and continue to invest, time and capital working to integrate employees and operations from each of these acquisitions into our global organization. We cannot guarantee that these integration efforts will be successful, that the goals of the acquisitions will be realized, or that the increase to our operating expenses or cash requirements will be manageable.
In the future, we may again undertake acquisitions to add new products and technologies, acquire talent, gain new sales channels or enter into new markets or sales territories. In addition to possible stockholder approval, we may need approvals and licenses from relevant government authorities for the acquisitions and to comply with any applicable laws and regulations, which could result in increased delay and costs, and may disrupt our business strategy if we fail to do so. Furthermore, acquisitions and the subsequent integration of new assets, businesses, key personnel, customers, vendors and suppliers require significant attention from our management and could result in a diversion of resources from our existing business, which in turn could have an adverse effect on our operations. Acquired assets or businesses may not generate the financial results we expect. Acquisitions could result in the use of substantial amounts of cash, potentially dilutive issuances of equity securities, the occurrence of significant goodwill and other acquired-asset impairment charges, amortization expenses for other intangible assets, and exposure to potential unknown liabilities of the acquired business. Moreover, the costs of identifying and consummating acquisitions may be significant.
| 16 |
Before our acquisition of assets from Ibeo, we had no experience with acquisitions or the integration of acquired technology and personnel. Failure to successfully identify, complete, manage, and integrate acquisitions could materially and adversely affect our business, financial condition, and results of operations and could cause our stock price to decline.
Our suppliers’ or manufacturing partners’ facilities could be damaged or disrupted by a natural disaster or labor strike, either of which would materially affect our financial position, results of operations and cash flows.
A major catastrophe, such as an earthquake, monsoon, or flood; infectious disease outbreak, such as the COVID-19 virus; or other natural disasters, labor strikes, or work stoppages at our suppliers’ or manufacturers partners’ facilities or our customers, could result in a prolonged interruption of our business. A disruption resulting from any one of these events could cause significant delays in product shipments and the loss of sales and customers, which could have a material adverse effect on our financial condition, results of operations, and cash flows.
If we are unable to obtain effective intellectual property protection for our products, processes and technologies, we may be unable to compete with other companies.
Intellectual property protection for our products, processes and technologies is important and uncertain. If we do not obtain effective intellectual property protection for our products, processes and technologies, we may be subject to increased competition. Our commercial success will depend, in part, on our ability to maintain the proprietary nature of our key technologies by securing valid and enforceable patents and effectively maintaining unpatented technologies as trade secrets.
We protect our proprietary technologies by seeking to obtain United States and foreign patents in our name, or licenses to third party patents, related to proprietary technologies, inventions, and improvements that may be important to the development of our business. However, our patent position involves complex legal and factual questions. The standards that the United States Patent and Trademark Office and its foreign counterparts use to grant patents are not always applied predictably or uniformly and can change.
Additionally, the scope of patents is subject to interpretation by courts and their validity can be subject to challenges and defenses, including challenges and defenses based on the existence of prior art. Consequently, we cannot be certain as to the extent to which we will be able to obtain patents for our new products and technologies or the extent to which the patents that we already own protect our products and technologies. Reduction in scope of protection or invalidation of our licensed or owned patents, or our inability to obtain new patents, may enable other companies to develop products that compete directly with ours on the basis of the same or similar technologies.
We also rely on the law of trade secrets to protect unpatented know-how and technologies to maintain our competitive position. We try to protect this know-how and our technologies by limiting access to the trade secrets to those of our employees, contractors and partners, with a need-to-know such information and by entering into confidentiality agreements with parties that have access to it, such as our employees, consultants and business partners. Any of these parties could breach the agreements and disclose our trade secrets or confidential information, or our competitors might learn of the information in some other way. If any trade secret not protected by a patent were to be disclosed to or independently developed by a competitor, our competitive position could be negatively affected.
| 17 |
We could be subject to significant product liability claims that could be time consuming and costly, divert management attention and adversely affect our ability to obtain and maintain insurance coverage.
We could be subject to product liability claims if any of the product applications are alleged to be defective or cause harmful effects. For example, because some of the scanning modules incorporating our LBS technology could scan a low power beam of colored light into the user’s eye, the testing, manufacture, marketing and sale of these products involve an inherent risk that product liability claims will be asserted against us.
Additionally, any misuse of our technologies or products incorporating our technologies by end users or third parties that obtain access to our technologies could result in negative publicity and could harm our brand and reputation. Product liability claims or other claims related to our products or our technologies, regardless of their outcome, could require us to spend significant time and money in litigation, divert management time and attention, require us to pay significant damages, harm our reputation or hinder acceptance of our products. Any successful product liability claim may prevent us from obtaining adequate product liability insurance in the future on commercially desirable or reasonable terms. An inability to obtain sufficient insurance coverage at an acceptable cost or otherwise to protect against potential product liability claims could prevent or inhibit the commercialization of our products and technologies.
Our operations could be adversely impacted by information technology system failures, network disruptions, or cybersecurity incidents.
We rely on information technology systems to process, transmit, store, and protect electronic data between our employees, customers, manufacturing partners and suppliers. Our systems and the third parties we rely on for related services are vulnerable to actual or attempted cybersecurity incidents, such as attacks by hackers, acts of vandalism, malware, social engineering, denial or degradation of service attacks, computer viruses, software bugs or vulnerabilities, supply chain attacks, phishing attacks, ransomware attacks, misplaced or lost data, human errors, malicious insiders or other similar events. Such systems are also susceptible to other disruptions due to events beyond our control, including, but are not limited to, natural disasters, power loss, and telecommunications failures. Our system redundancy may be inadequate and our disaster recovery planning may be ineffective or insufficient to account for all eventualities.
As security incidents have become more prevalent across industries we will need to continually examine, modify and update our systems. These updates or improvements may require implementation costs. In addition, we may not be able to monitor and react to all developments in a timely manner. The measures we do adopt may prove ineffective.
Any failure, or perceived failure, by us to comply with current and future regulatory or customer-driven privacy, data protection, and information security requirements, or to prevent or mitigate cyber incidents, could harm our business and expose us to potential litigation, liability, remediation costs, investigation costs, loss of revenue, damage to our reputation and loss of customers. While we maintain insurance coverage to address certain aspects of cyber risks, such insurance coverage may be insufficient to cover all losses or all claims that may arise, should such an event occur.
We, and certain of our third-party vendors, collect and store personal information in connection with human resources operations and other aspects of our business. While we obtain assurances that any third parties we provide data to will protect this information and, where we believe appropriate, monitor the protections employed by these third parties, there is a risk the confidentiality of data held by us or by third parties may be compromised and expose us to liability for such breach.
Loss of any of our key personnel or inability to attract new personnel could have a negative effect on the operation of our business.
Our success depends on our executive officers and other key personnel and on our ability to attract and retain qualified new personnel. Achievement of our business objectives will require substantial additional expertise in the areas of sales and marketing, engineering, project management, operations, and manufacturing. Competition for qualified personnel in these fields is intense, and the inability to attract and retain additional highly skilled personnel, or the loss of key personnel, could hinder our ability to compete effectively in the automotive or technology markets and adversely affect our business strategy execution and results of operations.
We are exposed to risks related to the use of AI tools by us and others.
Although we are evaluating and, where we believe appropriate, incorporating the use of AI tools into our operations, such as the use of generative AI tools to assist in the development of code, our use of such tools may subject us to significant competitive, legal, regulatory and other risks, and there can be no assurance that our use of AI tools will enhance our business operations or result in a benefit to us. Our competitors may be more successful in their use of AI tools, including by developing superior products or improving their operations with the assistance of AI. Additionally, there could be adverse impacts from inaccurate or flawed algorithms. Our use of AI tools could also result in the loss of confidential information or intellectual property or an inability to claim or enforce intellectual property rights, as well as subject us to risks related to intellectual property infringement or misappropriation, data privacy, cybersecurity, and the unauthorized use of our data.
| 18 |
Risks Related to Development for our Target Markets
We invest significant time and resources seeking OEM selection of our products and solutions. If our products and solutions are not selected for inclusion in ADAS systems by automotive OEMs or automotive Tier 1 suppliers after incurring substantial expenditures in these efforts, our future business prospects, results of operations, and financial condition will be materially and adversely affected.
Automotive OEMs and Tier 1 suppliers design and develop ADAS technology over several years, undertaking extensive testing and qualification processes prior to selecting a product such as our lidar sensors and software for use in a particular system, product or vehicle model because such products will function as part of a larger system or platform and must meet certain other specifications. We have invested and will continue to invest significant time and resources to have our products considered and possibly selected by OEMs or Tier 1 suppliers for use in a particular system, product or vehicle model, which is known as a “series production win” or a “series production award.” In the case of ADAS technology, a series production award would mean that our lidar sensor and/or ADAS solution had been selected for use in a particular vehicle model. However, if we are unable to achieve a series production award with respect to a particular vehicle model, we may not have an opportunity to supply our products to the automotive OEM for that vehicle model for a period of many years. In many cases, this period can be as long as five to seven or more years. If our products are not selected by an automotive OEM or our suppliers for one vehicle model or if our products are not successful in that vehicle model, it is unlikely that our product will be deployed in other vehicle models of that OEM. If we fail to win a significant number of vehicle models from one or more automotive OEMs or their suppliers, our future business prospects, results of operations, and financial conditions will be materially and adversely affected.
The complexity of our products and the limited visibility into the various environmental and other conditions under which potential customers may use the products could result in unforeseen delays or expenses from undetected defects, errors or reliability issues in hardware or software which could reduce the market adoption of our products, damage our reputation with prospective customers, expose us to product liability and other claims, and adversely affect our operating costs.
Our products are highly technical and complex and require high standards to manufacture and may experience defects, errors or reliability issues at various stages of development and production. We may be unable to timely manufacture or release products, or correct problems that have arisen or correct such problems to the customer’s satisfaction. Additionally, undetected errors, defects or security vulnerabilities could result in serious injury to the end users or bystanders of technology incorporating our products, inability of customers to commercialize technology incorporating our products, litigation against us, negative publicity and other consequences. These risks are particularly prevalent in the highly competitive ADAS market. These problems may also result in claims, including class actions, against us that could be costly to defend. Our reputation or brand may be damaged as a result of these problems and potential customers may be reluctant to buy our products, which could adversely affect our financial results.
Adverse conditions in particular industrial sectors, the automotive industry, or the global economy more generally could have adverse effects on our results of operations.
While we make our strategic planning decisions based on the assumption that the markets we are targeting will grow, our business is dependent, in large part on, and directly affected by, business cycles and other factors affecting industrial autonomy, the global automobile industry, and the global economy generally. Automotive production and sales are highly cyclical and depend on general economic conditions and other factors, including consumer spending and preferences, changes in interest rates and credit availability, consumer confidence, fuel costs, fuel availability, environmental impact, governmental incentives and regulatory requirements, and political volatility, especially in energy-producing countries and growth markets. In addition, automotive production and sales can be affected by our automotive OEM customers’ ability to continue operating in response to challenging economic conditions and in response to labor relations issues, regulatory requirements, trade agreements and other factors. The volume of automotive production in North America, Europe and the rest of the world has fluctuated, sometimes significantly, from year to year, and we expect such fluctuations to give rise to fluctuations in the demand for our products. Any significant adverse change in any of these factors may result in a reduction in automotive sales and production by our automotive OEM customers and could have a material adverse effect on our business, results of operations and financial condition.
| 19 |
Developments in alternative technology may adversely affect the demand for our lidar technology.
Significant developments in alternative technologies, such as cameras and radar, may materially and adversely affect our business prospects in ways we do not currently anticipate. Existing and other camera and radar technologies may emerge as OEMs’ preferred alternative to our solution, which would result in the loss of competitiveness of our lidar solution. Our R&D efforts may not be sufficient to adapt to these changes in technology and our solution may not compete effectively with these alternative systems.
ADAS features may be delayed in adoption by OEMs, which would negatively impact our long-term business prospects.
The ADAS market is fast evolving and there is generally a lack of an established regulatory framework. Vehicle regulators globally continue to consider new and enhanced emissions requirements, including electrification, to meet environmental and economic needs as well as pursue new safety standards to address emerging traffic risks. For instance, in May 2024, the National Highway Traffic Safety Administration, or NHTSA, published a new rule requiring automatic emergency braking systems in U.S. light vehicles and trucks by September 2029, and in December 2024, NHTSA proposed a voluntary program to improve evaluation and oversight of certain vehicles equipped with automated driving systems. To control new vehicle prices, among other concerns, OEMs may need to dedicate technology and cost additions to new vehicle designs to meet these emissions and safety requirements and postpone the consumer cost pressures of new ADAS features. As additional safety requirements are imposed on vehicle manufacturers, our business prospects may be materially impacted. Alternatively, if safety regulations in the U.S. were to become less stringent due to oversight reduction efforts, OEMs could be less inclined to pay for higher cost redundant safety systems and technologies, which could negatively impact the uptake of our sensor solutions.
Because the lidar and ADAS markets are rapidly evolving, it is difficult to forecast customer adoption rates, demand, and selling prices for our products and solutions.
We are pursuing opportunities in rapidly evolving markets, including technological and regulatory changes, and it is difficult to predict the timing and size of the opportunities. For example, lidar-based ADAS solutions require complex technology and because these automotive systems depend on technology from many companies, commercialization of ADAS products could be delayed or impaired on account of certain technological components of ours or others not being ready to be deployed in vehicles. In addition, the selling prices we are able to ultimately charge in the future for the products we are currently developing may be less than what we currently project. We expect to be subject to substantial pressure from automotive OEMs and Tier 1 suppliers to reduce the price of our products. It is possible that pricing pressures beyond our expectations could intensify as automotive OEMs pursue restructuring, consolidation, and cost-cutting initiatives. If we are unable to generate sufficient production cost savings in the future to offset price reductions, our gross margin and profitability would be adversely affected.
Our future financial performance will depend on our ability to make timely investments in the correct market opportunities. If one or more of these markets experience a shift in prospective customer demand, our products may not compete as effectively, if at all, and they may not be designed into commercialized products. Given the evolving nature of the markets in which we operate, it is difficult to predict customer demand or adoption rates for our products, selling prices or the future growth of our target markets. If demand does not develop or if we cannot accurately forecast it, the size of our markets, inventory requirements or future financial results will be adversely affected.
Because perception solutions involving lidar are new in the markets we are seeking to enter, opportunities in those market and related forecasts may not materialize as anticipated.
In addition to automotive markets, we are investing in and pursuing market opportunities in industrial and security & defense markets. We believe that our future revenue growth, if any, will depend in part on our ability to expand within new markets such as these and to enter new markets as they emerge. Each of these markets presents distinct risks and, in many cases, requires us to address the particular requirements of that market.
Addressing the unique requirements of adjacent markets can be time-consuming and costly. The market for lidar technology and perception solutions outside of automotive applications is relatively new, rapidly developing, and unproven in many markets or industries. Many of our customers and potential customers outside of the automotive industry remain in the testing and development phases, and we cannot be certain that they will commercialize products or systems with our products or at all. Additionally, we cannot be certain that lidar-based solutions will be sold into these markets at prices or scale needed to achieve profitability.
Our market opportunity estimates and growth forecasts are subject to significant uncertainty and are based on assumptions and estimates that may not materialize as anticipated. These estimates and forecasts relating to the expected size and growth of the markets for lidar-based technology may prove to be inaccurate. Even if these markets experience the forecasted growth we anticipate, we may not grow our business at similar rates, or at all. Our future growth is subject to many factors, including market adoption of our products, which is subject to many risks and uncertainties. Accordingly, we cannot assure you that these forecasts will not be materially inaccurate.
| 20 |
ITEM 1B. UNRESOLVED STAFF COMMENTS
None.
ITEM 1C. CYBERSECURITY
Our Cybersecurity Processes
A
key dimension to the security and effectiveness of our information system is our compliance with standards that are unique to the
industries in which we operate. For instance, it is critical that our information system achieves TISAX compliance. Established by
the German Association of the Automotive Industry, Trusted Information Security Assessment Exchange, or TISAX, is a globally
recognized assessment and exchange mechanism for information security in the automotive industry. Automotive OEMs rely on the TISAX
label to ensure that suppliers and partners have a solid information security management system in place. Our German subsidiary
completed the TISAX assessment and became registered as a TISAX participant in April 2025. To successfully complete the TISAX
assessment process in our U.S. operations,
Risks from Cybersecurity Threats
With
delegated authority from our Board of Directors and in accordance with its charter, our
Management reports quarterly to our Audit Committee on cybersecurity, including initiatives and strategies, and incident reporting and any lessons learned. From time to time, management will also engage in informal discussions with members of the Audit Committee about our cybersecurity practices and risks, including informing our Audit Committee Chair in a timely manner about any cybersecurity incidents that management determines may have a significant impact on our operations or that may trigger any reporting obligations.
Our Audit Committee will conduct an annual review of our cybersecurity measures and the effectiveness of our risk management strategies.
| 21 |
Stephen
Hrynewich joined MicroVision in 2023 and was named as our Interim Chief Financial Officer in December 2025. He is an experienced risk
management professional and currently oversees the Company’s accounting and finance strategies, including risk management.
ITEM 2. PROPERTIES
In September 2021, we entered into a lease on approximately 16,681 square feet of space located in Redmond, Washington that we use primarily for product testing and lab space. The lease provides for an initial term of 128 months that commenced November 1, 2021.
In September 2021, we entered into a second lease on approximately 36,062 square feet of space located in Redmond, Washington that we use primarily for general office space. The lease provides for an initial term of 120 months and commenced on December 1, 2022.
In December 2023, we entered into a lease on approximately 60,000 square feet of space located in Hamburg, Germany that we use primarily for general office space and product testing. The lease provides for an initial term of 60 months and commenced on November 1, 2024.
In September 2025, we entered into a lease on approximately 253 acres of space located in Warrenton, Virginia that we use for drone flight testing. The lease provides for an initial term of 12 months and commenced on October 1, 2025.
We believe that our facilities are adequate to meet our needs for the immediate future, and that, should it be needed, suitable additional or substitute space will be available to accommodate any such expansion of our operations. For a further description of our leased properties, see Part II, Item 8, Note 11. Leases, of the notes to our consolidated financial statements, which is incorporated by reference in response to this item.
ITEM 3. LEGAL PROCEEDINGS
We are subject to various claims and pending or threatened lawsuits in the normal course of business. We are not currently party to any other legal proceedings that management believes are reasonably possible to have a material adverse effect on our financial position, results of operations or cash flows.
| 22 |
ITEM 4. MINE SAFETY DISCLOSURES
Not applicable.
ITEM 4A. EXECUTIVE OFFICERS OF THE REGISTRANT
Executive officers are appointed by our Board of Directors and hold office until their successors are elected and duly qualified. The following persons serve as executive officers of MicroVision, Inc.:
Glen W. DeVos, age 64, was named Chief Executive Officer in September 2025, having joined MicroVision in March 2025 as Senior Vice President and Chief Technology Officer. Prior to MicroVision, he served in various business leadership and technology roles at Aptiv and its predecessor Delphi Automotive from 1992 to March 2024. From March 2017 to March 2024, he was a Senior Vice President and he served as Chief Technology Officer until January 2023. Also during that time, he served as President of Aptiv’s Advanced Safety and User Experience business unit from April 2021 to January 2023 and as President of its Mobility and Services Group from December 2017 to March 2020. Aptiv PLC, an Irish company headquartered in Switzerland with securities traded on the NYSE, is an engineering company focused on mobility and autonomous technologies for the automotive and commercial vehicle industries. Aptiv was spun out of Delphi Automotive in March 2017; Delphi was spun out of GM in 1999.
Drew Markham, age 57, was named Senior Vice President, General Counsel & Secretary, and Head of People Operations in June 2024, having joined MicroVision in June 2021 as Vice President, General Counsel & Secretary. Before joining MicroVision, from January 2017 through June 2021, Ms. Markham was President at Avisé, a social purpose corporation, where she was a legal consultant to publicly traded technology companies. From January 2013 to December 2016, she was Vice President, Deputy General Counsel & Assistant Secretary at RealNetworks, Inc. From June 1999 to December 2012, she was an attorney with Wilson Sonsini Goodrich & Rosati. Ms. Markham received her Juris Doctor degree from the University of Washington School of Law and her Bachelor of Science degree in Accounting from the University of Florida.
Stephen Hrynewich, age 59, was named Interim Chief Financial Officer in December 2025, after having served as the Company’s Vice President, Global Finance & Operations since August 2023. Prior to that, starting 2021, Mr. Hrynewich served as Director, Corporate Finance at Lucid Group, Inc., with previous finance roles at Republic Services from 2018 to 2020, as well as several automotive OEMs, including General Motors, Nissan North America, Mazda Motor Corporation, and Ford Motor Company.
Simon Biddiscombe, age 58, was named Executive Vice Chair in September 2025 to serve as a resource to Mr. DeVos, at the request of Mr. DeVos, for a temporary period of no more than twelve months. Mr. Biddiscombe has served as a director on the Board since 2018. Mr. Biddiscombe is an advisor to privately held Third Wave Automation, a provider of high-reach autonomous forklifts having previously served as their Chief Financial Officer from August 2022 to December 2024. He also served as Executive Partner at Thomas H. Lee Partners, a premier private equity firm investing in middle market growth companies, from May 2022 to October 2023. Mr. Biddiscombe was Chief Executive Officer and a board member at publicly traded MobileIron, Inc., a security software provider for the digital enterprise protecting corporate data across apps, networks, and clouds, from October 2017 until its sale to Ivanti, Inc. in December 2020. From May 2015 to October 2017, Mr. Biddiscombe served as MobileIron’s Chief Financial Officer. He previously served in several executive leadership roles including Chief Financial Officer at ServiceSource International, Chief Financial Officer and Chief Executive Officer at QLogic, Chief Financial Officer at Mindspeed Technologies, and Chief Financial Officer at Wyle Electronics. He began his career at PricewaterhouseCoopers LLP where he spent nine years, including the firm’s Silicon Valley technology accounting and audit practice. Mr. Biddiscombe holds a BA in business studies from the University of Glamorgan and is a Fellow of the Institute of Chartered Accountants in England and Wales.
| 23 |
PART II.
ITEM 5. MARKET FOR REGISTRANT’S COMMON EQUITY, RELATED STOCKHOLDER MATTERS AND ISSUER PURCHASES OF EQUITY SECURITIES
Market Information
Our common stock began trading publicly on August 27, 1996. Our common stock trades on The Nasdaq Global Market under the ticker symbol “MVIS.” We have never declared or paid cash dividends on our common stock. We currently anticipate that we will retain all future earnings to fund the operations of our business and do not anticipate paying dividends on the common stock in the foreseeable future.
As of February 26, 2026, there were approximately 133 holders of record of 306,579,855 shares of common stock outstanding. As many of our shares of common stock are held by brokerages and institutions on behalf of shareholders, we are unable to estimate the total number of beneficial holders of our common stock represented by these record holders.
Stock Performance Graph
This performance graph shall not be deemed to be “soliciting material” or “filed” or incorporated by reference in future filings with the Securities and Exchange Commission, or subject to the liabilities of Section 18 of the Securities Exchange Act of 1934, as amended, or the Exchange Act, except as shall be expressly set forth by specific reference in such filing.
The following graph shows a comparison from 2020 through 2025 of the cumulative total return for our common stock, the Russell 2000 Index and the Dow Jones US Electronic and Electrical Equipment Index. Our prior annual reports had included cumulative total return from the NASDAQ Electrical Components Index, however it is not included on this graph because the index has been discontinued. The comparisons in the graph are historical and are not intended to forecast or be indicative of possible future performance of our common stock.
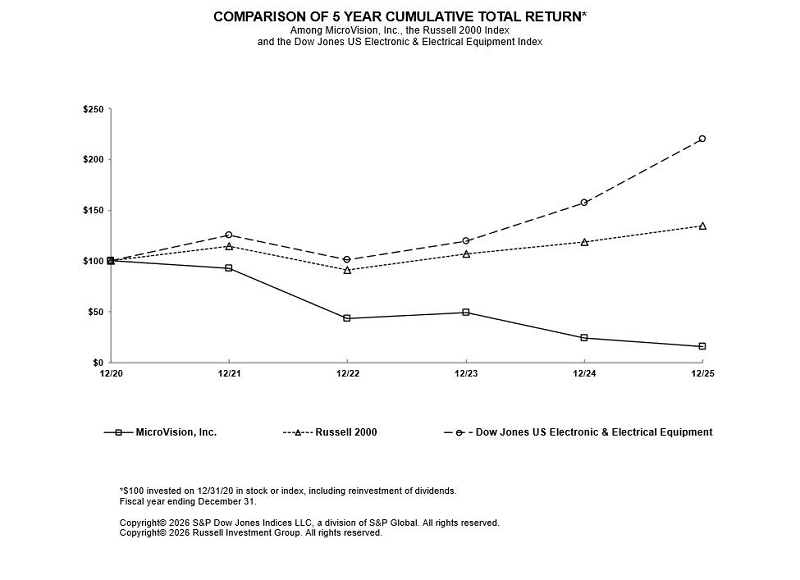
| 24 |
Recent Sales of Unregistered Securities
On November 21, 2023, pursuant to subscription agreements dated as of November 14, 2023, between us and each of the purchasers, we sold in the aggregate 50,761 shares of our common stock, par value $0.001 per share (“Common Stock”), at $1.97 per share, for an aggregate purchase price of approximately $0.1 million. The purchasers consisted of our then-Chief Executive Officer, then-Chief Financial Officer, General Counsel and certain members of our Board of Directors.
On March 13, 2023, pursuant to a subscription agreement dated as of March 13, 2023, we sold to our then-Chief Executive Officer 100,000 shares of Common Stock, at $2.14 per share, for an aggregate purchase price of $0.2 million.
The sales of our Common Stock described above were each undertaken in reliance upon an exemption from the registration requirements of the Securities Act of 1933, as amended (the “Securities Act”), pursuant to Section 4(a)(2).
ITEM 6. RESERVED
ITEM 7. MANAGEMENT’S DISCUSSION AND ANALYSIS OF FINANCIAL CONDITION AND RESULTS OF OPERATIONS
The following discussion of our financial condition and results of operations should be read in conjunction with our audited consolidated financial statements and the related notes included in Part II, Item 8 of this Form 10-K. The following discussion focuses on the results of our operations for the year ended December 31, 2025 compared to the year ended December 31, 2024. Similar discussion of the results of our operations for the year ended December 31, 2024 compared to the year ended December 31, 2023 can be found in “Management’s Discussion and Analysis of Financial Condition and Results of Operations” in Part II, Item 7 of our Annual Report on Form 10-K for the year ended December 31, 2024.
Overview
MicroVision, Inc. is defining the next generation of lidar-based perception solutions for automotive, industrial, and security & defense markets. We deliver integrated hardware and software solutions designed for real-world performance, automotive-grade reliability, and economic scalability. Our diverse portfolio of lidar sensors, with both short- and long-range lidar solutions, feature solid-state sensors with varying wavelengths, advanced sensor architectures, design-to-cost engineering, and open software solutions.
Our solutions enable advanced driver assistance systems, or ADAS, and autonomy features for customers in a wide range of markets, including automotive, industrial, and security & defense. Target industrial sectors include robotics, automated warehouse, agriculture, and mining. Our integrated hardware and software solutions enable intelligent autonomous, active safety, and automation systems which depend on secure, cost-effective, and energy-efficient solutions. Our software has been developed in close collaboration with automotive customers and also has broad application in industrial, defense, and commercial vehicle sectors.
We have incurred substantial losses since inception and expect to incur a significant loss during the fiscal year ending December 31, 2025. We have funded operations to date primarily through the sale of common stock, convertible preferred stock, warrants, the issuance of convertible debt and, to a lesser extent, from development contract revenues, product sales and licensing activities. In October 2024, we entered into a securities purchase agreement with an institutional investor for the purchase of senior secured convertible notes of up to $75.0 million. See Part II, Item 8, Note 7. Notes Payable and Derivative Liability. In February 2025, we entered into another securities purchase agreement with the same institutional investor for the issuance and sale of $8.0 million in shares of common stock, plus warrants to purchase additional shares of common stock for approximately $9.0 million. See Part II, Item 8, Note 8. Warrant Liability. In February 2026, we entered into a securities purchase and exchange agreement with the same investor, pursuant to which we issued two senior secured convertible notes due March 2028 – one for approximately $20.6 million in exchange for the previously existing senior secured convertible note due March 2026 and the other for approximately $22.4 million. See Part II, Item 8, Note 17. Subsequent Events for additional discussion.
| 25 |
There can be no assurance that additional capital will be available or that, if available, it will be available on terms acceptable to us on a timely basis. We cannot be certain that we will succeed in commercializing our technology or products.
Critical Accounting Policies and Estimates
Our discussion and analysis of our financial condition and results of operations are based upon our consolidated financial statements, which have been prepared in accordance with accounting principles generally accepted in the United States. The preparation of these financial statements requires us to make estimates and judgments that materially affect the reported amounts of assets, liabilities, revenues and expenses, and related disclosure of contingent liabilities. We evaluate our estimates on a continuous basis. We base our estimates on historical data, terms of existing contracts, our evaluation of trends in the consumer display and 3D sensing industries, information provided by our current and prospective customers and strategic partners, information available from other outside sources and on various other assumptions we believe to be reasonable under the circumstances. The results form the basis for making judgments regarding the carrying values of assets and liabilities that are not readily apparent from other sources. Actual results may differ from these estimates under different assumptions or conditions.
We believe the following key accounting policies require significant judgments and estimates used in the preparation of our consolidated financial statements.
Business Combination
Our business combination is accounted for under the acquisition method. We allocate the fair value of purchase consideration to the tangible and intangible assets acquired and liabilities assumed based on their estimated fair values at the acquisition date. The excess of the fair value of the underlying net assets acquired and liabilities assumed over the purchase consideration is included in bargain purchase gain in the consolidated statements of operations. Such valuations require management to make significant estimates and assumptions, especially with respect to intangible assets.
Intangible Assets
Our intangible assets consist of acquired technology from the January 2023 Ibeo asset purchase and purchased patents. The estimated fair value of acquired technology was calculated through the income approach using the multi-period excess earnings and relief from royalty methodologies. The intangible assets are amortized using the straight-line method over their estimated period of benefit, ranging from one to seventeen years. Intangible assets are reviewed for impairment whenever events or changes in circumstances indicate the carrying value may not be recoverable. Recoverability of these assets is measured by comparison of their carrying values to the projected undiscounted net cash flows associated with the related intangible assets or group of assets over their remaining lives. Measurement of an impairment loss for our intangible assets is based on the difference between the fair value of the asset and its carrying value. During 2025 and 2024, we recorded non-cash impairment charges of $10.1 million and $4.2 million primarily related to our perception software and reference software, respectively. See Part II, Item 8, Note 9. Financial Statement Components – Intangible Assets.
Share-Based Compensation
We issue share-based compensation to employees in the form of stock options, restricted stock units (RSUs), and performance stock units (PSUs). We account for the share-based awards by recognizing the fair value of share-based compensation expense on a straight-line basis over the service period of the award, net of estimated forfeitures. The fair value of stock options is estimated on the grant date using the Black-Scholes option pricing model. The fair value of RSUs and non-executive PSUs is determined by the closing price of our common stock on the grant date or the period end date for the awards that are being measured by the service inception date. For performance-based awards, expense is recognized when it is probable the performance criteria will be achieved. If the likelihood becomes improbable that the performance criteria will be achieved, the expense is reversed. The fair value of RSUs and PSUs (other than certain executive PSUs) is determined by the closing price of our common stock on the grant date or the period end date for the awards that are being measured by the service inception date. Executive PSUs issued in 2022 were valued using a Monte Carlo simulation model using the following inputs: stock price, volatility, and risk-free interest rates. Changes in estimated inputs or using other option valuation methods may result in materially different option values and share-based compensation expense.
| 26 |
Leases
Significant judgment may be required when determining whether a contract contains a lease, the length of the lease term, the allocation of the consideration in a contract between lease and non-lease components, and the determination of the discount rate included in our office lease. We review the underlying objective of each contract, the terms of the contract, and consider our current and future business conditions when making these judgments.
Derivative Liability
We evaluate our financial instruments, specifically, our notes payable, to determine if such instruments are derivatives or contain features that qualify as embedded derivatives in accordance with ASC 815, “Derivatives and Hedging”. For derivative financial instruments that are accounted for as liabilities, the derivative instrument is initially recorded at its fair value on the issuance date and is then re-valued at each reporting date, with changes in the fair value reported as an unrealized gain or loss in earnings on the consolidated statements of operations.
Warrant Liability
We account for warrants as either equity-classified or liability-classified instruments based on an assessment of the warrant’s specific terms and applicable authoritative guidance included in ASC 480, “Distinguishing Liabilities from Equity”, and ASC 815. The assessment considers whether the warrants are freestanding financial instruments pursuant to ASC 480, whether the warrants meet the definition of a liability pursuant to ASC 480, and whether the warrants meet all of the requirements for equity classification under ASC 815. This assessment, which requires the use of professional judgment, is conducted at the time of warrant issuance and as of each subsequent reporting period end date while the warrants are outstanding.
Warrants that meet all of the criteria for equity classification are required to be recorded as a component of additional paid-in capital at the time of issuance, or when the conditions for equity classification are met, and are not remeasured. Warrants that do not meet the required criteria for equity classification are classified as liabilities. We adjust such warrants to fair value at each reporting period until the warrants are exercised or expire. Changes in fair value are recognized in our consolidated statements of operations.
Results of Operations
Revenue
| 2025 | 2024 | $ change | % change | |||||||||||||
| (In thousands) | ||||||||||||||||
| Revenue | $ | 1,208 | $ | 4,696 | (3,488 | ) | (74.3 | ) | ||||||||
Revenues are recognized when control of the promised goods or services are transferred to our customers, in an amount that reflects the consideration that we expect to receive in exchange for those goods or services. We recognize revenue either at a point in time, or over time, depending upon the characteristics of the individual contract. If control of the deliverable(s) transfers over time, the revenue is recognized in proportion to the transfer of control. If control passes to the customer only upon completion and transfer of the asset, revenue is recognized at the completion of the contract.
The decrease in revenue for the year ended December 31, 2025 compared to the same period in 2024 was primarily due a lower sales to a leading manufacturer of agriculture equipment, as well as lower sales of MOVIA L sensors as part of RFQ evaluation processes to an industrial customer and to Daimler Truck North America and affiliates.
| 27 |
Cost of revenue
| 2025 | % of revenue | 2024 | % of revenue | $ change | % change | |||||||||||||||||||
| (In thousands) | ||||||||||||||||||||||||
| Cost of revenue | $ | 18,548 | 1,535.4 | $ | 7,530 | 160.3 | $ | 11,018 | 146.3 | |||||||||||||||
Cost of revenue includes the direct and allocated indirect costs of products and services sold to customers. Direct costs include labor, materials, reserves for estimated warranty expenses, and other costs incurred directly, or charged to us by our contract manufacturers, in the manufacture of these products. Indirect costs include labor, overhead, and other costs associated with operating our manufacturing capabilities. Overhead includes the costs of procuring, inspecting and storing material, facility and other costs, and is allocated to cost of revenue based on the proportion of indirect labor which supported revenue activities.
Cost of revenue can fluctuate significantly from period to period, depending on the product mix and volume, the level of overhead expense and the volume of direct material purchased. The increase in cost of revenue for the year ended December 31, 2025 compared to the same period in 2024 was primarily due to $9.9 million of obsolete inventory associated with older configurations of short-range MOVIA L sensors and $3.2 million of adverse purchase commitments related to the production of select MOVIA L sensor inventory. See Part II, Item 8, Note 9. Financial Statement Components for additional discussion.
Research and development expense
| 2025 | 2024 | $ change | % change | |||||||||||||
| (In thousands) | ||||||||||||||||
| Research and development expense | $ | 31,720 | $ | 49,015 | $ | (17,295 | ) | (35.3 | ) | |||||||
Research and development expense consists of compensation related costs of employees and contractors engaged in internal research and product development activities, direct materials to support development programs, laboratory operations, outsourced development and processing work, and other operating expenses. We assign our research and development resources based on the business opportunity of the available projects, the skill mix of the resources available and the contractual commitments we have made to our customers. We believe that a substantial level of continuing research and development expenses will be required to further develop our scanning technology.
The decrease in research and development expense during the year ended December 31, 2025 compared to the same period in 2024 was primarily due to a reduced workforce resulting in lower salary and benefits expense of $7.9 million, lower restructuring charges of $5.4 million, lower purchased services of $2.1 million, and lower IT and software costs of $1.1 million. These decreases were partially offset by higher building expenses of $0.9 million.
Sales, marketing, general and administrative expense
| 2025 | 2024 | $ change | % change | |||||||||||||
| (In thousands) | ||||||||||||||||
| Sales, marketing, general and administrative expense | $ | 20,325 | $ | 29,346 | $ | (9,021 | ) | (30.7 | ) | |||||||
Sales, marketing, general and administrative expense includes compensation and support costs for marketing, sales, management and administrative staff, and for other general and administrative costs, including legal and accounting services, consultants and other operating expenses.
The decrease in sales, marketing, general and administrative expense during the year ended December 31, 2025 as compared to the same period in 2024 was primarily due to lower non-cash share based compensation expense of $7.6 million from the reversal of previously recognized expense related to the forfeiture of awards in connection with the executive separations that occurred during the year ended December 31, 2025, lower salary and benefits expense and non-cash compensation of $1.5 million, lower restructuring charges of $0.6 million, and lower trade show expense of $0.4 million. These decreases were partially offset by higher recruiting expenses of $0.6 million, higher building expenses of $0.4 million, higher purchased services fees of $0.3 million, and higher advertising costs of $0.3 million.
| 28 |
Impairment loss on intangible assets
| 2025 | 2024 | $ change | % change | |||||||||||||
| (In thousands) | ||||||||||||||||
| Impairment loss on intangible assets | $ | 10,057 | $ | 4,181 | $ | 5,876 | 140.5 | |||||||||
During the year ended December 31, 2025, management identified impairment indicators related to perception software, which resulted in a $10.1 million non-cash impairment charge. During the year ended December 31, 2024, management identified impairment indicators related to MOSAIK software. We performed an assessment of projected future cash flows and determined the software was fully impaired, which resulted in a $4.2 million non-cash impairment charge. See Part II, Item 8, Note 9. Financial Statement Components for additional discussion.
Impairment loss on operating lease right-of-use assets
| 2025 | 2024 | $ change | % change | |||||||||||||
| (In thousands) | ||||||||||||||||
| Impairment loss on operating lease right-of-use assets | $ | 1,201 | $ | - | $ | 1,201 | - | |||||||||
Impairment loss on operating lease right-of-use assets includes non-cash charges during the year ended December 31, 2025 related to our Hamburg office space lease. See Part II, Item 8, Note 10. Leases for additional discussion.
Impairment loss on property and equipment, net
| 2025 | 2024 | $ change | % change | |||||||||||||
| (In thousands) | ||||||||||||||||
| Impairment loss on property and equipment, net | $ | 2,185 | $ | - | $ | 2,185 | - | |||||||||
Impairment loss on property and equipment, net includes non-cash charges during the year ended December 31, 2025 related to abandoned production equipment for prior designs of our long-range MAVIN sensors. See Part II, Item 8, Note 9. Financial Statement Components for additional discussion.
Interest expense
| 2025 | 2024 | $ change | % change | |||||||||||||
| (In thousands) | ||||||||||||||||
| Interest expense | $ | (18,531 | ) | $ | (4,457 | ) | $ | (14,074 | ) | 315.8 | ||||||
The increase in interest expense during the year ended December 31, 2025 compared to the same period in 2024 relates to $7.3 million of non-cash interest expense representing the discount on the 2025 Purchase Agreement for warrants and shares of common stock (see Part II, Item 8, Note 8. Warrant Liability), $9.1 million of non-cash interest expense related to amortization of the debt discount and issuance costs on notes payable, and $2.1 million of non-cash interest expense related to the modification of notes payable (see Part II, Item 8, Note 7. Notes Payable and Derivative Liability).
Unrealized gain (loss) on derivative liability
| 2025 | 2024 | $ change | % change | |||||||||||||
| (In thousands) | ||||||||||||||||
| Unrealized gain (loss) on derivative liability | $ | 5,709 | $ | (8,866 | ) | $ | 14,575 | (164.4 | ) | |||||||
Unrealized gain (loss) on derivative liability reflects the revaluation of our derivative liability associated with notes payable as of December 31, 2025 and 2024. Due to the decrease in the fair value of the derivative liability as of December 31, 2025 relative to December 31, 2024, we recognized an unrealized gain during 2025. Due to the increase in the fair value of the derivative liability as of December 31, 2024 relative to its initial measurement on October 23, 2024, we recognized an unrealized loss during 2024. See Part II, Item 8, Note 7. Notes Payable and Derivative Liability for additional discussion.
| 29 |
Unrealized gain on warrant liability
| 2025 | 2024 | $ change | % change | |||||||||||||
| (In thousands) | ||||||||||||||||
| Unrealized gain on warrant liability | $ | 4,422 | $ | - | $ | 4,422 | - | |||||||||
Unrealized gain on warrant liability reflects the revaluation of our warrant liability as of December 31, 2025. Due to the decrease in the fair value of the warrant liability during the period, we recognized an unrealized gain during 2025. See Part II, Item 8, Note 8. Warrant Liability for additional discussion of warrants issued during 2025.
Realized loss on debt extinguishment
| 2025 | 2024 | $ change | % change | |||||||||||||
| (In thousands) | ||||||||||||||||
| Realized loss on debt extinguishment | $ | (4,654 | ) | $ | - | $ | (4,654 | ) | - | |||||||
As a result of the debt modification during the year ended December 31, 2025, we recognized a loss on extinguishment of notes payable. See Part II, Item 8, Note 7. Notes Payable and Derivative Liability for additional discussion.
Income Taxes
During the years ended December 31, 2025 and 2024, we recognized a tax benefit of $0.1 million and tax expense $0.5 million, respectively, mainly related to income in foreign jurisdictions, partially offset by a deferred income tax benefit generated by a 2025 loss provision on our Hamburg, Germany office lease. As of December 31, 2025, we had net operating loss carryforwards of approximately $549.4 million for federal income tax reporting purposes. In addition, we have research and development tax credits of $11.2 million. During 2025, $16.0 million federal net operating losses and $0.3 million general business credits expired unused. A majority of the net operating loss carryforwards and research and development credits available to offset future taxable income, if any, will expire in varying amounts from 2026 to 2044, if not previously used.
In certain circumstances, as specified in the Internal Revenue Code, a 50% or more ownership change by certain combinations of our shareholders during any three-year period would result in a limitation on our ability to use a portion of our net operating loss carryforwards.
We recognize interest accrued and penalties related to unrecognized tax benefits in tax expense. We did not have any unrecognized tax benefits at December 31, 2025 or at December 31, 2024.
Liquidity and Capital Resources
We have incurred significant losses since inception. We have funded operations to date primarily through the sale of common stock, convertible preferred stock, warrants, the issuance of convertible debt and, to a lesser extent, from development contract revenues, product sales, and licensing activities. As of December 31, 2025, the Company had $32.3 million in cash and cash equivalents and $42.5 million in short-term investment securities, or $74.8 million total. In February 2026, we raised net proceeds of $20.9 million from the exchange and issuance of senior secured convertible notes to an existing investor. In addition to cash and cash equivalents, the Company also has potential availability of $42.0 million left on our existing $150.0 million ATM facility that was put in place in the first quarter of 2024, subject to certain limitations.
In consideration of the above, after factoring in the $33.2 million purchase price of the Luminar asset acquisition in February 2026 (see Part II, Item 8, Note 17. Subsequent Events), the Company has total liquidity of $104.5 million. Pursuant to terms of the securities purchase and exchange agreement entered into in February 2026, we will maintain minimum cash liquidity of the lesser of $21.5 million or 110% of the then outstanding balance of the Note for the remaining duration of the Note term. Based on our current operating plan, we anticipate that we have sufficient cash and cash equivalents to fund our operations for at least the next 12 months.
| 30 |
Operating activities
Cash used in operating activities totaled $58.7 million during 2025, compared to $68.5 million in 2024. During the years ended December 31, 2025 and 2024, we made payments of $7.7 million and $1.9 million, respectively, to our contract manufacturing partner in connection with the buildup of MOVIA sensor inventory for direct sales to both automotive and non-automotive customers. As of December 31, 2025, we had open purchase commitments of $3.2 million related to the production of MOVIA L sensor inventory. We have determined that certain of the sensors are obsolete and an adverse purchase commitment for the entire balance of open purchase commitments has been recorded as of December 31, 2025.
Investing activities
During the year ended December 31, 2025, cash used in investing activities was $24.6 million compared to cash provided by investment activities of $2.7 million during the same period in 2024. During the year ended December 31, 2025, we purchased short-term investment securities totaling $51.9 million and sold short-term investment securities totaling $30.1 million, compared to purchases of $26.1 million and sales of $35.4 million in the same period of 2024. During the year ended December 31, 2024, we made advances of $2.2 million related to the acquisition of Scantinel assets (see Part II, Item 8. Note 17, Subsequent Events). During the same period in 2024, we made payments totaling $6.3 million related to the acquisition of Ibeo assets.
Financing activities
Net cash provided by financing activities totaled $60.9 million during the year ended December 31, 2025, compared to $72.9 million during the same period of 2024. Net proceeds from issuance of common stock and warrants were $77.4 million during the year ended December 31, 2025, compared to $34.7 million during the same period in 2024. In 2025, we made scheduled principal repayments of $16.5 million associated with our senior secured convertible notes. In 2024, we received approximately $38.1 million in net proceeds, inclusive of debt issuance costs, from the issuance of $45.0 million senior secured convertible notes. See Part II, Item 8. Note 7, Notes Payable and Derivative Liabilities.
The following is a list of our financing activities during 2025 and 2024.
| ● | In February 2026, we entered into a securities purchase and exchange agreement with an institutional investor, pursuant to which we issued two senior secured convertible notes due March 2028 – one for approximately $20.6 million in exchange for the previously existing senior secured convertible note due March 2026 and the other for approximately $22.4 million. See Part II, Item 8, Note 17. Subsequent Events for additional discussion. | |
| ● | In February 2025, we entered into a securities purchase agreement for the purchase of 5,750,225 shares of our common stock and warrants to purchase 5,750,225 shares of our common stock for $1.57 per share. We received proceeds, net of all costs, of $7.8 million. | |
| ● | In October 2024, we entered into a Securities Purchase Agreement (the “Purchase Agreement”) for the purchase of senior secured convertible notes (the “Note”) with an institutional investor (the “Holder”). The principal amount for the initial note was $45.0 million. We received proceeds, net of all costs, of $38.1 million. | |
| ● | In March 2024, we entered into a $150.0 million ATM equity offering agreement with Deutsche Bank Securities, Inc., Mizuho Securities USA LLC and Craig-Hallum Capital Group LLC (collectively, the “Agents”). Under the agreement, we are able, at our discretion, to offer and sell shares of our common stock having an aggregate value of up to $150.0 million through or directly to the Agents. As of December 2025, we completed sales under such sales agreement of 80.6 million shares for net proceeds of $104.0 million. As of December 31, 2025, we have approximately $42.0 million available under this sales agreement. |
| 31 |
Our capital requirements will depend on many factors, including, but not limited to, the rate at which OEMs and other potential customers introduce products incorporating our technology and the market acceptance and competitive position of such products. Our ability to raise capital will depend on numerous factors, including the following:
| ● | Perceptions of our ability to continue as a going concern; | |
| ● | Market acceptance of products incorporating our technology; | |
| ● | Changes in evaluations and recommendations by any securities analysts following our stock or our industry generally; | |
| ● | Announcements by other companies in our industry; | |
| ● | Changes in business or regulatory conditions; | |
| ● | Announcements or implementation by our competitors of technological innovations or new products; | |
| ● | The status of particular development programs and the timing of performance under specific development agreements; | |
| ● | Economic and stock market conditions; | |
| ● | The cost of filing, prosecuting, defending and enforcing any patent claims and other intellectual property rights; | |
| ● | Our ability to establish cooperative development or licensing arrangements; | |
| ● | Our authorized shares available for sale; or | |
| ● | Other factors unrelated to our company or industry. |
If we are successful in establishing OEM co-development arrangements, we may receive full or partial funding for certain non-recurring engineering costs for technology development and/or product development. Nevertheless, we expect our capital requirements to remain high as we expand our activities and operations with the objective of commercializing our technology.
Recent Accounting Pronouncements
See Note 2, “Summary of significant accounting policies,” in the notes to the consolidated financial statements found in Part II, Item 8 of this Form 10-K.
ITEM 7A. QUANTITATIVE AND QUALITATIVE DISCLOSURES ABOUT MARKET RISK
Interest Rate and Market Liquidity Risks
As of December 31, 2025, all of our cash and cash equivalents have variable interest rates; however, we believe our exposure to market and interest rate risks is not material. Due to the generally short-term maturities of our investment securities, we believe that the market risk arising from our holdings of these financial instruments is not significant. We do not believe that inflation has had a material effect on our business, financial condition or results of operations; however, we do anticipate our labor costs to increase as a result of inflationary pressures.
Our investment policy generally directs that the investment managers should select investments to achieve the following goals: principal preservation, adequate liquidity, and return. As of December 31, 2025, our cash and cash equivalents are comprised of short-term highly rated (A rated securities and above) money market savings accounts and our short-term investments are comprised of highly rated corporate and government debt securities (A rated securities and above). The values of cash and cash equivalents and investment securities, available-for-sale as of December 31, 2025, are as follows (in thousands):
| Amount | Percent | |||||||
| Cash and cash equivalents | $ | 32,363 | 43.2 | % | ||||
| Less than one year | 42,471 | 56.8 | ||||||
| $ | 74,834 | 100.0 | % | |||||
Foreign Exchange Rate Risk
Our major contract and collaborative research and development agreements, product sales, and licensing activity payments are currently made in U.S. dollars or Euros. Changes in the relative value of the U.S. dollar to the Euro and other currencies may affect revenue and other operating results as expressed in U.S. dollars. In addition, our international subsidiary financial statements are denominated in Euros. As such, the consolidated financial statements will continue to remain subject to the impact of foreign currency translation as our international operations continue to expand. In the future, we may enter into foreign currency hedges to offset material exposure to currency fluctuations when we can adequately determine the timing and amounts of the exposure.
| 32 |
ITEM 8. FINANCIAL STATEMENTS AND SUPPLEMENTARY DATA
INDEX TO CONSOLIDATED FINANCIAL STATEMENTS
| 33 |
Report of Independent Registered Public Accounting Firm
To the Shareholders and the Board of Directors of
MicroVision, Inc.
Opinion on the Financial Statements
Basis for Opinion
These consolidated financial statements are the responsibility of the Company’s management. Our responsibility is to express an opinion on the Company’s consolidated financial statements based on our audits. We are a public accounting firm registered with the Public Company Accounting Oversight Board (United States) (“PCAOB”) and are required to be independent with respect to the Company in accordance with the U.S. federal securities laws and the applicable rules and regulations of the Securities and Exchange Commission and the PCAOB.
We conducted our audits in accordance with the standards of the PCAOB. Those standards require that we plan and perform the audit to obtain reasonable assurance about whether the consolidated financial statements are free of material misstatement, whether due to error or fraud. The Company is not required to have, nor were we engaged to perform, an audit of its internal control over financial reporting. As part of our audits we are required to obtain an understanding of internal control over financial reporting but not for the purpose of expressing an opinion on the effectiveness of the Company’s internal control over financial reporting. Accordingly, we express no such opinion.
Our audits included performing procedures to assess the risks of material misstatement of the consolidated financial statements, whether due to error or fraud, and performing procedures to respond to those risks. Such procedures included examining, on a test basis, evidence regarding the amounts and disclosures in the consolidated financial statements. Our audits also included evaluating the accounting principles used and significant estimates made by management, as well as evaluating the overall presentation of the consolidated financial statements. We believe that our audits provide a reasonable basis for our opinion.
Critical Audit Matters
The critical audit matters communicated below are matters arising from the current period audit of the consolidated financial statements that were communicated or required to be communicated to the audit committee and that: (1) relate to accounts or disclosures that are material to the consolidated financial statements and (2) involved our especially challenging, subjective, or complex judgments.
The communication of critical audit matters does not alter in any way our opinion on the consolidated financial statements, taken as a whole, and we are not, by communicating the critical audit matters below, providing a separate opinion on the critical audit matters or on the accounts or disclosures to which they relate.
Impairment of Intangible Assets
Critical Audit Matter Description
As described in Notes 2 and 9 to the consolidated financial statements, intangible assets are reviewed for impairment whenever events or changes in circumstances indicate the carrying value may not be recoverable. Recoverability of these assets is measured by comparison of their carrying values to the projected undiscounted net cash flows associated with the related intangible assets or group of assets over their remaining lives. Measurement of an impairment loss for intangible assets is based on the difference between the fair value of the asset and its carrying value. The December 31, 2025 impairment test indicated the carrying amount of the perception software intangible asset is not recoverable, resulting in a non-cash impairment charge of $10.1 million, thereby fully writing off the asset.
We identified the impairment assessment of intangible assets as a critical audit matter. Performing audit procedures to evaluate the significant assumptions used by management when developing the undiscounted cash flows to be generated by the assets required a high degree of auditor judgment, subjectivity and effort when performing and evaluating the results of those procedures.
| 34 |
How We Addressed the Matter in Our Audit
Addressing the matter involved performing procedures and evaluating audit evidence in connection with forming an overall opinion on the consolidated financial statements. Our audit procedures related to the matter included the following, among others:
| ● | Evaluating management’s process for identifying indicators of impairment. | |
| ● | Testing management’s process for developing the estimated future undiscounted cash flows used in the impairment assessment. | |
| ● | Testing the completeness and accuracy of the underlying data used in the model. | |
| ● | Evaluating the reasonableness of the significant assumptions used by management related to estimated future undiscounted cash flows. | |
| ● | Evaluating management’s ability to forecast cash flows by comparing actual results to management’s historical forecasts. |
Valuation of Derivative Liability
Critical Audit Matter Description
As described in Note 7, the fair value of the derivative liability is determined utilizing a “with and without” method, in which the fair value is calculated as the difference in the fair value of the entire hybrid instrument and the fair value of the instrument excluding the bifurcated derivative features. The fair value of the hybrid instrument is estimated using a binomial lattice model. The fair value of the host contract excluding embedded derivative features is estimated using a debt discounted cash flow model, which assumes that the contract is a debt instrument with only the option to redeem partial principal payments prior to maturity.
We identified the valuation of derivative liability as a critical audit matter. Performing audit procedures to evaluate the reasonableness of the fair value estimates and underlying inputs and assumptions required especially challenging and subjective auditor judgment and an increased extent of effort, including the need to involve of our valuation professionals.
How We Addressed the Matter in Our Audit
Addressing the matter involved performing procedures and evaluating audit evidence in connection with forming an overall opinion on the consolidated financial statements. Our audit procedures related to the matter included the following, among others:
| ● | Testing management’s process used in determining the estimated fair value of the derivative liability by: |
| ● | Involving our valuation professionals with specialized skills and knowledge who assisted in evaluating the valuation methodologies and the reasonableness of significant assumptions. | |
| ● | Testing the mathematical accuracy of management’s calculations. | |
| ● | Testing the completeness, accuracy and reliability of the underlying data used in the estimate, such as historical volatility, stock price, and daily trading volume. | |
| ● | Evaluated the knowledge, skill, and ability of the Company’s third-party specialist that was used to estimate the fair value of the derivative liability. |
| /s/
|
|
| March 4, 2026 | |
We have served as the Company’s auditor since 2012. |
| 35 |
MicroVision, Inc.
Consolidated Balance Sheets
(In thousands, except per share data)
| December 31, | ||||||||
| 2025 | 2024 | |||||||
| Assets | ||||||||
| Current assets | ||||||||
| Cash and cash equivalents | $ | $ | ||||||
| Investment securities, available-for-sale | ||||||||
| Restricted cash, current | ||||||||
| Accounts receivable, net of allowances | ||||||||
| Inventory | ||||||||
| Other current assets | ||||||||
| Total current assets | ||||||||
| Property and equipment, net | ||||||||
| Operating lease right-of-use assets | ||||||||
| Restricted cash, net of current portion | ||||||||
| Intangible assets, net | ||||||||
| Other assets | ||||||||
| Total assets | $ | $ | ||||||
| Liabilities and shareholders’ equity | ||||||||
| Current liabilities | ||||||||
| Accounts payable | $ | $ | ||||||
| Accrued liabilities | ||||||||
| Contract liabilities | ||||||||
| Derivative liability | ||||||||
| Notes payable, current | ||||||||
| Operating lease liabilities, current | ||||||||
| Finance lease liabilities, current | ||||||||
| Other current liabilities | ||||||||
| Total current liabilities | ||||||||
| Notes payable, net of current portion | ||||||||
| Warrant liability | ||||||||
| Operating lease liabilities, net of current portion | ||||||||
| Finance lease liabilities, net of current portion | ||||||||
| Other long-term liabilities | ||||||||
| Total liabilities | ||||||||
| Commitments and contingencies (Note 12) | ||||||||
| Shareholders’ equity | ||||||||
| Preferred stock, par value $; shares authorized; and shares issued and outstanding as of December 31, 2025 and 2024 | ||||||||
| Common stock, par value $; shares authorized; and shares issued and outstanding as of December 31, 2025 and 2024, respectively | ||||||||
| Additional paid-in capital | ||||||||
| Accumulated other comprehensive income | ||||||||
| Accumulated deficit | ( | ) | ( | ) | ||||
| Total shareholders’ equity | ||||||||
| Total liabilities and shareholders’ equity | $ | $ | ||||||
The accompanying notes are an integral part of these consolidated financial statements
| 36 |
MicroVision, Inc.
Consolidated Statements of Operations
(In thousands, except per share data)
| Year Ended December 31, | ||||||||||||
| 2025 | 2024 | 2023 | ||||||||||
| Revenue | $ | $ | $ | |||||||||
| Cost of revenue | ||||||||||||
| Gross (loss) profit | ( | ) | ( | ) | ||||||||
| Research and development expense | ||||||||||||
| Sales, marketing, general and administrative expense | ||||||||||||
| Impairment loss on intangible assets | ||||||||||||
| Impairment loss on operating lease right-of-use assets | ||||||||||||
| Impairment loss on property and equipment, net | ||||||||||||
| Loss (gain) on disposal of fixed assets | ( | ) | ||||||||||
| Total operating expenses | ||||||||||||
| Loss from operations | ( | ) | ( | ) | ( | ) | ||||||
| Bargain purchase gain, net of tax | ||||||||||||
| Interest expense | ( | ) | ( | ) | ( | ) | ||||||
| Unrealized gain (loss) on derivative liability | ( | ) | ||||||||||
| Unrealized gain on warrant liability | ||||||||||||
| Realized loss on debt extinguishment | ( | ) | ||||||||||
| Other income | ||||||||||||
| Net loss before taxes | $ | ( | ) | $ | ( | ) | $ | ( | ) | |||
| Income tax benefit (expense) | ( | ) | ( | ) | ||||||||
| Net loss | $ | ( | ) | $ | ( | ) | $ | ( | ) | |||
| Net loss per share - basic and diluted | $ | ) | $ | ) | $ | ) | ||||||
| Weighted-average shares outstanding - basic and diluted | ||||||||||||
The accompanying notes are an integral part of these consolidated financial statements.
| 37 |
MicroVision, Inc.
Consolidated Statements of Comprehensive Loss
(In thousands)
| Year Ended December 31, | ||||||||||||
| 2025 | 2024 | 2023 | ||||||||||
| Net loss | $ | ( | ) | $ | ( | ) | $ | ( | ) | |||
| Other comprehensive income | ||||||||||||
| Unrealized (loss) gain on investment securities, available-for-sale | ( | ) | ||||||||||
| Unrealized gain (loss) on translation | ( | ) | ||||||||||
| Total comprehensive income (loss) | ( | ) | ||||||||||
| Comprehensive loss | $ | ( | ) | $ | ( | ) | $ | ( | ) | |||
The accompanying notes are an integral part of these consolidated financial statements.
| 38 |
MicroVision, Inc.
Consolidated Statements of Shareholders’ Equity
(In thousands)
| Common Stock | Additional paid-in | Accumulated other comprehensive | Accumulated | Total shareholders’ | ||||||||||||||||||||
| Shares | Par value | capital | income (loss) | deficit | equity | |||||||||||||||||||
| Balance at December 31, 2022 | $ | | $ | $ | ( | ) | $ | ( | ) | $ | ||||||||||||||
| Share-based compensation expense | ||||||||||||||||||||||||
| Exercise of options | ||||||||||||||||||||||||
| Sales of common stock, net | ||||||||||||||||||||||||
| Net loss | - | ( | ) | ( | ) | |||||||||||||||||||
| Other comprehensive income | - | |||||||||||||||||||||||
| Balance at December 31, 2023 | $ | $ | $ | $ | ( | ) | $ | |||||||||||||||||
| Share-based compensation expense | ||||||||||||||||||||||||
| Exercise of options | ||||||||||||||||||||||||
| Sales of common stock, net | ||||||||||||||||||||||||
| Conversions of notes payable | ||||||||||||||||||||||||
| Net loss | - | ( | ) | ( | ) | |||||||||||||||||||
| Other comprehensive loss | - | ( | ) | ( | ) | |||||||||||||||||||
| Balance at December 31, 2024 | $ | $ | $ | $ | ( | ) | $ | |||||||||||||||||
| Share-based compensation expense | ||||||||||||||||||||||||
| Exercise of options | ||||||||||||||||||||||||
| Sales of common stock, net and warrants | ||||||||||||||||||||||||
| Conversions of notes payable | ||||||||||||||||||||||||
| Net loss | - | ( | ) | ( | ) | |||||||||||||||||||
| Other comprehensive income | - | |||||||||||||||||||||||
| Balance at December 31, 2025 | $ | $ | $ | $ | ( | ) | $ | |||||||||||||||||
The accompanying notes are an integral part of these consolidated financial statements.
| 39 |
MicroVision, Inc.
Consolidated Statements of Cash Flows
(In thousands)
| Year Ended December 31, | ||||||||||||
| 2025 | 2024 | 2023 | ||||||||||
| Cash flows from operating activities | ||||||||||||
| Net loss | $ | ( | ) | $ | ( | ) | $ | ( | ) | |||
| Adjustments to reconcile net loss to net cash used in operations: | ||||||||||||
| Depreciation and amortization | ||||||||||||
| Bargain purchase gain, net of tax | ( | ) | ||||||||||
| Loss (gain) on disposal of fixed assets | ( | ) | ||||||||||
| Unrealized (gain) loss on derivative liability | ( | ) | ||||||||||
| Unrealized gain on warrant liability | ( | ) | ||||||||||
| Loss on debt extinguishment | ||||||||||||
| Impairment of intangible assets | ||||||||||||
| Impairment of operating lease right-of-use assets | ||||||||||||
| Impairment of property and equipment | ||||||||||||
| Inventory write-downs | ||||||||||||
| Non-cash interest expense | ||||||||||||
| Amortization of debt discount and issuance costs on notes payable | ||||||||||||
| Share-based compensation expense | ||||||||||||
| Net accretion of premium on short-term investments | ( | ) | ( | ) | ( | ) | ||||||
| Change in: | ||||||||||||
| Accounts receivable | ( | ) | ||||||||||
| Inventory | ( | ) | ( | ) | ( | ) | ||||||
| Other current and non-current assets | ( | ) | ||||||||||
| Accounts payable | ( | ) | ||||||||||
| Accrued liabilities | ( | ) | ||||||||||
| Contract liabilities and other current liabilities | ( | ) | ( | ) | ( | ) | ||||||
| Operating lease liabilities | ( | ) | ( | ) | ( | ) | ||||||
| Other long-term liabilities | ( | ) | ||||||||||
| Net cash used in operating activities | ( | ) | ( | ) | ( | ) | ||||||
| Cash flows from investing activities | ||||||||||||
| Sales of investment securities | ||||||||||||
| Purchases of investment securities | ( | ) | ( | ) | ( | ) | ||||||
| Advance to Scantinel | ( | ) | ||||||||||
| Cash paid for Ibeo business combination | ( | ) | ( | ) | ||||||||
| Purchases of property and equipment | ( | ) | ( | ) | ( | ) | ||||||
| Net cash provided by (used in) investing activities | ( | ) | ||||||||||
| Cash flows from financing activities | ||||||||||||
| Principal payments under finance leases | ( | ) | ( | ) | ||||||||
| Principal payments under notes payable | ( | ) | ||||||||||
| Principal proceeds from notes payable, net of debt discount and issuance costs | ||||||||||||
| Proceeds from stock option exercises | ||||||||||||
| Net proceeds from issuance of common stock and warrants | ||||||||||||
| Net cash provided by financing activities | ||||||||||||
| Effect of exchange rate changes on cash and cash equivalents and restricted cash | ( | ) | ||||||||||
| Change in cash, cash equivalents, and restricted cash | ( | ) | ||||||||||
| Cash, cash equivalents, and restricted cash at beginning of period | ||||||||||||
| Cash, cash equivalents, and restricted cash at end of period | $ | $ | $ | |||||||||
| Supplemental schedule of non-cash investing and financing activities | ||||||||||||
| Common stock issued in conversion of note payable | $ | $ | $ | |||||||||
| Issuance of warrants | $ | $ | $ | |||||||||
| Amounts issued to escrow for acquisition consideration | $ | $ | $ | |||||||||
| Acquisition of right-of-use asset | $ | $ | $ | |||||||||
| Accrued financing fees | $ | $ | $ | ( | ) | |||||||
| Foreign currency translation adjustments | $ | $ | ( | ) | $ | |||||||
| Unrealized (loss) gain on investment securities, available-for-sale | $ | ( | ) | $ | $ | |||||||
The following table provides a reconciliation of the cash, cash equivalents, and restricted cash balances as of December 31, 2025, 2024 and 2023:
| Year Ended December 31, | ||||||||||||
| 2025 | 2024 | 2023 | ||||||||||
| Cash and cash equivalents | $ | $ | $ | |||||||||
| Restricted cash, current | ||||||||||||
| Restricted cash, net of current portion | ||||||||||||
| Cash, cash equivalents and restricted cash | $ | $ | $ | |||||||||
The accompanying notes are an integral part of these consolidated financial statements.
| 40 |
MicroVision, Inc.
Notes to Consolidated Financial Statements
1. DESCRIPTION OF BUSINESS
MicroVision, Inc. is defining the next generation of lidar-based perception solutions for automotive, industrial, and security & defense markets. The Company delivers integrated hardware and software solutions designed for real-world performance, automotive-grade reliability, and economic scalability. The Company’s diverse portfolio of lidar sensors, with both short- and long-range lidar solutions, feature solid-state sensors with varying wavelengths, advanced sensor architectures, design-to-cost engineering, and open software solutions.
The Company’s solutions enable advanced driver assistance systems, or ADAS, and autonomy features for customers in a wide range of markets, including automotive, industrial, and security & defense. Target industrial sectors include robotics, automated warehouse, agriculture, and mining. The Company’s integrated hardware and software solutions enable intelligent autonomous, active safety, and automation systems which depend on secure, cost-effective, and energy-efficient solutions. Software has been developed in close collaboration with automotive customers and also has broad application in industrial, defense, and commercial vehicle sectors.
With engineering teams in the U.S. and Germany, the Company develops and supplies integrated solutions, incorporating application software and processing data from differentiated sensor systems. The Company’s extensive experience in developing and productizing core lidar hardware and software components, along with expertise in edge computing, positions the Company as a valuable commercial partner capable of delivering high-value, low-power products.
Liquidity
The Company has incurred significant losses since inception. Operations to date have been funded primarily through the sale of common stock, convertible preferred stock, warrants, the issuance of convertible debt and, to a lesser extent, from development contract revenues, product sales, and licensing activities.
As
of December 31, 2025, the Company had total liquidity of $
Based on the current operating plan, the Company anticipates having sufficient cash and cash equivalents to fund operations for at least the next 12 months from the issuance of these consolidated financial statements.
2. SUMMARY OF SIGNIFICANT ACCOUNTING POLICIES
Principles of Consolidation
The consolidated financial statements and accompanying notes include the accounts of the Company and its wholly owned subsidiaries, after elimination of all intercompany balances and transactions. Certain reclassifications have been made to prior year financial statements to conform to classifications used in the current year. These reclassifications had no impact on net loss, shareholders’ equity or cash flows, as previously reported.
Use of Estimates
The preparation of financial statements in conformity with accounting principles generally accepted in the United States (“U.S. GAAP”) requires the Company to make estimates and assumptions that affect the reported amounts therein. The most significant estimates and assumptions relate to business combinations, valuation of intangibles, valuation of derivative liabilities, revenue recognition, inventory valuation, valuation of share-based payments, income taxes, depreciable lives assessment and related disclosure of contingent assets and liabilities. Due to the inherent uncertainty involved, actual results reported in future periods could differ from those estimates.
| 41 |
Foreign Currency Translation
Foreign currency transaction gains and losses are a result of the effect of exchange rate changes on transactions denominated in currencies other than the functional currency. Realized gains and losses on those foreign currency transactions are included in determining net loss for the period of exchange and are recorded in other income in the consolidated statements of operations.
Segment Information
The
Company determines operating segments based on how the chief operating decision maker (“CODM”) manages the business,
makes operating decisions around the allocation of resources, and evaluates operating performance. The CODM is the Chief Executive Officer. The Company has determined that it operates in
Business Combination
Business combinations are accounted for under the acquisition method. As such, the fair value of the Ibeo purchase consideration was allocated to the tangible and intangible assets acquired and liabilities assumed based on their estimated fair values at the acquisition date. The excess of the fair value of the underlying net assets acquired and liabilities assumed over the purchase consideration was included in bargain purchase gain, net of tax in the consolidated statements of operations. Such valuations require management to make significant estimates and assumptions, especially with respect to intangible assets.
Cash and Cash Equivalents and Fair Value of Financial Instruments
Fair value is defined as the exchange price that would be received for an asset or paid to transfer a liability in an orderly transaction between market participants. As such, fair value is a market-based measurement that should be determined based on assumptions that market participants would use in pricing an asset or liability. As a basis for considering such assumptions, the authoritative guidance establishes a three level fair value inputs hierarchy and requires an entity to maximize the use of observable valuation inputs and minimize the use of unobservable inputs. The Company uses market data, assumptions and risks that market participants would use in measuring the fair value of the asset or liability, including the risks inherent in the inputs and the valuation techniques.
Financial instruments include cash and cash equivalents, investment securities, accounts receivable, accounts payable and accrued liabilities. The carrying value of financial instruments approximate fair value due to their short maturities. Cash equivalents are comprised of short-term highly rated (A rated securities and above) money market savings accounts.
Short-term investment securities primarily consist of debt securities. The Company has classified its entire investment portfolio as available-for-sale. Available-for-sale securities are stated at fair value with unrealized gains and losses included in other comprehensive income (loss). Dividend and interest income are recognized when earned. Realized gains and losses, if any, are presented separately on the income statement.
Restricted Cash
Restricted
cash is held in money market savings accounts and serves as collateral for irrevocable letters of credit related to our facility lease
agreements. The restricted cash balance as of December 31, 2025 includes $
Inventory
Inventory consists of raw materials, work in process and finished goods assemblies. Inventory is computed using the first-in, first-out (FIFO) method and is stated at the lower of cost and net realizable value. Management periodically assesses the need to account for obsolescence of inventory and adjusts the carrying value of inventory to its net realizable value when required.
| 42 |
Intangible Assets
Intangible
assets consist of acquired technology from the January 2023 Ibeo asset purchase and purchased patents. As part of the Ibeo asset acquisition,
two intangible assets were primarily acquired in the form of Perception software and Reference software, with initial useful lives of
Property and Equipment
Property
and equipment are stated at cost and depreciated over the estimated useful lives of the assets (two
to
Leases
Management assesses all contracts executed to determine whether the agreements contain a lease component. Significant judgment may be required to determine whether a contract contains a lease, the length of the lease term, the allocation of the consideration between lease and non-lease components, and the appropriate discount rate to be applied. Management reviews the underlying objective of each contract, the terms of the contract, and considers current and future business conditions when making these judgments.
The Company’s lease obligations consist of various office and equipment operating leases. Operating lease assets are recorded under the operating lease right-of-use asset (“ROU”) line item, while liabilities are recorded under the current portion of operating lease liability and operating lease liability, net of current portion line items on the consolidated balance sheets.
Operating lease ROU assets and liabilities are recognized upon lease commencement based on the present value of payments over the lease term. For leases which do not provide an implicit rate, the Company’s incremental borrowing rate as of the commencement date serves as the discount rate to determine the present value of lease payments. Lease expense from operating leases is recognized on a straight-line basis over the lease term.
Notes Payable
The Company evaluates all conversion, redemption, and put features contained in its debt instruments to determine if there are any embedded features that require bifurcation as a derivative. The Company accounts for debt as a long-term liability, with the current portion classified as a short-term liability, equal to the amount repayable at maturity, net of any debt discount and issuance costs, within notes payable on the consolidated balance sheets. The debt discount and issuance costs are amortized over the term of the Note, using the effective interest method, as interest expense in the accompanying consolidated statements of operations. Conversions of principal are accounted for in accordance with ASC 470-20, “Debt with Conversion and Other Options,” with immediate expense of the unamortized discount associated with the converted principal.
Derivative Liability
The Company evaluates its financial instruments to determine if such instruments are derivatives or contain features that qualify as embedded derivatives in accordance with ASC 815, “Derivatives and Hedging”. For derivative financial instruments that are accounted for as liabilities, the derivative instrument is initially recorded at its fair value on the issuance date and is then re-valued at each reporting date, with changes in the fair value reported as an unrealized gain or loss in earnings on the consolidated statements of operations. The Company has elected to classify the entirety of its derivatives in current liabilities.
| 43 |
Warrant Liability
The Company accounts for warrants as either equity-classified or liability-classified instruments based on an assessment of the warrant’s specific terms and applicable authoritative guidance included in ASC 480, “Distinguishing Liabilities from Equity”, and ASC 815. The assessment considers whether the warrants are freestanding financial instruments pursuant to ASC 480, whether the warrants meet the definition of a liability pursuant to ASC 480, and whether the warrants meet all of the requirements for equity classification under ASC 815. This assessment, which requires the use of professional judgment, is conducted at the time of warrant issuance and as of each subsequent reporting period end date while the warrants are outstanding.
Warrants that meet all of the criteria for equity classification are required to be recorded as a component of additional paid-in capital at the time of issuance, or when the conditions for equity classification are met, and are not remeasured. Warrants that do not meet the required criteria for equity classification are classified as liabilities. The Company adjusts such warrants to fair value at each reporting period until the warrants are exercised or expire. Changes in fair value are recognized in the Company’s consolidated statements of operations.
Revenue Recognition
The following is a description of principal activities from which the Company generates revenue. Revenues are recognized when control of the promised goods or services are transferred to customers, in an amount that reflects the consideration that the Company expects to receive in exchange for those goods or services.
The Company evaluates contracts based on the 5-step model as stated in Topic 606 as follows: (i) identify the contract, (ii) identify the performance obligations, (iii) determine the transaction price, (iv) allocate the transaction price, and (v) recognize revenue when (or as) performance obligations are satisfied.
A contract contains a promise (or promises) to transfer goods or services to a customer. A performance obligation is a promise (or a group of promises) that is distinct, as defined in the revenue standard.
The transaction price is the amount of consideration an entity expects to be entitled to from a customer in exchange for providing the goods or services. A number of factors should be considered to determine the transaction price, including whether there is variable consideration, a significant financing component, noncash consideration, or amounts payable to the customer. The determination of variable consideration will require a significant amount of judgment. In estimating the transaction price, the Company will use either the expected value method or the most likely amount method.
The transaction price is allocated to the separate performance obligations in the contract based on relative standalone selling prices. Determining the relative standalone selling price can be challenging when goods or services are not sold on a standalone basis. The revenue standard sets out several methods that can be used to estimate a standalone selling price when one is not directly observable. Allocating discounts and variable consideration must also be considered. Allocating the transaction price can require significant judgement on the Company’s part.
Revenue is recognized when (or as) the customer obtains control of the good or service/performance obligations are satisfied. Topic 606 provides guidance to help determine if a performance obligation is satisfied at a point in time or over time. Where a performance obligation is satisfied over time, the related revenue is also recognized over time.
Product Revenue
Product revenue is primarily derived from sales of lidar hardware and systems. While each contract is individually assessed to identify separate performance obligations, a performance obligation generally consists of an individual sensor or sensor system, inclusive of all materials and integrated software. Transaction prices are normally fixed, as the Company does not include variable consideration or the exchange of any other goods as part of the contract. Revenue is recognized upon shipment of the product to the customer, as control and title of the product passes to the customer at the point of shipment. Product sales generally include acceptance provisions, however, as it can be objectively determined that agreed-upon customer specifications have been met prior to shipment, control of the item passes at the time of shipment.
| 44 |
License and Royalty Revenue
License and royalty revenue consists of revenue from the licensing of various software and intellectual property owned by MicroVision, and any royalties generated from their use in products sold by customers.
Software licenses sold are either a license to install and use, whether perpetual or fixed-term, or a license to access the software, which is normally a volume-based license. Revenue from licenses to install is recognized at the point when the customer is granted the ability to install the software, as these licenses represent functional intellectual property with significant standalone functionality. Revenue from licenses to access is recognized over the period of time in which the Company has ongoing obligations under the agreement, as these licenses represent symbolic intellectual property, which exclude significant standalone functionality. Revenue recognized each period is based on the appropriate measure of progress, typically being the number of usage hours consumed.
Revenue from sales-based royalties is recognized based on reports provided by customers which identify the number of royalty-bearing products sold or otherwise distributed. For any customers that fail to provide timely reports, management estimates the number of royalty-bearing products sold based on historical sales volume and available forecast data.
Contract Revenue
Contract revenue in a particular period is dependent upon when the contract is entered into, the value of the contract, and the availability of technical resources to perform work on the contract. Each performance obligation associated with development contracts is identified at contract inception. The contracts generally include product development and customization specified by the customer. For contracts with multiple product development or customization components, each component is evaluated to determine whether it is distinct within the context of the contract and represents a standalone performance obligation. Components which are deemed not distinct at contract inception are combined into a single performance obligation.
Development contracts are primarily fixed-fee contracts. Contract revenue is recognized either at a point in time, or over time, depending upon the characteristics of the individual contract. If control of the deliverable(s) passes to the customer over time, the revenue is recognized in proportion to the transfer of control. If control passes to the customer only upon completion and transfer of the asset, revenue is recognized upon completion of the contract. For contracts which include significant customer acceptance provisions, revenue is recognized only upon acceptance of the deliverable(s).
If control of deliverables passes to the customer over time, revenue is recognized based on the proportion of total cost expended to the total cost expected to complete the contract performance obligation (defined as the ‘input method’ under Topic 606). For contracts which require the input method of revenue recognition, the determination of the total cost expected to complete the performance obligation(s) involves significant judgment. Management initially estimates the resources required to complete each relevant performance obligation, and incorporates revisions to hour and cost estimates throughout the course of the contract as necessary.
Cost of Product Revenue
Cost of product revenue includes the direct and allocated indirect costs of products sold to customers. Direct costs include labor, materials, reserves for estimated warranty expenses, and other costs incurred directly, or charged by contract manufacturers in the manufacture of these products. Indirect costs include labor, manufacturing overhead, and other costs associated with manufacturing activities. Manufacturing overhead includes the costs of procuring, inspecting and storing material, facility and other costs, and is allocated to cost of product revenue based on the proportion of indirect labor which supported production activities. The cost of product revenue can fluctuate significantly from period to period, depending on product mix and volume, the level of manufacturing overhead expense and the volume of direct material purchased.
| 45 |
Cost of Contract Revenue
Cost of contract revenue includes both direct and allocated indirect costs of performing work on contracts and producing prototype units and evaluation kits. Direct costs include labor, materials and other costs incurred directly in producing prototype units and evaluation kits or performing work on a contract. Indirect costs include labor and other costs associated with research and development and building technical capabilities and capacity. Cost of contract revenue is determined by the level of direct and indirect costs incurred, which can fluctuate substantially from period to period.
Manufacturing overhead, which includes the costs of procuring, inspecting and storing material, and facility and depreciation costs, is allocated to inventory, cost of product revenue, cost of contract revenue, and research and development expense based on the level of effort supporting production or research and development activity.
Concentration of Credit Risk
Financial instruments that potentially subject the Company to a concentration of credit risk are primarily cash, cash equivalents, and investment securities. As of December 31, 2025, cash and cash equivalents are comprised of operating checking accounts and short-term highly rated money market savings accounts. Short-term investments are comprised of highly rated corporate bonds and U.S. Treasury securities.
For
the year ended December 31, 2025, four customers accounted for
Typically, a significant concentration of components and the products sold are manufactured and obtained from single or limited-source suppliers. The loss of any single or limited-source supplier, the failure of any of these suppliers to perform as expected, or the disruption in the supply chain of components from these suppliers could subject the Company to risks and uncertainties including, but not limited to, increased cost of sales, possible loss of revenues, or significant delays in product development or product deliveries, any of which could adversely affect the Company’s financial condition and operating results.
Income Taxes
Deferred tax assets and liabilities are recorded for differences between the financial statement and tax bases of the assets and liabilities that will result in taxable or deductible amounts in the future, based on enacted tax laws and rates applicable to the periods in which the differences are expected to affect taxable income. Valuation allowances are established when necessary to reduce deferred tax assets to the amount expected to be realized. Income tax expense is recorded for the amount of income tax payable for the period increased or decreased by the change in deferred tax assets and liabilities during the period.
Research and Development
Research and development expense consists of labor and subcontractor costs for internal research and product development activities, direct material to support development programs, laboratory operations, outsourced development and processing work, and other operating expenses. Research and development resources are assigned based on the business opportunity of the available projects, the skill mix of the resources available and the contractual commitments have been made to customers. Research and development costs are expensed as incurred. It is highly likely that a substantial level of continuing research and development expense will be required for the Company to further develop its technology.
The Company issues share-based compensation to employees in the form of restricted stock units (RSUs), performance stock units (PSUs), and stock options. Share-based awards are accounted for by recognizing the fair value of share-based compensation expense on a straight-line basis over the service period of the award, net of estimated forfeitures. The fair value of RSUs and PSUs is determined by the closing price of common stock on the date of grant. The fair value of stock options is estimated on the grant date using the Black-Scholes option pricing model. Changes in estimated inputs or using other option valuation methods may result in materially different option values and share-based compensation expense.
| 46 |
Recently Adopted Accounting Pronouncements
In November 2023, the Financial Accounting Standards Board (“FASB”) issued Accounting Standards Update (“ASU”) 2023-07, Segment Reporting (Topic 280): Improvements to Reportable Segment Disclosures. The amendments in this update expand annual and interim disclosure requirements for reportable segments, primarily through enhanced disclosures about significant segment expenses. All disclosure requirements under this standard will also be required for public entities with a single reportable segment. The Company adopted ASU 2023-07 during the year ended December 31, 2024.
In March 2024, the FASB issued ASU No. 2024-01, Compensation: Stock Compensation (Topic 718). The amendments in this ASU clarify existing guidance related to profits interest and similar awards. ASU 2024-01 was adopted by the Company beginning January 1, 2025. The adoption of the new standard did not have a material impact on the Company’s consolidated financial statements.
In December 2023, the FASB issued ASU 2023-09, Income Taxes (Topic 740): Improvements to Income Tax Disclosures. The amendments in this update require disaggregated information about a reporting entity’s effective tax rate reconciliation as well as information on income taxes paid. The Company retrospectively adopted ASU 2023-09 during the year ended December 31, 2025. The adoption of the new standard did not have a material impact on the Company’s consolidated financial statements. See Note 14. Income Taxes for enhanced disclosures pursuant to the standard.
Recently Issued Accounting Pronouncements
In November 2024, the FASB issued ASU No. 2024-03, Income Statement—Reporting Comprehensive Income—Expense Disaggregation Disclosures (Subtopic 220-40). The amendments in this ASU require additional disclosure of specified information about certain costs and expenses in the notes to the financial statements. ASU 2024-03 is effective for annual periods for the Company beginning January 1, 2027, with early adoption permitted. The Company is currently evaluating the impact this ASU may have on its financial statement disclosures.
In November 2024, the FASB issued ASU No. 2024-04, Debt—Debt with Conversion and Other Options (Subtopic 470-20). The amendments in this ASU clarify the requirements for determining whether certain settlements of convertible debt instruments should be accounted for as an induced conversion. The amendments in this Update are effective for all entities for annual reporting periods beginning January 1, 2026, and interim reporting periods within those annual reporting periods. Early adoption is permitted for all entities that have adopted the amendments in Update 2020-06. The ASU is not expected to have a material impact on the Company’s financial statements or disclosures.
Basic net loss per share is calculated using the weighted-average number of common shares outstanding during the period. Diluted net loss per share is calculated using the weighted-average number of common shares outstanding and the dilutive effect of all potentially dilutive securities, including common stock equivalents and convertible securities. As the effect of dilutive securities outstanding during the period is anti-dilutive, diluted net loss per share is equal to basic net loss per share.
| Year Ended December 31, | ||||||||||||
| 2025 | 2024 | 2023 | ||||||||||
| Numerator: | ||||||||||||
| Net loss available for common shareholders - basic and diluted | $ | ( | ) | $ | ( | ) | $ | ( | ) | |||
| Denominator: | ||||||||||||
| Weighted-average common shares outstanding - basic and diluted | ||||||||||||
| Net loss per share - basic and diluted | $ | ) | $ | ) | $ | ) | ||||||
| 47 |
| December 31, | ||||||||||||
| (in millions) | 2025 | 2024 | 2023 | |||||||||
| Outstanding options exercisable | ||||||||||||
| Nonvested restricted and performance stock units | ||||||||||||
| Shares of common stock that may be issued through conversion of the derivative liability | ||||||||||||
| Shares of common stock that may be issued through the exercise of warrants | ||||||||||||
4. BUSINESS COMBINATION
On January 31, 2023, the Company completed the acquisition of certain net assets of Ibeo, a lidar hardware and software provider based in Hamburg, Germany. The purpose of the acquisition was to acquire certain Ibeo assets, primarily intellectual property and personnel, which enabled the Company to expand their technology and product portfolio and diversify revenue streams.
Total
consideration related to this transaction was approximately EUR
The transaction was accounted for as a business combination. The results of operations for the acquisition are included in the consolidated financial statements from the date of acquisition onwards.
The following table summarizes the final purchase price allocation to assets acquired and liabilities assumed (in thousands):
| Amount | Weighted Average Useful Life (in years) | |||||||
| Total purchase consideration | $ | |||||||
| Inventory | $ | |||||||
| Other current assets | ||||||||
| Operating lease right-of-use assets | ||||||||
| Property and equipment, net | ||||||||
| Intangible assets: | ||||||||
| Acquired technology(1) | ||||||||
| Order backlog | ||||||||
| Contract liabilities | ( | ) | ||||||
| Operating lease liabilities | ( | ) | ||||||
| Deferred tax liabilities | ( | ) | ||||||
| Total identifiable net assets | $ | |||||||
| Bargain purchase gain(2) | ( | ) | ||||||
| (1) | ||
| (2) |
| 48 |
The estimated fair value of acquired technology was calculated through the income approach using the multi-period excess earnings and relief from royalty methodologies. The estimated fair value of the order backlog was calculated through the income approach using the multi-period excess earnings methodology.
Revenue
and net income from the acquisition included in the consolidated statement of operations from the acquisition date through December 31,
2023 is $
5. REVENUE RECOGNITION
Disaggregation of Revenue
The following table provides information about disaggregated revenue by timing of revenue recognition (in thousands):
| Year Ended December 31, 2025 | ||||||||||||||||
| License and | ||||||||||||||||
| Product | Royalty | Contract | ||||||||||||||
| Revenue | Revenue | Revenue | Total | |||||||||||||
| Timing of revenue recognition: | ||||||||||||||||
| Products and services transferred at a point in time | $ | $ | $ | $ | ||||||||||||
| Products and services transferred over time | ||||||||||||||||
| Total | $ | $ | $ | $ | ||||||||||||
| Year Ended December 31, 2024 | ||||||||||||||||
| License and | ||||||||||||||||
| Product | Royalty | Contract | ||||||||||||||
| Revenue | Revenue | Revenue | Total | |||||||||||||
| Timing of revenue recognition: | ||||||||||||||||
| Products and services transferred at a point in time | $ | $ | $ | $ | ||||||||||||
| Products and services transferred over time | ||||||||||||||||
| Total | $ | $ | $ | $ | ||||||||||||
| Year Ended December 31, 2023 | ||||||||||||||||
| License and | ||||||||||||||||
| Product | Royalty | Contract | ||||||||||||||
| Revenue | Revenue | Revenue | Total | |||||||||||||
| Timing of revenue recognition: | ||||||||||||||||
| Products and services transferred at a point in time | $ | $ | $ | $ | ||||||||||||
| Products and services transferred over time | ||||||||||||||||
| Total | $ | $ | $ | $ | ||||||||||||
The following table provides information about revenue and long-lived assets, which is comprised of property and equipment, net, and operating lease right-of-use assets, by geographic area (in thousands):
| December 31, | December 31, | December 31, | ||||||||||||||||||||||
| 2025 | 2024 | 2023 | ||||||||||||||||||||||
| Geographic Area | Revenue | Long-Lived Assets | Revenue | Long-Lived Assets | Revenue | Long-Lived Assets | ||||||||||||||||||
| United States | $ | $ | $ | $ | $ | $ | ||||||||||||||||||
| Germany | ||||||||||||||||||||||||
| Other foreign countries | ||||||||||||||||||||||||
| Total | $ | $ | $ | $ | $ | $ | ||||||||||||||||||
| 49 |
Contract Balances
Under Topic 606, the Company’s rights to consideration are presented separately depending on whether those rights are conditional or unconditional. Unconditional rights to consideration are included within accounts receivable, net of allowances in the consolidated balance sheets.
Significant changes in the contract assets and the contract liabilities balances during the period are as follows (in thousands, except percentages):
| December 31, | December 31, | |||||||||||||||
| 2025 | 2024 | $ Change | % Change | |||||||||||||
| Contract assets and accounts receivable | $ | | $ | $ | ( | ) | ( | ) | ||||||||
| Contract liabilities | ( | ) | ||||||||||||||
| Net contract assets (liabilities) | $ | $ | $ | ( | ) | ( | ) | |||||||||
Contract Acquisition Costs
The Company is required to capitalize certain contract acquisition costs consisting primarily of commissions paid when contracts are signed. As the Company currently does not pay any commissions upon the signing of a contract, no commission cost has been incurred as of December 31, 2025.
6. INVESTMENT SECURITIES, AVAILABLE-FOR-SALE AND FAIR VALUE MEASUREMENTS
Investment securities, available-for-sale is comprised of corporate and government debt securities. The principal markets for the debt securities are dealer markets which have a high level of price transparency. The market participants for debt securities are typically large money center banks and regional banks, brokers, dealers, pension funds, and other entities with debt investment portfolios.
Fair value is defined as the exchange price that would be received for an asset or paid to transfer a liability in an orderly transaction between market participants. As such, fair value is a market-based measurement that should be determined based on assumptions that market participants would use in pricing an asset or liability. As a basis for considering such assumptions, the authoritative guidance establishes a three level fair value inputs hierarchy and requires an entity to maximize the use of observable valuation inputs and minimize the use of unobservable inputs. The Company uses market data, assumptions, and risks that market participants would use in measuring the fair value of the asset or liability, including the risks inherent in the inputs and the valuation techniques. The hierarchy is summarized below.
Level 1 - Quoted prices in active markets for identical assets and liabilities at the measurement date that the reporting entity has the ability to access.
Level 2 - Observable inputs other than quoted prices included in Level 1, such as quoted prices for similar assets and liabilities in active markets; quoted prices for identical or similar assets and liabilities in markets that are not active; or other inputs that are observable or can be corroborated by observable market data.
Level 3 - Unobservable inputs for which there is little or no market data, which requires us to develop our own assumptions, which are significant to the measurement of the fair values.
| 50 |
The valuation inputs hierarchy classification for assets measured at fair value on a recurring basis are summarized below as of December 31, 2025 and 2024 (in thousands). These tables do not include cash held in money market savings accounts.
| As of December 31, 2025 | Level 1 | Level 2 | Level 3 | Total | ||||||||||||
| Investment securities, available for sale: | ||||||||||||||||
| Corporate debt securities | $ | $ | $ | $ | ||||||||||||
| U.S. Treasury securities | ||||||||||||||||
| $ | $ | $ | $ | |||||||||||||
| As of December 31, 2024 | Level 1 | Level 2 | Level 3 | Total | ||||||||||||
| Investment securities, available for sale: | ||||||||||||||||
| Corporate debt securities | $ | $ | $ | $ | ||||||||||||
| U.S. Treasury securities | ||||||||||||||||
| $ | $ | $ | $ | |||||||||||||
Short-term investments are summarized below as of December 31, 2025 and 2024 (in thousands).
| Investment | ||||||||||||||||
| Cost/ | Gross | Gross | Securities, | |||||||||||||
| Amortized | Unrealized | Unrealized | Available- | |||||||||||||
| Cost | Gains | Losses | For-Sale | |||||||||||||
| As of December 31, 2025 | ||||||||||||||||
| Investment securities, available for sale: | ||||||||||||||||
| Corporate debt securities | $ | $ | $ | $ | ||||||||||||
| U.S. Treasury securities | ||||||||||||||||
| $ | $ | $ | $ | |||||||||||||
| As of December 31, 2024 | ||||||||||||||||
| Investment securities, available for sale: | ||||||||||||||||
| Corporate debt securities | $ | $ | $ | $ | ||||||||||||
| U.S. Treasury securities | ||||||||||||||||
| $ | $ | $ | $ | |||||||||||||
The maturities of the investment securities, available-for-sale as of December 31, 2025 and 2024 are shown below (in thousands):
| Gross | Gross | |||||||||||||||
| Amortized | Unrealized | Unrealized | Estimated | |||||||||||||
| Cost | Gains | Losses | Fair Value | |||||||||||||
| As of December 31, 2025 | ||||||||||||||||
| Maturity date | ||||||||||||||||
| Less than one year | $ | $ | $ | $ | ||||||||||||
| As of December 31, 2024 | ||||||||||||||||
| Maturity date | ||||||||||||||||
| Less than one year | $ | $ | $ | $ | ||||||||||||
| 51 |
The following table summarizes investments that have been in a continuous unrealized loss position for less than 12 months and those that have been in a continuous unrealized loss position for more than 12 months as of December 31, 2025 and 2024 (in thousands):
| Less than Twelve Months | Twelve Months or Greater | Total | ||||||||||||||||||||||
| Gross | Gross | Gross | ||||||||||||||||||||||
| Fair | Unrealized | Fair | Unrealized | Fair | Unrealized | |||||||||||||||||||
| Value | Losses | Value | Losses | Value | Losses | |||||||||||||||||||
| As of December 31, 2025 | ||||||||||||||||||||||||
| Corporate debt securities | $ | $ | $ | $ | $ | $ | ||||||||||||||||||
| U.S. Treasury securities | ||||||||||||||||||||||||
| $ | $ | $ | $ | $ | $ | |||||||||||||||||||
| As of December 31, 2024 | ||||||||||||||||||||||||
| Corporate debt securities | $ | $ | $ | $ | $ | $ | ||||||||||||||||||
| U.S. Treasury securities | ||||||||||||||||||||||||
| $ | $ | $ | $ | $ | $ | |||||||||||||||||||
7. NOTES PAYABLE AND DERIVATIVE LIABILITY
Background
On
October 14, 2024, the Company entered into a Securities Purchase Agreement (the “Purchase Agreement”) for the purchase of
senior secured convertible notes (the “Note”) with an institutional investor (the “Holder”). The principal amount
for the initial note is $
The
Note will rank senior to any outstanding and future indebtedness of the Company. Beginning on January 1, 2025, the Holder may elect to
require the Company to partially repay the Notes up to $
Additionally,
the Company has the option to require the Holder to convert the entire Note to shares of common stock if the share price exceeds $
on each of 20 consecutive VWAP Trading Days, subject to certain other equity conditions. If not fully repaid or converted, the end of
term maturity balance is the outstanding principal balance of the Note multiplied by
On
October 23, 2024, the Purchase Agreement closed and the Note was issued for net proceeds of approximately $
On
December 30, 2024, pursuant to the terms of the Note, the Holder elected to convert $
On
February 3, 2025, the Company entered into a Letter Agreement with the Holder related to the Note. As a result of the Letter Agreement,
the Holder elected to early convert $
On
September 2, 2025, October 1, 2025, and November 3, 2025 the Company repaid $
As
of December 31, 2025, $
| 52 |
Components
The Note is a convertible debt instrument with multiple redemption, conversion, and put features. Certain features qualify as embedded derivatives requiring bifurcation. Therefore, the bifurcated features are accounted for separately as a compound embedded derivative in accordance ASC 815, “Derivatives and Hedging” and are included in the derivative liability on the consolidated balance sheets. The host contract, which represents the Note excluding the derivative liability, is accounted for as non-convertible debt under ASC 470, “Debt” and is included in notes payable, current and notes payable, net of current portion on the consolidated balance sheets.
Notes Payable
Subsequent
to the modification, the host contract is recorded at the total amount repayable at maturity of $
Supplemental balance sheet information is as follows:
| December 31, | ||||||||
| (in thousands) | 2025 | 2024 | ||||||
| Amount repayable at maturity | $ | $ | ||||||
| Unamortized debt discount | ( | ) | ( | ) | ||||
| Unamortized issuance costs | ( | ) | ||||||
| Net carrying amount | $ | $ | ||||||
Interest
expense related to the amortization of the debt discount and issuance costs for the years ended December 31, 2025, 2024, and 2023 was
$
| Year Ended December 31, | ||||||||||||
| (in thousands) | 2025 | 2024 | 2023 | |||||||||
| Amortization of debt discount and issuance costs | $ | ( | ) | $ | ( | ) | $ | |||||
| Interest expense from modification of notes payable | ( | ) | ||||||||||
| Discount on warrants (see Note 8. Warrant Liability) | ( | ) | ||||||||||
| Other interest expense | ( | ) | ( | ) | ( | ) | ||||||
| Total interest expense | $ | ( | ) | $ | ( | ) | $ | ( | ) | |||
The
monthly effective interest rate implicit in the Note as of December 31, 2025 under the interest method was
Derivative Liability
The
derivative liability was initially recorded at its fair value of $
The fair value of derivatives not designated as hedging instruments are as follows:
| December 31, | ||||||||
| (in thousands) | 2025 | 2024 | ||||||
| Derivative liability | $ | $ | ||||||
| Total | $ | $ | ||||||
| 53 |
Unrealized gains and losses associated with derivatives not designated as hedging instruments are as follows:
| Year Ended December 31, | ||||||||||||
| (in thousands) | 2025 | 2024 | 2023 | |||||||||
| Unrealized gain (loss) on derivative liability | $ | $ | ( | ) | $ | |||||||
| Total | $ | $ | ( | ) | $ | |||||||
Fair Value Measurements
The fair value of the derivative liability is determined utilizing a “with and without” method, in which the fair value is calculated as the difference in the fair value of the entire hybrid instrument and the fair value of the instrument excluding the bifurcated derivative features.
The fair value of the hybrid instrument is estimated using a binomial lattice model, which projects future movements of the underlying instrument over the remaining term. The model then calculates the fair value of the instrument by discounting projected cash flows based on the optimal action at each point in time. Optimal actions for both the Company and the Holder are determined by the projected stock price at a point in time, in addition to the probabilities of the occurrence of certain events. At initial measurement on October 23, 2024, a Monte Carlo simulation was further incorporated in order to simulate the Company’s share price as of the registration date, which occurred on November 21, 2024.
The fair value of the host contract excluding embedded derivative features is estimated using a debt discounted cash flow model, which assumes that the contract is a debt instrument with only the option to redeem partial principal payments prior to maturity. Projected cash flows are based on the assumption that the Holder will fully exercise early redemption options, based on the estimated internal rate of return for the Holder resulting from early redemption as compared to redemption at maturity. The debt discount rate is estimated based on the rate of similar non-convertible debt instruments reflecting the Company’s credit risk.
The valuation inputs hierarchy classification for liabilities measured at fair value on a recurring basis are summarized below as of December 31, 2025 and 2024 (in thousands). See Note 6. Investment Securities, Available-For-Sale and Fair Value Measurements for discussion of the fair value level hierarchy.
| As of December 31, 2025 | Level 1 | Level 2 | Level 3 | |||||||||
| Derivative liability | $ | $ | $ | |||||||||
| Total | $ | $ | $ | |||||||||
| As of December 31, 2024 | Level 1 | Level 2 | Level 3 | |||||||||
| Derivative liability | $ | $ | $ | |||||||||
| Total | $ | $ | $ | |||||||||
The table below lists the inputs and assumptions for the Company’s initial valuation as of December 31, 2024 and re-valuation of the derivative liability as of December 31, 2025:
| December 31, | December 31, | |||||||
| 2025 | 2024 | |||||||
| Expected term (years) | ||||||||
| Risk-free interest rate | % | % | ||||||
| Dividend yield | % | % | ||||||
| Volatility | % | % | ||||||
| Discount rate | % | % | ||||||
8. WARRANT LIABILITY
On
February 3, 2025, the Company entered into a new Securities Purchase Agreement (the “2025 Purchase Agreement”) with an institutional
investor. In exchange for $
| 54 |
The
warrants are accounted for as a liability under ASC 480, Distinguishing Liabilities from Equity. Both the closing shares and the warrants
are initially recorded on February 4, 2025 at their fair values of $ million and $
The fair value of warrants as of December 31, 2025 and 2024 are as follows:
| December 31, | ||||||||
| (in thousands) | 2025 | 2024 | ||||||
| Warrant liability | $ | $ | ||||||
| Total | $ | $ | ||||||
Unrealized gains and losses associated with warrants are as follows:
| Year Ended December 31, | ||||||||||||
| (in thousands) | 2025 | 2024 | 2023 | |||||||||
| Unrealized gain on warrant liability | $ | $ | $ | |||||||||
Interest
expense of $
The valuation inputs hierarchy classification for liabilities measured at fair value on a recurring basis are summarized below as of December 31, 2025 and 2024 (in thousands). See Note 6. Investment Securities, Available-For-Sale and Fair Value Measurements for discussion of the fair value level hierarchy.
| As of December 31, 2025 | Level 1 | Level 2 | Level 3 | |||||||||
| Warrant liability | $ | $ | $ | |||||||||
| Total | $ | $ | $ | |||||||||
| As of December 31, 2024 | Level 1 | Level 2 | Level 3 | |||||||||
| Warrant liability | $ | $ | $ | |||||||||
| Total | $ | $ | $ | |||||||||
The fair value of the warrants is measured using the Black-Scholes option pricing model as of the measurement dates. The table below lists the inputs and assumptions for the Company’s valuations as of December 31, 2025 and upon initial measurement as of February 4, 2025:
| December 31, | February 4, | |||||||
| 2025 | 2025 | |||||||
| Expected term (years) | ||||||||
| Risk-free interest rate | % | % | ||||||
| Dividend yield | % | % | ||||||
| Volatility | % | % | ||||||
9. FINANCIAL STATEMENT COMPONENTS
Inventory
Inventory consists of the following (in thousands):
| December 31, | ||||||||
| 2025 | 2024 | |||||||
| Raw materials | $ | $ | ||||||
| Work in process | ||||||||
| Finished goods | ||||||||
| $ | $ | |||||||
| 55 |
Inventory is computed using the first-in, first-out (FIFO) method and is stated at the lower of cost and net realizable value. Management periodically assesses the need to account for obsolescence of inventory and adjusts the carrying value of inventory to its net realizable value when required.
During
the year ended December 31, 2025, the Company recorded a $
Property and Equipment
Property and equipment consists of the following (in thousands):
| December 31, | ||||||||
| 2025 | 2024 | |||||||
| Production equipment | $ | $ | ||||||
| Leasehold improvements | ||||||||
| Computer hardware and software/lab equipment | ||||||||
| Office furniture and equipment | ||||||||
| Less: Accumulated depreciation | ( | ) | ( | ) | ||||
| $ | $ | |||||||
During
the year ended December 31, 2025, the Company abandoned $
Depreciation
expense was $
Intangible Assets
The components of intangible assets are as follows:
| As of December 31, 2025 | Gross Carrying | Accumulated | Impairment | Net Carrying | Weighted Average Remaining | |||||||||||||||
| (in thousands) | Amount | Amortization | Expense | Amount | Period (Years) | |||||||||||||||
| Acquired technology | $ | $ | | $ | $ | | ||||||||||||||
| Backlog | - | |||||||||||||||||||
| $ | $ | $ | $ | |||||||||||||||||
| As of December 31, 2024 | Gross Carrying | Accumulated | Impairment | Net Carrying | Weighted Average Remaining | |||||||||||||||
| (in thousands) | Amount | Amortization | Expense | Amount | Period (Years) | |||||||||||||||
| Acquired technology | $ | $ | $ | $ | ||||||||||||||||
| Backlog | - | |||||||||||||||||||
| $ | $ | $ | $ | |||||||||||||||||
Amortization
expense was $
During
the year ended December 31, 2025, management identified various factors that collectively indicated that it is more-likely-than-not
that the fair value of the Company’s perception software intangible asset was less than its carrying amount as of December 31,
2025. As a result, the Company performed an impairment assessment for intangibles in accordance with ASC 360, Property, Plant and
Equipment. The December 31, 2025 impairment test indicated that the carrying amount of the perception software intangible asset is
not recoverable, resulting in a non-cash impairment charge of $
During
the year ended December 31, 2024, management identified various factors related to the 2024 restructuring events (see Note 15. Restructuring
Charges) that collectively indicated that it is more-likely-than-not that the fair value of the Company’s reference software
intangible asset was less than it’s carrying amount as of December 31, 2024. Prior to impairment, the fair value was $
| 56 |
The following table outlines estimated future amortization expense related to intangible assets held as of December 31, 2025 (in thousands):
| Years Ended December 31, | Research and Development Expense | |||
| 2026 | $ | |||
| 2027 | ||||
| 2028 | ||||
| 2029 | ||||
| 2030 | ||||
| Thereafter | ||||
| $ | ||||
Accrued Liabilities
Accrued liabilities consists of the following (in thousands):
| December 31, | ||||||||
| 2025 | 2024 | |||||||
| Bonuses | $ | $ | ||||||
| Payroll and payroll taxes | ||||||||
| Income taxes payable | ||||||||
| Accrued professional fees | ||||||||
| Liabilities to suppliers | ||||||||
| Adverse purchase commitment | ||||||||
| Other | ( | ) | ||||||
| $ | $ | |||||||
As
of December 31, 2025, the Company had open purchase commitments of $
| Year Ended December 31, | ||||||||||||
| 2025 | 2024 | 2023 | ||||||||||
| Research and development expense | $ | $ | $ | |||||||||
| Sales, marketing, general and administrative expense | ( | ) | ||||||||||
| $ | $ | $ | ||||||||||
During the year ended December 31, 2025, $ million and $ million of expense previously recognized within sales, marketing, general and administrative expense was reversed related to the forfeiture of awards in connection with the CEO and CFO separations, respectively, that occurred during the same period.
| 57 |
Options Activity and Positions
| Options | Shares | Weighted-average exercise price | Weighted-average remaining contractual term (in years) | Aggregate intrinsic value (thousands) | ||||||||||||
| Outstanding as of December 31, 2022 | $ | | $ | | ||||||||||||
| Granted | ||||||||||||||||
| Exercised | ( | ) | ||||||||||||||
| Forfeited or expired | ( | ) | ||||||||||||||
| Outstanding as of December 31, 2023 | $ | $ | ||||||||||||||
| Granted | ||||||||||||||||
| Exercised | ( | ) | ||||||||||||||
| Forfeited or expired | ( | ) | ||||||||||||||
| Outstanding as of December 31, 2024 | $ | $ | ||||||||||||||
| Granted | ||||||||||||||||
| Exercised | ( | ) | ||||||||||||||
| Forfeited or expired | ( | ) | ||||||||||||||
| Outstanding as of December 31, 2025 | $ | $ | ||||||||||||||
| Vested and expected to vest as of December 31, 2025 | $ | |||||||||||||||
| Exercisable as of December 31, 2025 | $ | |||||||||||||||
As of December 31, 2025, there is unrecognized share-based employee compensation related to stock options.
Restricted Stock Activity and Positions
| Shares | Weighted-average price | |||||||
| Unvested as of December 31, 2022 | $ | | ||||||
| Granted | ||||||||
| Vested | ( | ) | ||||||
| Forfeited | ( | ) | ||||||
| Unvested as of December 31, 2023 | ||||||||
| Granted | ||||||||
| Vested | ( | ) | ||||||
| Forfeited | ( | ) | ||||||
| Unvested as of December 31, 2024 ¹ | ||||||||
| Granted | ||||||||
| Vested | ( | ) | ||||||
| Forfeited | ( | ) | ||||||
| Unvested as of December 31, 2025 | $ | |||||||
| 1 |
During the year ended December 31, 2025, the Company granted shares to non-executive employees for annual, short-term incentive, and new hire awards. These shares are valued based on the closing price of common stock on the dates of grant and vest immediately or over three or four years.
| 58 |
During the year ended December 31, 2025, the Company granted shares to non-employees. These shares are valued based on the closing price of common stock on the dates of grant and vest immediately.
During the year ended December 31, 2025, the Company granted shares to executive employees and directors for annual, short-term incentive, and long-term incentive awards. These shares are valued based on the closing price of common stock on the dates of grant and vest immediately, over one year, or over three years
As of December 31, 2025, unrecognized share-based compensation related to RSUs was $ million, which will be expensed over the next years. Unrecognized share-based compensation related to executive PSUs was $ million, which will be expensed over the next years.
11. LEASES
The Company leases office space and certain equipment under operating and finance leases. All leases have remaining lease terms of less than eight years. Office lease agreements include both lease and non-lease components, which are accounted for separately. Finance leases contain options to purchase the leased property. The depreciable life of assets and leasehold improvements are limited by the expected lease term, unless the Company is reasonably certain to exercise the purchase option.
In
September 2021, the Company entered into a lease agreement for product testing and lab space in Redmond, Washington which commenced in
November 2021. In addition to base rent, the Company pays additional rent comprised of a proportionate share of any operating expenses,
real estate taxes, and management fees. The lease, which
In
September 2021, the Company entered into a lease agreement for office space in Redmond, Washington which commenced in December 2022.
In addition to base rent, the Company will pay additional rent comprised of a proportionate share of any operating expenses, real estate
taxes, and management fees. During the quarter ended June 30, 2023, a payment of $
In
April 2022, the Company entered into a lease agreement for product testing for engineering and development activities in Nuremberg, Germany
which commenced in May 2022. In June 2024, the Company abandoned the space prior to its
In
September 2022, the Company entered into a lease agreement for office space in Nuremberg, Germany which commenced in November 2022. In
June 2024, the Company entered into an early termination agreement to decrease the
Additionally,
in connection with the January 2023 acquisition of assets from Ibeo, the Company assumed three leases in Hamburg, Germany. Each lease
was abandoned or
In
December 2023, the Company entered into a lease agreement for office space in Hamburg, Germany which commenced in November 2024. The
lease, which
In
September 2025, the Company entered into a lease agreement for an airplane runway strip in Warrenton, Virgia which commenced in October
2025. In addition to base rent, the Company pays additional rent comprised of a proportionate share of any operating expenses and real
estate taxes. The lease, which
| 59 |
The components of lease expense are as follows:
| Year Ended December 31, | ||||||||||||
| (in thousands) | 2025 | 2024 | 2023 | |||||||||
| Operating lease expense | $ | $ | $ | |||||||||
| Finance lease expense: | ||||||||||||
| Amortization of leased assets | ||||||||||||
| Interest on lease liabilities | ||||||||||||
| Total finance lease expense | ||||||||||||
| Sublease income | ( | ) | ||||||||||
| Total lease expense | $ | $ | $ | |||||||||
Supplemental cash flow information related to leases is as follows:
| Year Ended December 31, | ||||||||||||
| (in thousands) | 2025 | 2024 | 2023 | |||||||||
| Cash paid for amounts included in measurement of lease liabilities: | ||||||||||||
| Operating cash flows from operating leases | $ | $ | $ | |||||||||
| Operating cash flows from finance leases | ||||||||||||
| Financing cash flows from finance leases | ||||||||||||
Supplemental balance sheet information related to leases is as follows:
| December 31, | ||||||||
| (in thousands) | 2025 | 2024 | ||||||
| Operating leases | ||||||||
| Operating lease right-of-use assets | $ | $ | ||||||
| Current portion of operating lease liabilities | ||||||||
| Operating lease liabilities, net of current portion | ||||||||
| Total operating lease liabilities | $ | $ | ||||||
| Finance leases | ||||||||
| Property and equipment, at cost | $ | $ | ||||||
| Accumulated depreciation | ( | ) | ( | ) | ||||
| Property and equipment, net | $ | $ | ||||||
| Weighted Average Remaining Lease Term | ||||||||
| Operating leases | ||||||||
| Finance leases | na | |||||||
| Weighted Average Discount Rate | ||||||||
| Operating leases | % | % | ||||||
| Finance leases | % | na | ||||||
As of December 31, 2025, maturities of lease liabilities are as follows:
| (in thousands) | Operating | Finance | ||||||
| Years Ended December 31, | Leases | Leases | ||||||
| 2026 | $ | $ | |
|||||
| 2027 | ||||||||
| 2028 | ||||||||
| 2029 | ||||||||
| 2030 | ||||||||
| Thereafter | ||||||||
| Total minimum lease payments | ||||||||
| Less: amount representing interest | ( | ) | ( |
) | ||||
| Present value of capital lease liabilities | $ | $ | ||||||
| 60 |
12. COMMITMENTS AND CONTINGENCIES
Purchase Commitments
During
the quarter ended September 30, 2023, the Company entered into a $
Litigation
The Company is subject to various claims and pending or threatened lawsuits in the normal course of business. The Company is not currently party to any legal proceedings that management believes are reasonably possible to have a material adverse effect on financial position, results of operations, or cash flows.
13. COMMON STOCK
In
March 2024, the Company entered into a $
14. INCOME TAXES
Components of net loss before income taxes are as follows (in thousands):
| Year Ended December 31, | ||||||||||||
| 2025 | 2024 | 2023 | ||||||||||
| United States | $ | ( | ) | $ | ( | ) | $ | ( | ) | |||
| Foreign | ( | ) | ||||||||||
| Total | $ | ( | ) | $ | ( | ) | $ | ( | ) | |||
Components of income taxes paid, net of refunds received are as follows (in thousands):
| Year Ended December 31, | ||||||||||||
| 2025 | 2024 | 2023 | ||||||||||
| Federal | ||||||||||||
| State | ||||||||||||
| Other states | ||||||||||||
| Total state | ||||||||||||
| Foreign | ||||||||||||
| Germany | ||||||||||||
| Other foreign | ||||||||||||
| Total foreign | ||||||||||||
| Total income taxes paid | ||||||||||||
| 61 |
Components of income tax expense (benefit) are as follows (in thousands):
| Year Ended December 31, | ||||||||||||
| 2025 | 2024 | 2023 | ||||||||||
| Current | ||||||||||||
| Federal | $ | $ | $ | |||||||||
| State | ||||||||||||
| International | ||||||||||||
| Total current tax expense | ||||||||||||
| Deferred | ||||||||||||
| Federal | ||||||||||||
| State | ||||||||||||
| International | ( | ) | ( | ) | ( | ) | ||||||
| Total deferred tax expense | ( | ) | ( | ) | ( | ) | ||||||
| Federal | ||||||||||||
| State | ||||||||||||
| International | ( | ) | ||||||||||
| Total tax (benefit) expense | $ | ( | ) | $ | $ | |||||||
The difference between the effective tax rate of the provision (benefit) for income taxes and the Federal statutory rate is as follows (in thousands):
| Year Ended December 31, | ||||||||||||||||||||||||
| 2025 | 2024 | 2023 | ||||||||||||||||||||||
| Amount | Percent | Amount | Percent | Amount | Percent | |||||||||||||||||||
| $ | ( | ) | % | $ | ( | ) | % | $ | ( | ) | % | |||||||||||||
| State income taxes, net of federal effect | - | - | - | |||||||||||||||||||||
| Change in valuation allowance | ( | ) | ( | ) | ( | ) | ||||||||||||||||||
| Nontaxable or nondeductible items: | ||||||||||||||||||||||||
| Share-based compensation | ( | ) | ( | ) | ( | ) | ||||||||||||||||||
| Notes payable related | ( | ) | ( | ) | ||||||||||||||||||||
| Other nondeductible items | ( | ) | ( | ) | ||||||||||||||||||||
| Tax credits | ||||||||||||||||||||||||
| Other tax credits | ( | ) | ( | ) | ( | ) | ||||||||||||||||||
| Other | ||||||||||||||||||||||||
| Foreign tax effects | ||||||||||||||||||||||||
| Other foreign jurisdictions | ( | ) | ( | ) | ( | ) | ||||||||||||||||||
| Total | $ | ( | ) | % | $ | ( | )% | $ | ( | )% | ||||||||||||||
Components of deferred tax assets are as follows (in thousands):
| December 31, | ||||||||
| 2025 | 2024 | |||||||
| Deferred tax assets | ||||||||
| Reserves | $ | $ | ||||||
| Net operating loss carryforwards | ||||||||
| R&D credit carryforwards | ||||||||
| Depreciation/amortization deferred | ||||||||
| Operating lease liabilities | ||||||||
| Other | ||||||||
| Total deferred tax assets | ||||||||
| Deferred tax liabilities | ||||||||
| Operating lease right-of-use assets | ( | ) | ( | ) | ||||
| Total deferred tax liabilities | ( | ) | ( | ) | ||||
| Net valuation allowances | ( | ) | ( | ) | ||||
| Deferred tax assets | $ | $ | ||||||
| 62 |
As
of December 31, 2025, a valuation allowance of $
As
of December 31, 2025, the Company has net operating loss carryforwards of approximately $
Certain net operating losses arise from the deductibility for tax purposes of compensation under nonqualified stock options equal to the difference between the fair value of the stock on the date of exercise and the exercise price of the options. For financial reporting purposes, the tax effect of this deduction, when recognized, is accounted for as an income tax benefit.
The One Big Beautiful Bill Act (“OBBBA”), which was enacted on July 4, 2025, introduced notable changes to the U.S. Internal Revenue Code, including the option to elect immediate expensing of domestic Section 174 costs. Section 174 costs are expenditures which represent research and development costs that are incident to the development or improvement of a product, process, formula, invention, computer software, or technique. As previously required under the Tax Cuts and Jobs Act, the Company capitalized research and development expenditures during the years ended December 31, 2022 through December 31, 2024. With the enactment of the OBBBA, the Company has continued to capitalize domestic Section 174 costs during the year ended December 31, 2025.
The
Company had
Interest
accrued and penalties related to unrecognized tax benefits are recognized in tax expense. During the years ended December 31, 2025, 2024
and 2023,
Income tax returns are filed in the U.S. federal jurisdiction, certain U.S. states, and in Germany. Due to the Company’s operating loss and credit carryforwards, the U.S. federal statute of limitations remains open for 2006 and onward. Tax years 2022 and forward remain open in Germany.
15. RESTRUCTURING CHARGES
In
2024, to better align the Company’s resources to support business needs, the Company reduced the global workforce by approximately
16. RETIREMENT SAVINGS PLAN
The
Company maintains a retirement savings plan which qualifies under Internal Revenue Code Section 401(k). The plan covers all qualified
employees. Contributions to the plan are made at the discretion of the Board of Directors. During the years ended December 31, 2025,
2024 and 2023, contributions of $
17. SUBSEQUENT EVENTS
Subsequent
to the date of these financial statements, on January 1, 2026, the Company acquired from Scantinel Photonics GmbH
(“Scantinel”) certain assets related to Scantinel’s 1550nm FMCW ultra-long-range LiDAR sensor business. The
purchase price of $
| 63 |
On
January 26, 2026, the Company entered into an agreement with Luminar Technologies, Inc. (“Luminar”), pursuant to which
MicroVision agreed to acquire from Luminar certain assets related to Luminar’s worldwide lidar sensor business, including
intellectual property and inventory related to its IRIS and HALO sensors. The acquisition was approved by the U.S. Bankruptcy Court
on January 27, 2026. On February 3, 2026, the acquisition closed and MicroVision paid to Luminar the purchase price of $
On
February 23, 2026, the Company entered into a Securities Purchase and Exchange Agreement (the “2026 Purchase Agreement”)
with an institutional investor, pursuant to which the Company issued two senior secured convertible notes – one for approximately $
The
2026 Convertible Notes will rank senior to all outstanding and future indebtedness of the Company. Immediately upon closing and monthly
beginning on April 1, 2026, the Holder may elect to require the Company to partially redeem the Notes. The Company has the right to optionally
convert any partial redemption of the Notes to shares of the Company’s common stock, subject to certain conditions.
Subsequent to closing the 2026 Purchase Agreement, on February 23, 2026, the Holder elected a partial redemption. The Company elected to settle through shares of common stock, which are expected to be issued on or before March 31, 2026.
On February 27, 2026, the Company committed to a plan to consolidate its Redmond, Washington-based engineering, manufacturing, supply chain, and quality activities into the Company’s new Orlando, Florida facility (the “Consolidation Plan”). The decision is part of the Company’s ongoing efforts to reduce operating expenses and cash usage, improve organizational efficiency, and align resources to support strategic priorities. See Part II, Item 9B, Other Information for additional discussion.
| 64 |
ITEM 9. CHANGES IN AND DISAGREEMENTS WITH ACCOUNTANTS ON ACCOUNTING AND FINANCIAL DISCLOSURE
There have been no changes in or disagreements with accountants on accounting or financial disclosure matters during our fiscal years ended December 31, 2025, 2024 and 2023.
ITEM
9A. CONTROLS AND PROCEDURES
(a) Evaluation of Disclosure Controls and Procedures. Our Chief Executive Officer (CEO) and the Chief Financial Officer (CFO)
evaluated our disclosure controls and procedures (as defined in Rules 13a-15(e)) under the Securities and Exchange Act of 1934, as amended
(the “Exchange Act”), prior to the filing of this Form 10-K. Based upon that evaluation, our CEO and CFO concluded that,
as of December 31, 2025, our disclosure controls and procedures were effective.
(b) Management’s Report on Internal Control Over Financial Reporting. Our management is responsible for establishing and
maintaining adequate internal control over financial reporting, as such term is defined in Exchange Act Rules 13a-15(f). Our management
conducted an evaluation of the effectiveness of our internal control over financial reporting based on the framework in Internal Control
— Integrated Framework (2013) issued by the Committee of Sponsoring Organizations of the Treadway Commission. Based on its
evaluation under the framework in Internal Control — Integrated Framework (2013), our management concluded that our internal
control over financial reporting was effective as of December 31, 2025.
(c) Limitations on the Effectiveness of Controls. Because of inherent limitations, internal control over financial reporting may not prevent or detect misstatements. Also, projections of any evaluation of effectiveness to future periods are subject to the risk that controls may become inadequate because of changes in conditions, or that the degree of compliance with the policies or procedures may deteriorate.
(d) Changes in Internal Control Over Financial Reporting. There were no changes in our internal control over financial reporting during the period ended December 31, 2025 which has materially affected, or is reasonably likely to materially affect, our internal control over financial reporting.
ITEM 9B. OTHER INFORMATION
(a) We are providing the following disclosure in lieu of filing a Current Report on Form 8-K relating to Item 2.05 Costs Associated with Exit or Disposal Activities:
On February 27, 2026, MicroVision, Inc. committed to a plan to consolidate its Redmond, Washington-based engineering, manufacturing, supply chain, and quality activities into the Company’s new Orlando, Florida facility (the “Consolidation Plan”). The decision is part of the Company’s ongoing efforts to reduce operating expenses and cash usage, improve organizational efficiency, and align resources to support strategic priorities.
In connection with the Consolidation Plan, in order to reduce operating expenses, the Company plans to reduce its Redmond-based workforce resulting in an approximately 20% reduction in the Company’s total global workforce. The reduction will commence in the first quarter of 2026 and is expected to be substantially completed by the end of the second quarter of 2026. During the second and third fiscal quarters of 2026, the Company estimates that it will incur one-time cash charges within the range of $1 million to $2 million associated with employee severance and related employee costs, as well as non-cash share-based compensation expense.
In addition, in connection with the Consolidation Plan, the Company expects to record a non-cash accounting charge estimated to be within the range of $8 million to $12 million due to the impairment of certain assets, including office leases, leasehold improvements, and related assets, stemming from the eventual closure of the Redmond facility.
The Company’s estimates are based on assumptions and actual results may materially differ. The Company may incur additional costs not currently contemplated due to events that may occur as a result of, or that are associated with, the workforce reduction and facility closure.
(b)
During the three months ended December 31, 2025, none of our directors or officers (as defined in Rule 16a-1(f) under the Securities
Exchange Act of 1934, as amended)
ITEM 9C. DISCLOSURE REGARDING FOREIGN JURISDICTIONS THAT PREVENT INSPECTIONS
None.
| 65 |
PART III.
ITEM 10. DIRECTORS, EXECUTIVE OFFICERS AND CORPORATE GOVERNANCE
Information regarding executive officers is included in Part I of this Annual Report on Form 10-K in Item 4A. The information required by this Item 10 of Form 10-K and not provided in Item 4A will be included under the caption “Proposal One – Election of Directors” and “Board of Directors & Governance Matters” in our 2026 Proxy Statement and is incorporated herein by reference. Our 2026 Proxy Statement will be filed with the SEC prior to our 2026 Annual Meeting of Shareholders.
ITEM 11. EXECUTIVE COMPENSATION
The information required by this Item 11 of Form 10-K will be included under the captions “Executive Compensation,” “Compensation Committee Interlocks and Insider Participation,” and “Director Compensation for 2025” in our 2026 Proxy Statement and are incorporated herein by reference.
ITEM 12. SECURITY OWNERSHIP OF CERTAIN BENEFICIAL OWNERS AND MANAGEMENT AND RELATED STOCKHOLDER MATTERS
Information as of December 31, 2025, regarding equity compensation plans approved and not approved by shareholders is summarized in the following table (in thousands, except per share data):
| Equity Compensation Plan Information | ||||||||||||
| Number of securities to be issued upon exercise of outstanding options, warrants and rights | Weighted-average exercise price of outstanding options, warrants and rights | Number of securities remaining available for further issuance under equity compensation plans (excluding securities reflected in column (a)) | ||||||||||
| Plan Category | (a) | (b) | (c) | |||||||||
| Equity compensation plans approved by shareholders | 14,794 | |||||||||||
| Options to purchase common stock | 602 | $ | ||||||||||
| Restricted stock units and performance stock units | 9,862 | - | ||||||||||
| Equity compensation plans not approved by shareholders | - | - | - | |||||||||
| Total | 10,464 | 14,794 | ||||||||||
The other information required by this Item 12 of Form 10-K will be included under the caption “Information about MicroVision Common Stock” in our 2026 Proxy Statement and is incorporated herein by reference.
ITEM 13. CERTAIN RELATIONSHIPS AND RELATED TRANSACTIONS AND DIRECTOR INDEPENDENCE
The information required by this Item 13 of Form 10-K will be included under the captions “Certain Relationships and Related Transactions” and “Board of Directors & Governance Matters” in our 2026 Proxy Statement and are incorporated herein by reference.
ITEM 14. PRINCIPAL ACCOUNTING FEES AND SERVICES
The information required by this Item 14 of Form 10-K will be included under the caption “Independent Registered Public Accounting Firm” in our 2026 Proxy Statement and is incorporated herein by reference.
| 66 |
PART IV.
ITEM 15. EXHIBITS, FINANCIAL STATEMENT SCHEDULES
(A) Documents filed as part of this Annual Report on Form 10-K:
1. Consolidated Financial Statements
| ● | Report of Independent Registered Public Accounting Firm | |
| ● | Consolidated Balance Sheets as of December 31, 2025 and 2024 | |
| ● | Consolidated Statements of Operations for the years ended December 31, 2025, 2024 and 2023 | |
| ● | Consolidated Statements of Comprehensive Loss for the years ended December 31, 2025, 2024 and 2023 | |
| ● | Consolidated Statements of Shareholders’ Equity for the years ended December 31, 2025, 2024 and 2023 | |
| ● | Consolidated Statements of Cash Flows for the years ended December 31, 2025, 2024 and 2023 | |
| ● | Notes to Consolidated Financial Statements |
2. Financial Statement Schedules
Schedule II
MicroVision, Inc.
Valuation and Qualifying Accounts and Reserves Schedule
(In thousands)
| Additions | ||||||||||||||||||||
| Year Ended December 31, | Balance at beginning of fiscal period | Charges to costs and expenses | Charges to other accounts | Deductions | Balance at end of fiscal period | |||||||||||||||
| 2023 | ||||||||||||||||||||
| Tax valuation allowance | $ | 130,125 | $ | 12,252 | $ | - | $ | - | $ | 142,377 | ||||||||||
| 2024 | ||||||||||||||||||||
| Tax valuation allowance | $ | 142,377 | $ | 10,558 | $ | - | $ | - | $ | 152,935 | ||||||||||
| 2025 | ||||||||||||||||||||
| Tax valuation allowance | $ | 152,935 | $ | 12,572 | $ | - | $ | - | $ | 165,507 | ||||||||||
All other schedules are omitted because they are not applicable, or because the information required is included in the consolidated financial statements and notes thereto.
| 67 |
3. Exhibits
The following exhibits are referenced or included in this Annual Report on Form 10-K.
| 68 |
| 101.INS | Inline XBRL Instance Document (the instance document does not appear in the Interactive Data File because its XBRL tags are embedded within the Inline XBRL document). | |
| 101.SCH | Inline XBRL Taxonomy Extension Schema | |
| 101.CAL | Inline XBRL Taxonomy Extension Calculation Linkbase Document | |
| 101.DEF | Inline XBRL Taxonomy Extension Definition Linkbase Document | |
| 101.LAB | Inline XBRL Taxonomy Extension Label Linkbase Document | |
| 101.PRE | Inline XBRL Taxonomy Extension Presentation Linkbase Document | |
| 104 | Cover Page Interactive Data File (formatted as inline XBRL and contained in Exhibit 101) |
| (1) | Incorporated by reference to the Company’s Post-Effective Amendment to Form S-3 Registration Statement, Registration No. 333-102244. |
| (2) | Incorporated by reference to the Company’s Form 10-Q for the quarterly period ended September 30, 2009. |
| (3) | Incorporated by reference to the Company’s Form 10-Q for the quarterly period ended June 30, 2024. |
| (4) | Incorporated by reference to the Company’s Current Report on Form 8-K filed on February 17, 2012. |
| (5) | Incorporated by reference to the Company’s Current Report on Form 8-K filed on July 14, 2023. |
| (6) | Incorporated by reference to the Company’s Amendment No. 2 to Form S-1 Registration Statement, Registration No. 333-222857. |
| (7) | Incorporated by reference to the Company’s Current Report on Form 8-K filed on May 19, 2023. |
| (8) | Incorporated by reference to the Company’s Form 10-Q for the quarterly period ended September 30, 2020. |
| (9) | Incorporated by reference to the Company’s Form 10-K for the year ended December 31, 2020. |
| (10) | Incorporated by reference to the Company’s Current Report on Form 8-K filed on August 29, 2023. |
| (11) | Incorporated by reference to the Company’s Form 10-Q for the quarterly period ended September 30, 2025. |
| (12) | Incorporated by reference to the Company’s Form 10-Q for the quarterly period ended September 30, 2021. |
| (13) | Incorporated by reference to the Company’s Form S-8 filed on June 8, 2022. |
| (14) | Incorporated by reference to the Company’s Current Report on Form 8-K filed on February 3, 2023. |
| (15) | Incorporated by reference to the Company’s Form 10-K for the year ended December 31, 2022. |
| (16) | Incorporated by reference to the Company’s Current Report on Form 8-K filed on June 16, 2023. |
| (17) | Incorporated by reference to the Company’s Current Report on Form 8-K filed on March 5, 2024. |
| (18) | Incorporated by reference to the Company’s Form 10-Q for the quarterly period ended September 30, 2024. |
| (19) | Incorporated by reference to the Company’s Current Report on Form 8-K filed on October 15, 2024. |
| (20) | Incorporated by reference to the Company’s Form 10-K for the year ended December 31, 2023. |
| (21) | Incorporated by reference to the Company’s Quarterly Report on Form 10-Q filed for the quarterly period ended June 30, 2025. |
| * | Management contracts and compensatory plans and arrangements required to be filed as exhibits pursuant to Item 15(b) of this Annual Report on Form 10-K. |
ITEM 16. FORM 10-K SUMMARY
None.
| 69 |
SIGNATURES
Pursuant to the requirements of Section 13 or 15(d) of the Securities Exchange Act of 1934, the registrant has duly caused this report to be signed on its behalf by the undersigned, thereunto duly authorized.
| MicroVision, Inc. | ||
| Date: March 4, 2026 | By | /s/ Glen DeVos |
| Glen DeVos | ||
| Chief Executive Officer and Director | ||
POWER OF ATTORNEY
KNOW ALL PERSONS BY THESE PRESENTS, that each person whose signature appears below constitutes and appoints Glen DeVos and Stephen Hrynewich, jointly and severally, his or her attorneys-in-fact, each with the power of substitution, for him or her in any and all capacities, to sign any amendments to this Annual Report on Form 10-K, and to file the same, with exhibits thereto and other documents in connection therewith, with the Securities and Exchange Commission, hereby ratifying and confirming all that each of said attorneys-in-fact, or his substitute or substitutes, may do or cause to be done by virtue hereof.
Pursuant to the requirements of the Securities Exchange Act of 1934, this report has been signed below by the following persons on behalf of the registrant and in the following capacities on March 4, 2026.
| Signature | Title | |
| /s/ Glen DeVos | Chief Executive Officer and Director | |
| Glen DeVos | (Principal Executive Officer) | |
| /s/ Stephen Hrynewich | Chief Financial Officer | |
| Stephen Hrynewich | (Principal Financial Officer and Principal Accounting Officer) | |
| /s/ Simon Biddiscombe | Director, Executive Vice Chair | |
| Simon Biddiscombe | ||
| /s/ Robert P. Carlile | Director | |
| Robert P. Carlile | ||
| /s/ Jeffrey Herbst | Director | |
| Jeffrey Herbst | ||
| Director | ||
| Laura Petereson | ||
| /s/ Peter Schabert | Director | |
| Peter Schabert | ||
| /s/ Jada Smith | Director | |
| Jada Smith |
| 70 |