
Investor Presentation | Third Quarter 2025 Updated October 23, 2025 SONIC AUTOMOTIVE EXHIBIT 99.2
NYSE SAH Forward-Looking Statements This presentation contains “forward-looking statements” within the meaning of the Private Securities Litigation Reform Act of 1995. These statements relate to future events, are not historical facts and are based on our current expectations and assumptions regarding our business, the economy and other future conditions. These statements can generally be identified by lead-in words such as “may,” “will,” “should,” “could,” “believe,” “expect,” “estimate,” “anticipate,” “intend,” “plan,” “project,” “foresee” and other similar words or phrases. Statements that describe our Company’s objectives, plans or goals are also forward-looking statements. Examples of such forward-looking information we may be discussing in this presentation include, without limitation, the potential impact of tariffs on new vehicle pricing, inventory levels, and consumer demand, our anticipated future new vehicle unit sales volume, revenues and profitability (including per unit data), our anticipated future used vehicle unit sales volume, revenues and profitability (including per unit data), future levels of consumer demand for new and used vehicles, our anticipated future parts, service and collision repair (“Fixed Operations”) gross profit, our anticipated future finance and insurance (“F&I”) gross profit, our anticipated expense reductions, targeted increases to our technician headcount, hybrid and electric vehicle trends and related GPU headwinds, long-term annual revenue and profitability targets, anticipated future growth capital expenditures, profitability and pricing expectations in our EchoPark Segment, EchoPark’s omnichannel strategy, anticipated future EchoPark population coverage, anticipated future EchoPark revenue and unit sales volume, anticipated future performance and growth of our Franchised Dealerships Segment, anticipated growth and profitability of our Powersports Segment, anticipated liquidity positions, anticipated industry new vehicle sales volume, anticipated industry used vehicle supply, the implementation of growth and operating strategies, including acquisitions of dealerships and properties, anticipated future acquisition synergies, the return of capital to stockholders, anticipated future success and impacts from the implementation of our strategic initiatives, and earnings per share expectations. You are cautioned that these forward-looking statements are not guarantees of future performance, involve risks and uncertainties and actual results may differ materially from those projected in the forward-looking statements as a result of various factors. These risks and uncertainties include, without limitation, risks associated with tariffs, import product restrictions and foreign trade risks, economic conditions in the markets in which we operate, supply chain disruptions and manufacturing delays, labor shortages, the impacts of inflation and fluctuations in interest rates, new and used vehicle industry sales volume, the success of our operational strategies, the rate and timing of overall economic expansion or contraction, and the other risk factors described in the Company’s Annual Report on Form 10-K for the year ended December 31, 2024 and other reports and information filed with the United States Securities and Exchange Commission (the “SEC”). These forward-looking statements, risks, uncertainties and additional factors speak only as of the date of this presentation. We undertake no obligation to update any such statements, except as required under federal securities laws and the rules and regulations of the SEC. 2
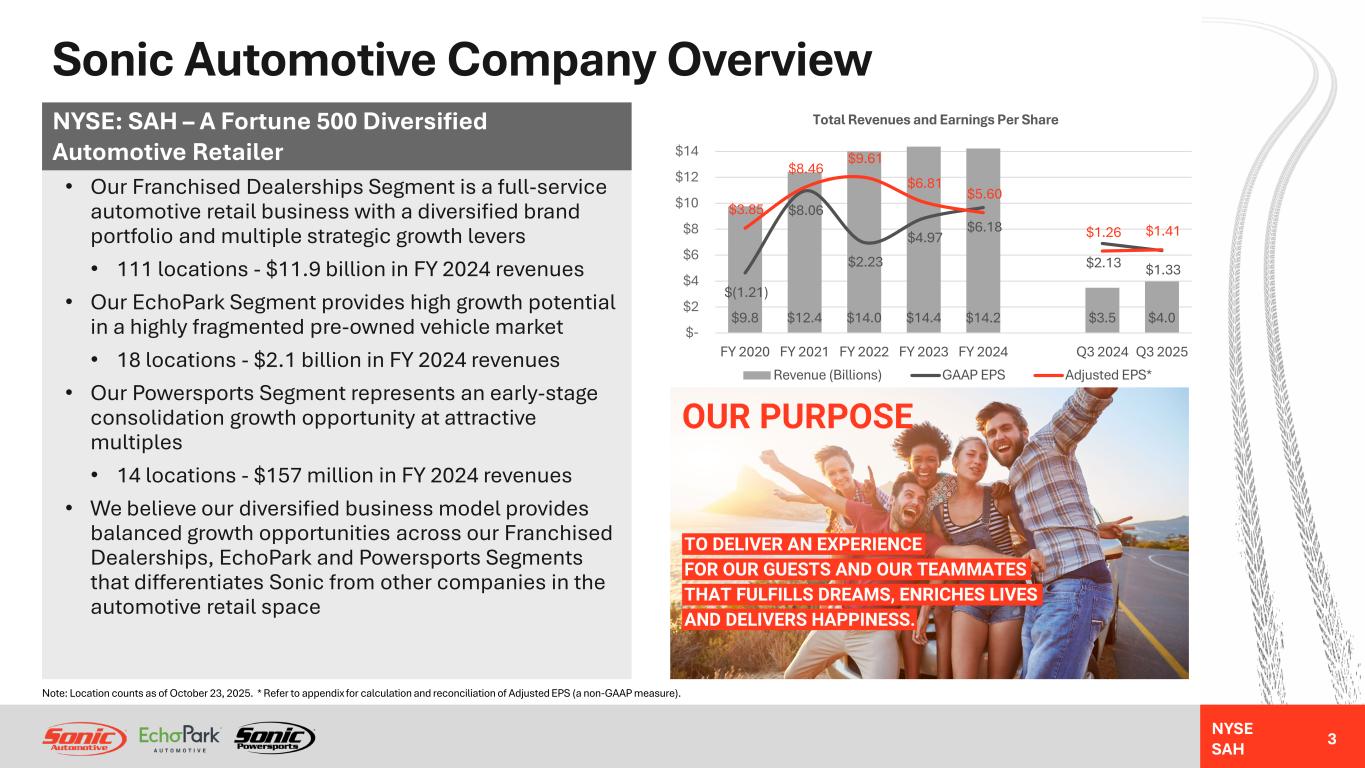
NYSE SAH Sonic Automotive Company Overview • Our Franchised Dealerships Segment is a full-service automotive retail business with a diversified brand portfolio and multiple strategic growth levers • 111 locations - $11.9 billion in FY 2024 revenues • Our EchoPark Segment provides high growth potential in a highly fragmented pre-owned vehicle market • 18 locations - $2.1 billion in FY 2024 revenues • Our Powersports Segment represents an early-stage consolidation growth opportunity at attractive multiples • 14 locations - $157 million in FY 2024 revenues • We believe our diversified business model provides balanced growth opportunities across our Franchised Dealerships, EchoPark and Powersports Segments that differentiates Sonic from other companies in the automotive retail space 3 Note: Location counts as of October 23, 2025. * Refer to appendix for calculation and reconciliation of Adjusted EPS (a non-GAAP measure). $9.8 $12.4 $14.0 $14.4 $14.2 $3.5 $4.0 $(1.21) $8.06 $2.23 $4.97 $6.18 $2.13 $1.33 $3.85 $8.46 $9.61 $6.81 $5.60 $1.26 $1.41 $- $2 $4 $6 $8 $10 $12 $14 FY 2020 FY 2021 FY 2022 FY 2023 FY 2024 Q3 2024 Q3 2025 Total Revenues and Earnings Per Share Revenue (Billions) GAAP EPS Adjusted EPS* NYSE: SAH – A Fortune 500 Diversified Automotive Retailer
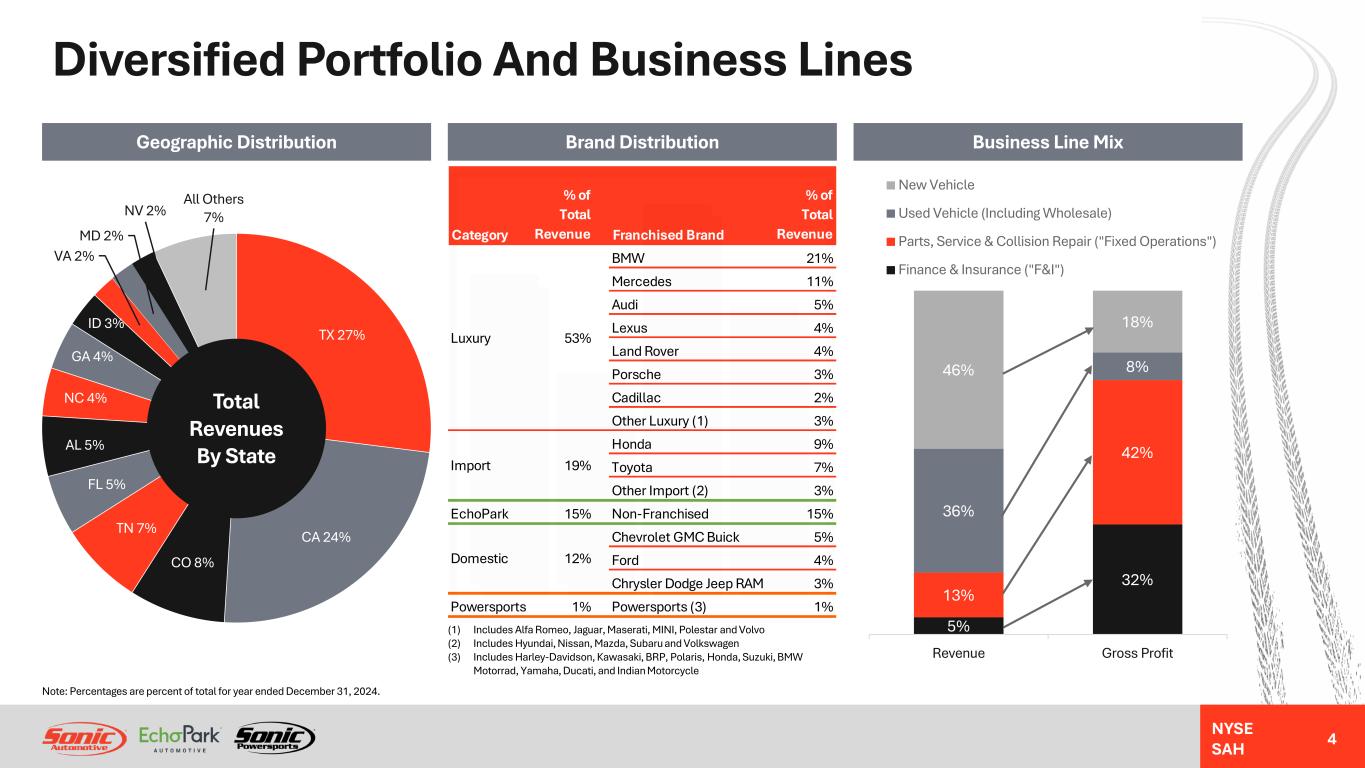
NYSE SAH Diversified Portfolio And Business Lines 4 Geographic Distribution TX 27% CA 24% CO 8% TN 7% FL 5% AL 5% NC 4% GA 4% ID 3% VA 2% MD 2% NV 2% All Others 7% Total Revenues By State Note: Percentages are percent of total for year ended December 31, 2024. 5% 32% 13% 42% 36% 8%46% 18% Revenue Gross Profit New Vehicle Used Vehicle (Including Wholesale) Parts, Service & Collision Repair ("Fixed Operations") Finance & Insurance ("F&I") Category % of Total Revenue Franchised Brand % of Total Revenue BMW 21% Mercedes 11% Audi 5% Lexus 4% Land Rover 4% Porsche 3% Cadillac 2% Other Luxury (1) 3% Honda 9% Toyota 7% Other Import (2) 3% EchoPark 15% Non-Franchised 15% Chevrolet GMC Buick 5% Ford 4% Chrysler Dodge Jeep RAM 3% Powersports 1% Powersports (3) 1% Luxury 53% 19%Import Domestic 12% (1) Includes Alfa Romeo, Jaguar, Maserati, MINI, Polestar and Volvo (2) Includes Hyundai, Nissan, Mazda, Subaru and Volkswagen (3) Includes Harley-Davidson, Kawasaki, BRP, Polaris, Honda, Suzuki, BMW Motorrad, Yamaha, Ducati, and Indian Motorcycle Business Line MixBrand Distribution
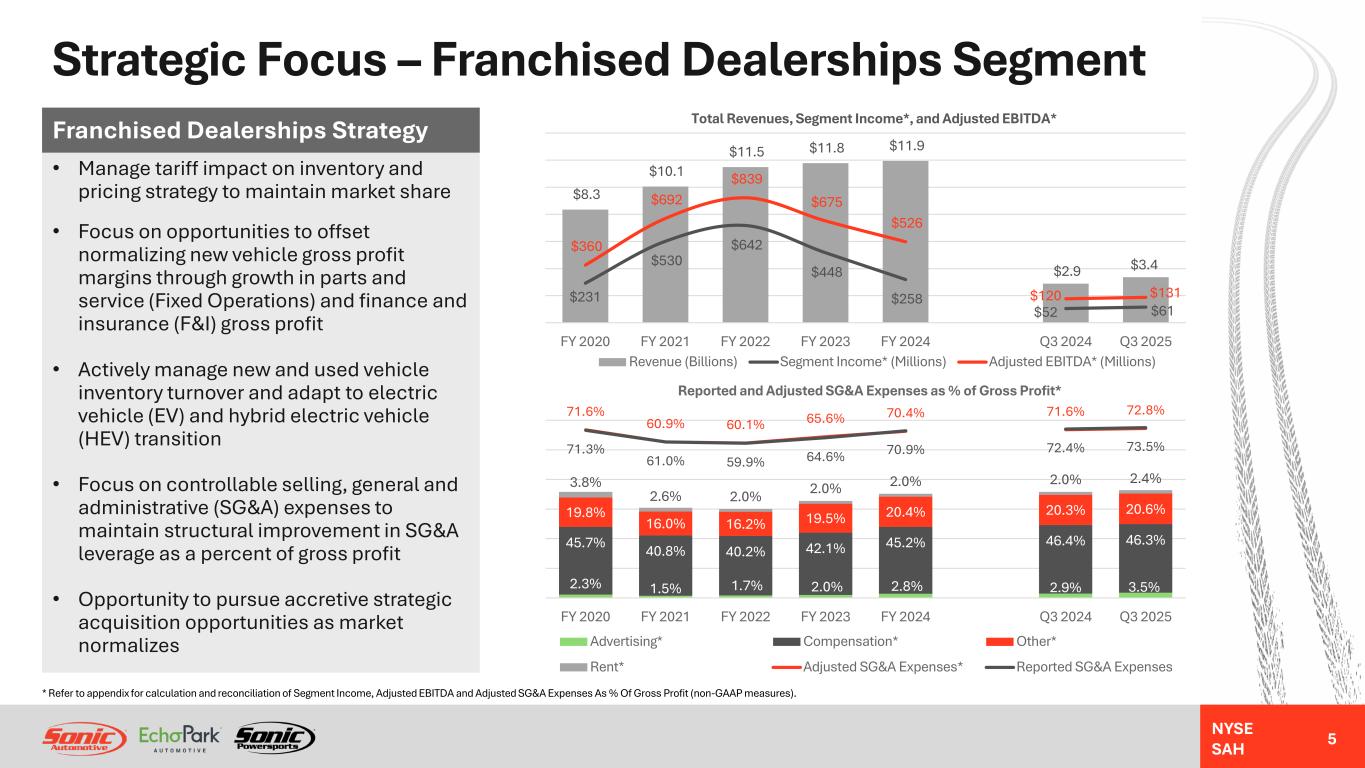
NYSE SAH Strategic Focus – Franchised Dealerships Segment • Manage tariff impact on inventory and pricing strategy to maintain market share • Focus on opportunities to offset normalizing new vehicle gross profit margins through growth in parts and service (Fixed Operations) and finance and insurance (F&I) gross profit • Actively manage new and used vehicle inventory turnover and adapt to electric vehicle (EV) and hybrid electric vehicle (HEV) transition • Focus on controllable selling, general and administrative (SG&A) expenses to maintain structural improvement in SG&A leverage as a percent of gross profit • Opportunity to pursue accretive strategic acquisition opportunities as market normalizes Franchised Dealerships Strategy $8.3 $10.1 $11.5 $11.8 $11.9 $2.9 $3.4 $231 $530 $642 $448 $258 $52 $61 $360 $692 $839 $675 $526 $120 $131 FY 2020 FY 2021 FY 2022 FY 2023 FY 2024 Q3 2024 Q3 2025 Total Revenues, Segment Income*, and Adjusted EBITDA* Revenue (Billions) Segment Income* (Millions) Adjusted EBITDA* (Millions) * Refer to appendix for calculation and reconciliation of Segment Income, Adjusted EBITDA and Adjusted SG&A Expenses As % Of Gross Profit (non-GAAP measures). 5 2.3% 1.5% 1.7% 2.0% 2.8% 2.9% 3.5% 45.7% 40.8% 40.2% 42.1% 45.2% 46.4% 46.3% 19.8% 16.0% 16.2% 19.5% 20.4% 20.3% 20.6% 3.8% 2.6% 2.0% 2.0% 2.0% 2.0% 2.4% 71.6% 60.9% 60.1% 65.6% 70.4% 71.6% 72.8% 71.3% 61.0% 59.9% 64.6% 70.9% 72.4% 73.5% FY 2020 FY 2021 FY 2022 FY 2023 FY 2024 Q3 2024 Q3 2025 Reported and Adjusted SG&A Expenses as % of Gross Profit* Advertising* Compensation* Other* Rent* Adjusted SG&A Expenses* Reported SG&A Expenses
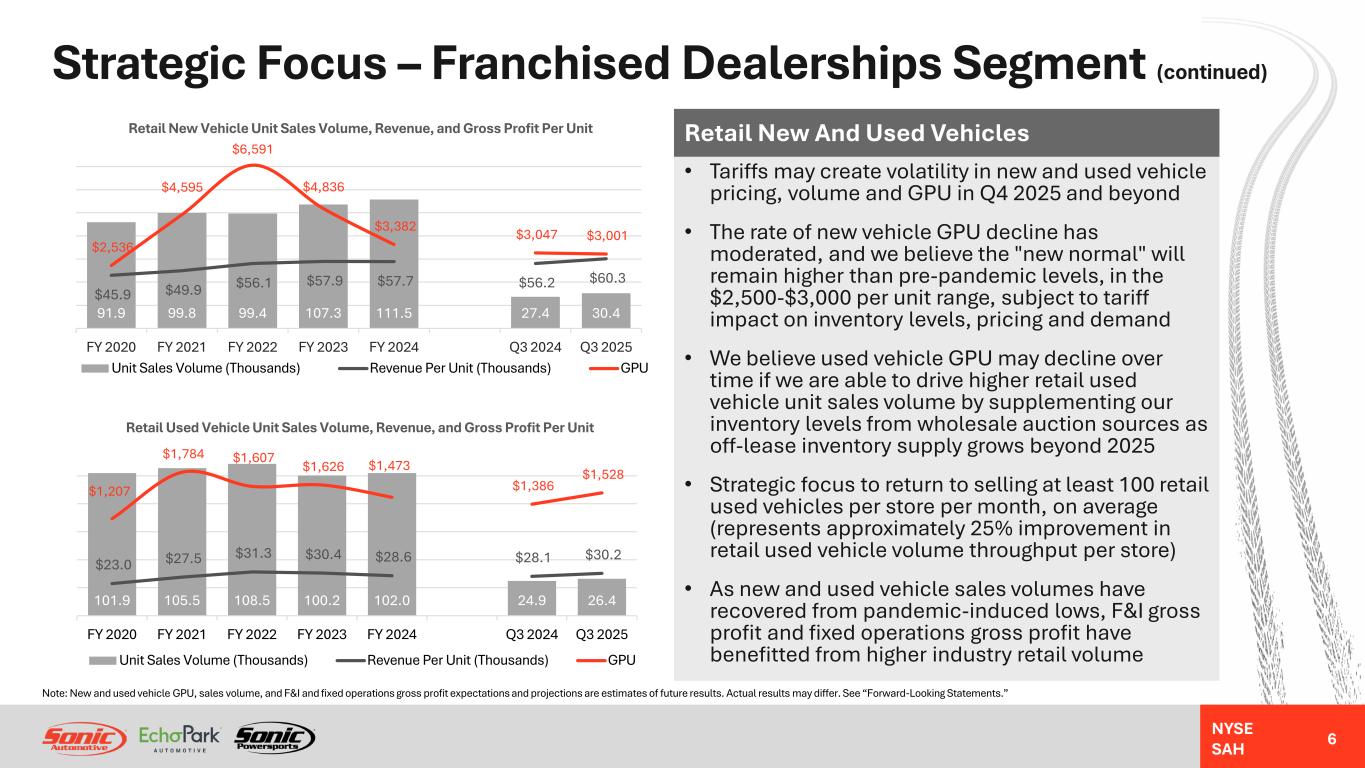
NYSE SAH Strategic Focus – Franchised Dealerships Segment (continued) 6 91.9 99.8 99.4 107.3 111.5 27.4 30.4 $45.9 $49.9 $56.1 $57.9 $57.7 $56.2 $60.3 $2,536 $4,595 $6,591 $4,836 $3,382 $3,047 $3,001 FY 2020 FY 2021 FY 2022 FY 2023 FY 2024 Q3 2024 Q3 2025 Retail New Vehicle Unit Sales Volume, Revenue, and Gross Profit Per Unit Unit Sales Volume (Thousands) Revenue Per Unit (Thousands) GPU 101.9 105.5 108.5 100.2 102.0 24.9 26.4 $23.0 $27.5 $31.3 $30.4 $28.6 $28.1 $30.2 $1,207 $1,784 $1,607 $1,626 $1,473 $1,386 $1,528 FY 2020 FY 2021 FY 2022 FY 2023 FY 2024 Q3 2024 Q3 2025 Retail Used Vehicle Unit Sales Volume, Revenue, and Gross Profit Per Unit Unit Sales Volume (Thousands) Revenue Per Unit (Thousands) GPU Retail New And Used Vehicles • Tariffs may create volatility in new and used vehicle pricing, volume and GPU in Q4 2025 and beyond • The rate of new vehicle GPU decline has moderated, and we believe the "new normal" will remain higher than pre-pandemic levels, in the $2,500-$3,000 per unit range, subject to tariff impact on inventory levels, pricing and demand • We believe used vehicle GPU may decline over time if we are able to drive higher retail used vehicle unit sales volume by supplementing our inventory levels from wholesale auction sources as off-lease inventory supply grows beyond 2025 • Strategic focus to return to selling at least 100 retail used vehicles per store per month, on average (represents approximately 25% improvement in retail used vehicle volume throughput per store) • As new and used vehicle sales volumes have recovered from pandemic-induced lows, F&I gross profit and fixed operations gross profit have benefitted from higher industry retail volume Note: New and used vehicle GPU, sales volume, and F&I and fixed operations gross profit expectations and projections are estimates of future results. Actual results may differ. See “Forward-Looking Statements.”
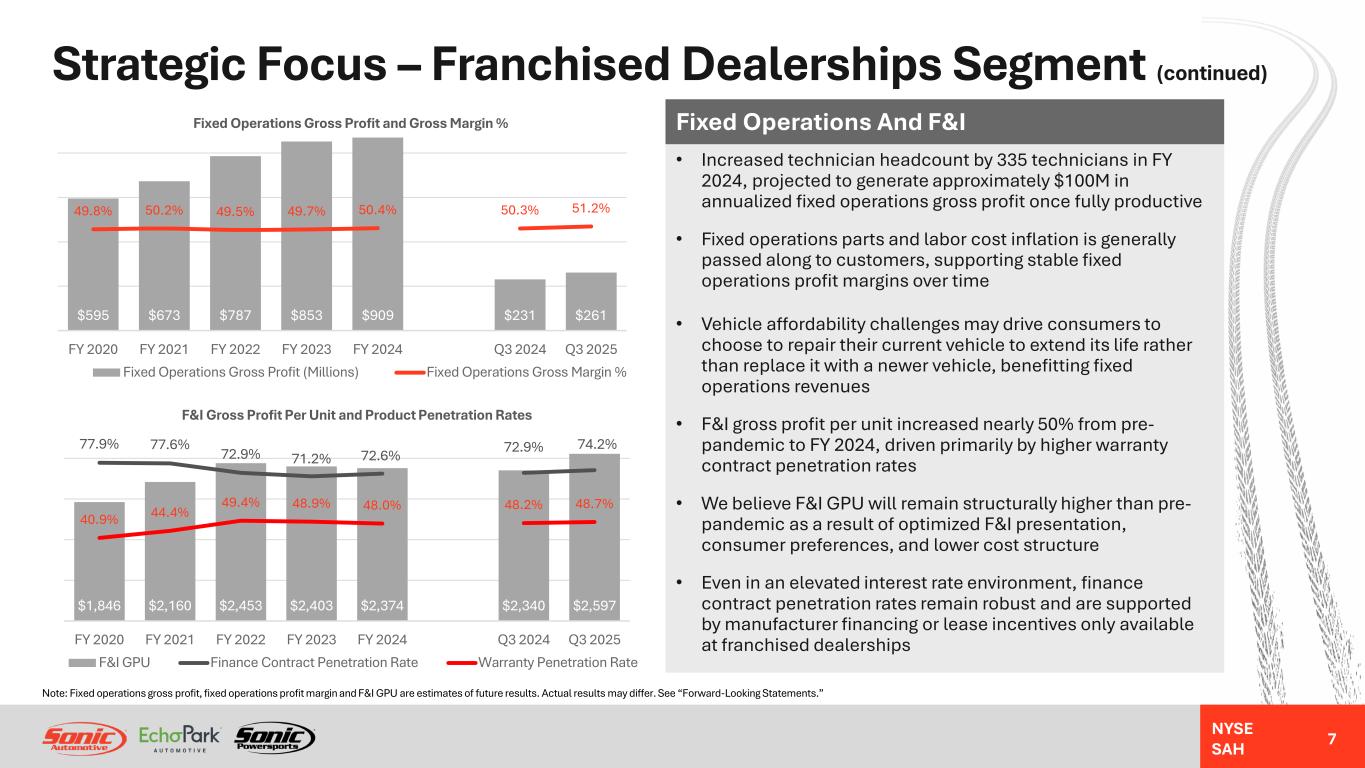
NYSE SAH Strategic Focus – Franchised Dealerships Segment (continued) 7 Fixed Operations And F&I • Increased technician headcount by 335 technicians in FY 2024, projected to generate approximately $100M in annualized fixed operations gross profit once fully productive • Fixed operations parts and labor cost inflation is generally passed along to customers, supporting stable fixed operations profit margins over time • Vehicle affordability challenges may drive consumers to choose to repair their current vehicle to extend its life rather than replace it with a newer vehicle, benefitting fixed operations revenues • F&I gross profit per unit increased nearly 50% from pre- pandemic to FY 2024, driven primarily by higher warranty contract penetration rates • We believe F&I GPU will remain structurally higher than pre- pandemic as a result of optimized F&I presentation, consumer preferences, and lower cost structure • Even in an elevated interest rate environment, finance contract penetration rates remain robust and are supported by manufacturer financing or lease incentives only available at franchised dealerships $1,846 $2,160 $2,453 $2,403 $2,374 $2,340 $2,597 77.9% 77.6% 72.9% 71.2% 72.6% 72.9% 74.2% 40.9% 44.4% 49.4% 48.9% 48.0% 48.2% 48.7% FY 2020 FY 2021 FY 2022 FY 2023 FY 2024 Q3 2024 Q3 2025 F&I Gross Profit Per Unit and Product Penetration Rates F&I GPU Finance Contract Penetration Rate Warranty Penetration Rate Note: Fixed operations gross profit, fixed operations profit margin and F&I GPU are estimates of future results. Actual results may differ. See “Forward-Looking Statements.” $595 $673 $787 $853 $909 $231 $261 49.8% 50.2% 49.5% 49.7% 50.4% 50.3% 51.2% FY 2020 FY 2021 FY 2022 FY 2023 FY 2024 Q3 2024 Q3 2025 Fixed Operations Gross Profit and Gross Margin % Fixed Operations Gross Profit (Millions) Fixed Operations Gross Margin %
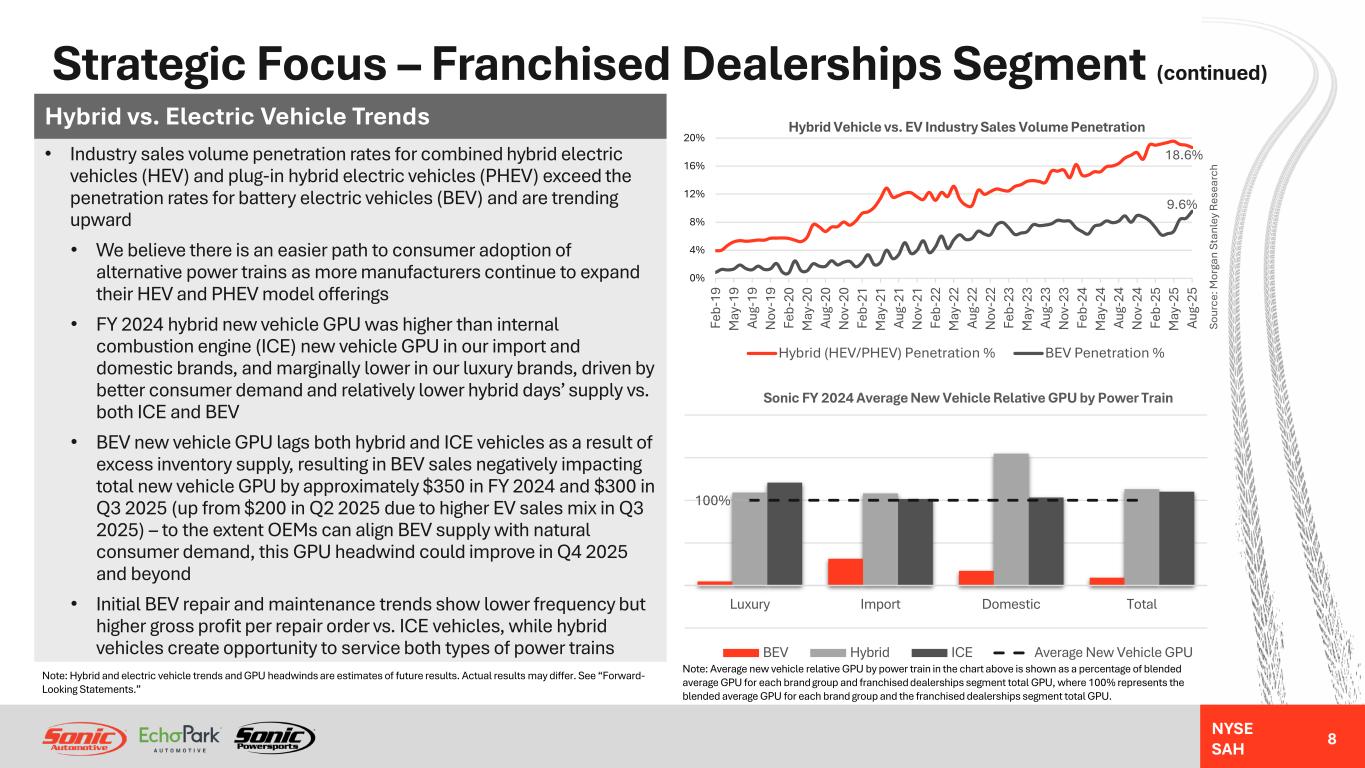
NYSE SAH Strategic Focus – Franchised Dealerships Segment (continued) Hybrid vs. Electric Vehicle Trends • Industry sales volume penetration rates for combined hybrid electric vehicles (HEV) and plug-in hybrid electric vehicles (PHEV) exceed the penetration rates for battery electric vehicles (BEV) and are trending upward • We believe there is an easier path to consumer adoption of alternative power trains as more manufacturers continue to expand their HEV and PHEV model offerings • FY 2024 hybrid new vehicle GPU was higher than internal combustion engine (ICE) new vehicle GPU in our import and domestic brands, and marginally lower in our luxury brands, driven by better consumer demand and relatively lower hybrid days’ supply vs. both ICE and BEV • BEV new vehicle GPU lags both hybrid and ICE vehicles as a result of excess inventory supply, resulting in BEV sales negatively impacting total new vehicle GPU by approximately $350 in FY 2024 and $300 in Q3 2025 (up from $200 in Q2 2025 due to higher EV sales mix in Q3 2025) – to the extent OEMs can align BEV supply with natural consumer demand, this GPU headwind could improve in Q4 2025 and beyond • Initial BEV repair and maintenance trends show lower frequency but higher gross profit per repair order vs. ICE vehicles, while hybrid vehicles create opportunity to service both types of power trains 18.6% 9.6% 0% 4% 8% 12% 16% 20% Fe b- 19 M ay -1 9 Au g- 19 N ov -1 9 Fe b- 20 M ay -2 0 Au g- 20 N ov -2 0 Fe b- 21 M ay -2 1 Au g- 21 N ov -2 1 Fe b- 22 M ay -2 2 Au g- 22 N ov -2 2 Fe b- 23 M ay -2 3 Au g- 23 N ov -2 3 Fe b- 24 M ay -2 4 Au g- 24 N ov -2 4 Fe b- 25 M ay -2 5 Au g- 25 Hybrid Vehicle vs. EV Industry Sales Volume Penetration Hybrid (HEV/PHEV) Penetration % BEV Penetration % So ur ce : M or ga n St an le y R es ea rc h 8 100% Luxury Import Domestic Total Sonic FY 2024 Average New Vehicle Relative GPU by Power Train BEV Hybrid ICE Average New Vehicle GPU Note: Average new vehicle relative GPU by power train in the chart above is shown as a percentage of blended average GPU for each brand group and franchised dealerships segment total GPU, where 100% represents the blended average GPU for each brand group and the franchised dealerships segment total GPU. Note: Hybrid and electric vehicle trends and GPU headwinds are estimates of future results. Actual results may differ. See “Forward- Looking Statements.”
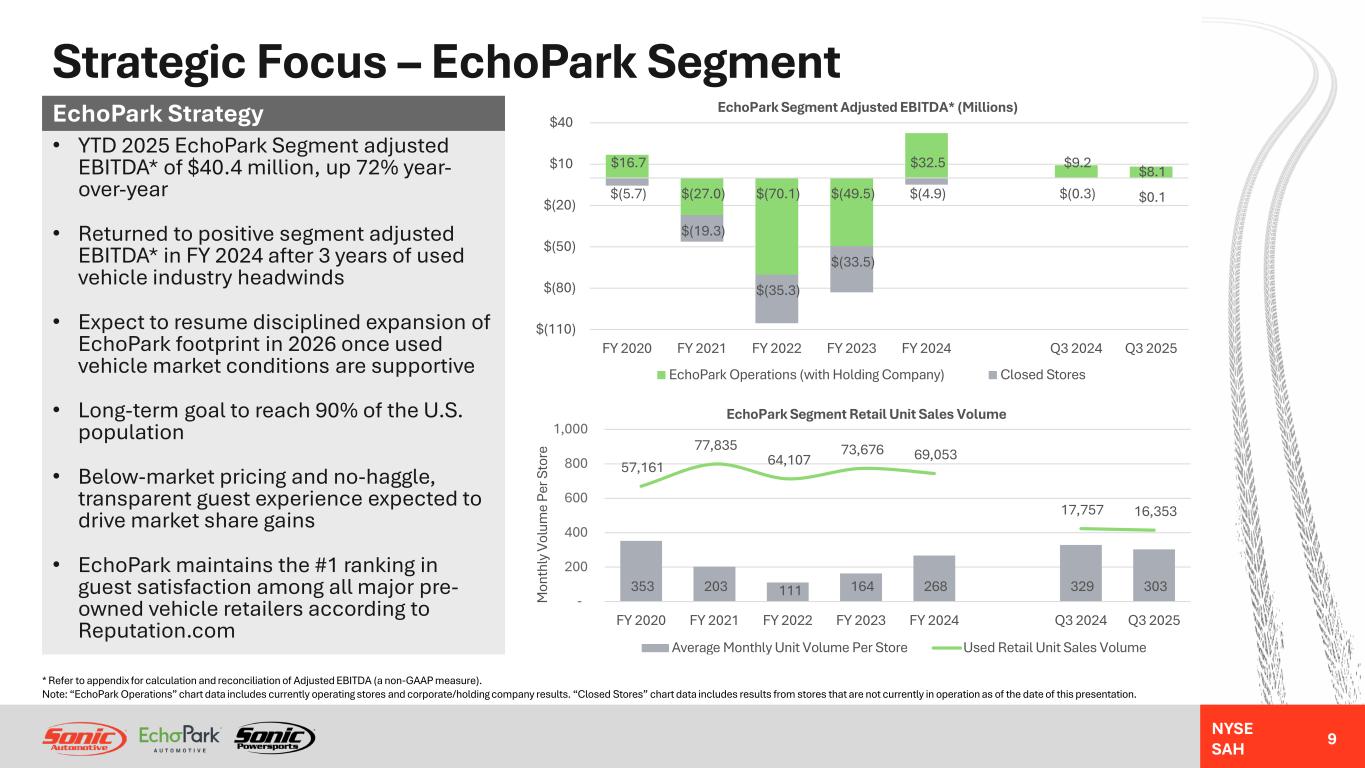
NYSE SAH Strategic Focus – EchoPark Segment • YTD 2025 EchoPark Segment adjusted EBITDA* of $40.4 million, up 72% year- over-year • Returned to positive segment adjusted EBITDA* in FY 2024 after 3 years of used vehicle industry headwinds • Expect to resume disciplined expansion of EchoPark footprint in 2026 once used vehicle market conditions are supportive • Long-term goal to reach 90% of the U.S. population • Below-market pricing and no-haggle, transparent guest experience expected to drive market share gains • EchoPark maintains the #1 ranking in guest satisfaction among all major pre- owned vehicle retailers according to Reputation.com EchoPark Strategy * Refer to appendix for calculation and reconciliation of Adjusted EBITDA (a non-GAAP measure). Note: “EchoPark Operations” chart data includes currently operating stores and corporate/holding company results. “Closed Stores” chart data includes results from stores that are not currently in operation as of the date of this presentation. $16.7 $(27.0) $(70.1) $(49.5) $32.5 $9.2 $8.1 $(5.7) $(19.3) $(35.3) $(33.5) $(4.9) $(0.3) $0.1 $(110) $(80) $(50) $(20) $10 $40 FY 2020 FY 2021 FY 2022 FY 2023 FY 2024 Q3 2024 Q3 2025 EchoPark Segment Adjusted EBITDA* (Millions) EchoPark Operations (with Holding Company) Closed Stores 353 203 111 164 268 329 303 57,161 77,835 64,107 73,676 69,053 17,757 16,353 - 200 400 600 800 1,000 FY 2020 FY 2021 FY 2022 FY 2023 FY 2024 Q3 2024 Q3 2025 M on th ly V ol um e Pe r S to re EchoPark Segment Retail Unit Sales Volume Average Monthly Unit Volume Per Store Used Retail Unit Sales Volume 9
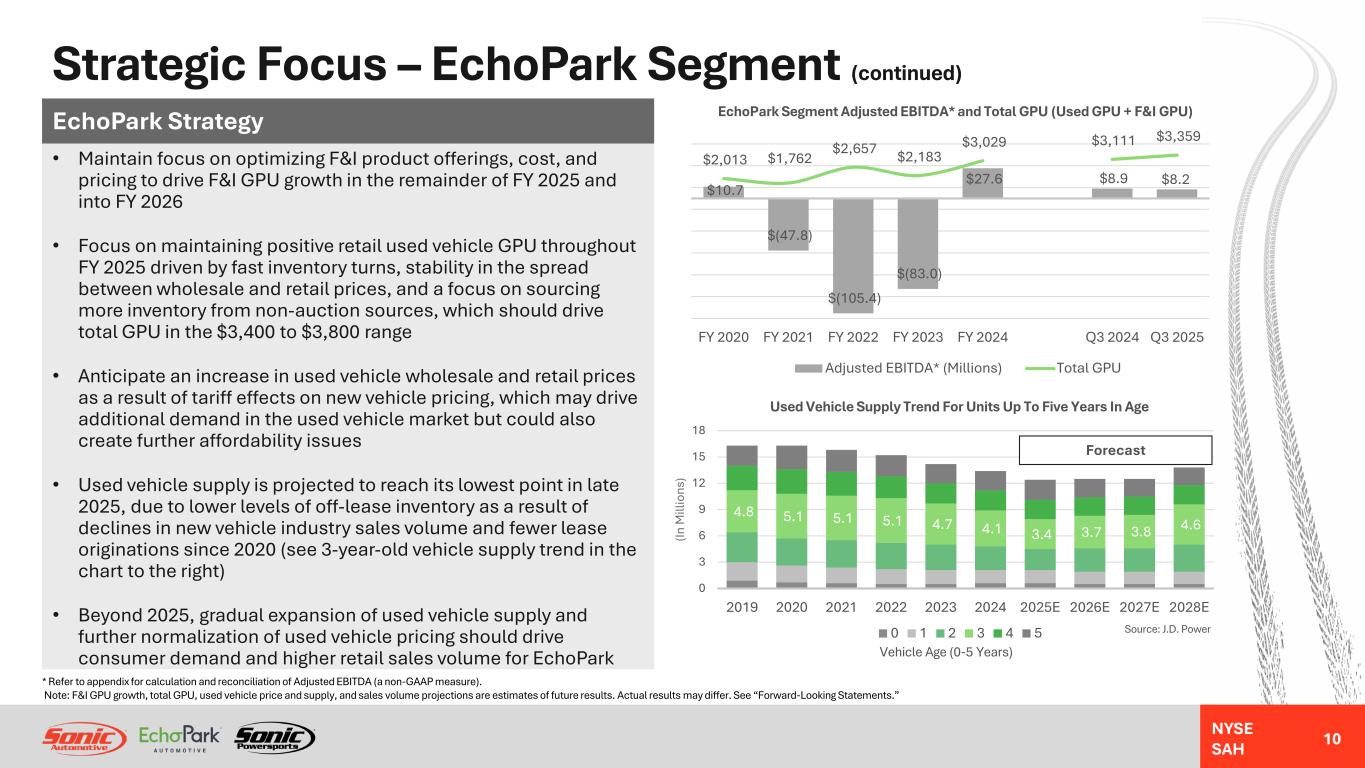
NYSE SAH Strategic Focus – EchoPark Segment (continued) 10 • Maintain focus on optimizing F&I product offerings, cost, and pricing to drive F&I GPU growth in the remainder of FY 2025 and into FY 2026 • Focus on maintaining positive retail used vehicle GPU throughout FY 2025 driven by fast inventory turns, stability in the spread between wholesale and retail prices, and a focus on sourcing more inventory from non-auction sources, which should drive total GPU in the $3,400 to $3,800 range • Anticipate an increase in used vehicle wholesale and retail prices as a result of tariff effects on new vehicle pricing, which may drive additional demand in the used vehicle market but could also create further affordability issues • Used vehicle supply is projected to reach its lowest point in late 2025, due to lower levels of off-lease inventory as a result of declines in new vehicle industry sales volume and fewer lease originations since 2020 (see 3-year-old vehicle supply trend in the chart to the right) • Beyond 2025, gradual expansion of used vehicle supply and further normalization of used vehicle pricing should drive consumer demand and higher retail sales volume for EchoPark EchoPark Strategy $10.7 $(47.8) $(105.4) $(83.0) $27.6 $8.9 $8.2 $2,013 $1,762 $2,657 $2,183 $3,029 $3,111 $3,359 FY 2020 FY 2021 FY 2022 FY 2023 FY 2024 Q3 2024 Q3 2025 EchoPark Segment Adjusted EBITDA* and Total GPU (Used GPU + F&I GPU) Adjusted EBITDA* (Millions) Total GPU Source: J.D. Power Vehicle Age (0-5 Years) * Refer to appendix for calculation and reconciliation of Adjusted EBITDA (a non-GAAP measure). Note: F&I GPU growth, total GPU, used vehicle price and supply, and sales volume projections are estimates of future results. Actual results may differ. See “Forward-Looking Statements.” 4.8 5.1 5.1 5.1 4.7 4.1 3.4 3.7 3.8 4.6 0 3 6 9 12 15 18 2019 2020 2021 2022 2023 2024 2025E 2026E 2027E 2028E (In M ill io ns ) Used Vehicle Supply Trend For Units Up To Five Years In Age 0 1 2 3 4 5 Forecast
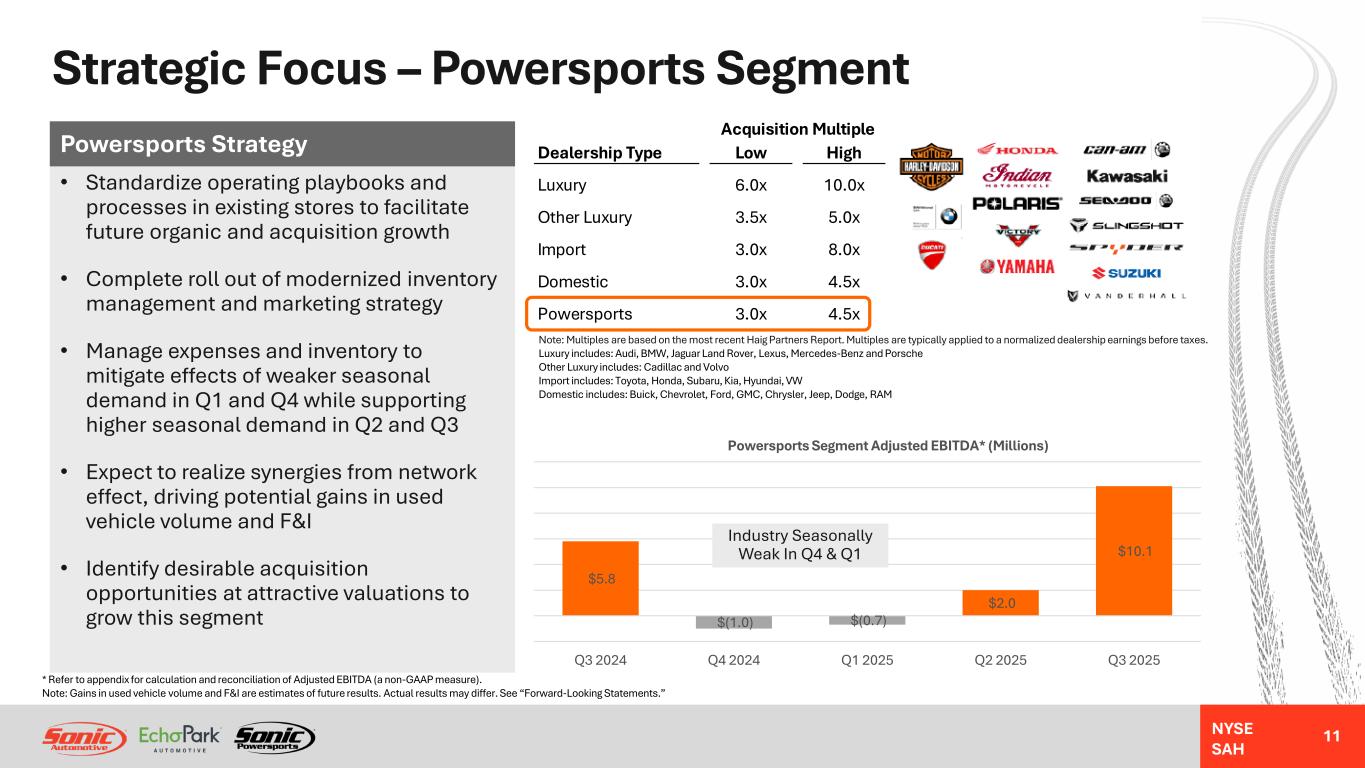
NYSE SAH 11 • Standardize operating playbooks and processes in existing stores to facilitate future organic and acquisition growth • Complete roll out of modernized inventory management and marketing strategy • Manage expenses and inventory to mitigate effects of weaker seasonal demand in Q1 and Q4 while supporting higher seasonal demand in Q2 and Q3 • Expect to realize synergies from network effect, driving potential gains in used vehicle volume and F&I • Identify desirable acquisition opportunities at attractive valuations to grow this segment Powersports Strategy Note: Multiples are based on the most recent Haig Partners Report. Multiples are typically applied to a normalized dealership earnings before taxes. Luxury includes: Audi, BMW, Jaguar Land Rover, Lexus, Mercedes-Benz and Porsche Other Luxury includes: Cadillac and Volvo Import includes: Toyota, Honda, Subaru, Kia, Hyundai, VW Domestic includes: Buick, Chevrolet, Ford, GMC, Chrysler, Jeep, Dodge, RAM Strategic Focus – Powersports Segment * Refer to appendix for calculation and reconciliation of Adjusted EBITDA (a non-GAAP measure). Note: Gains in used vehicle volume and F&I are estimates of future results. Actual results may differ. See “Forward-Looking Statements.” $5.8 $(1.0) $(0.7) $2.0 $10.1 Q3 2024 Q4 2024 Q1 2025 Q2 2025 Q3 2025 Powersports Segment Adjusted EBITDA* (Millions) Industry Seasonally Weak In Q4 & Q1 Acquisition Multiple Dealership Type Low High Luxury 6.0x 10.0x Other Luxury 3.5x 5.0x Import 3.0x 8.0x Domestic 3.0x 4.5x Powersports 3.0x 4.5x
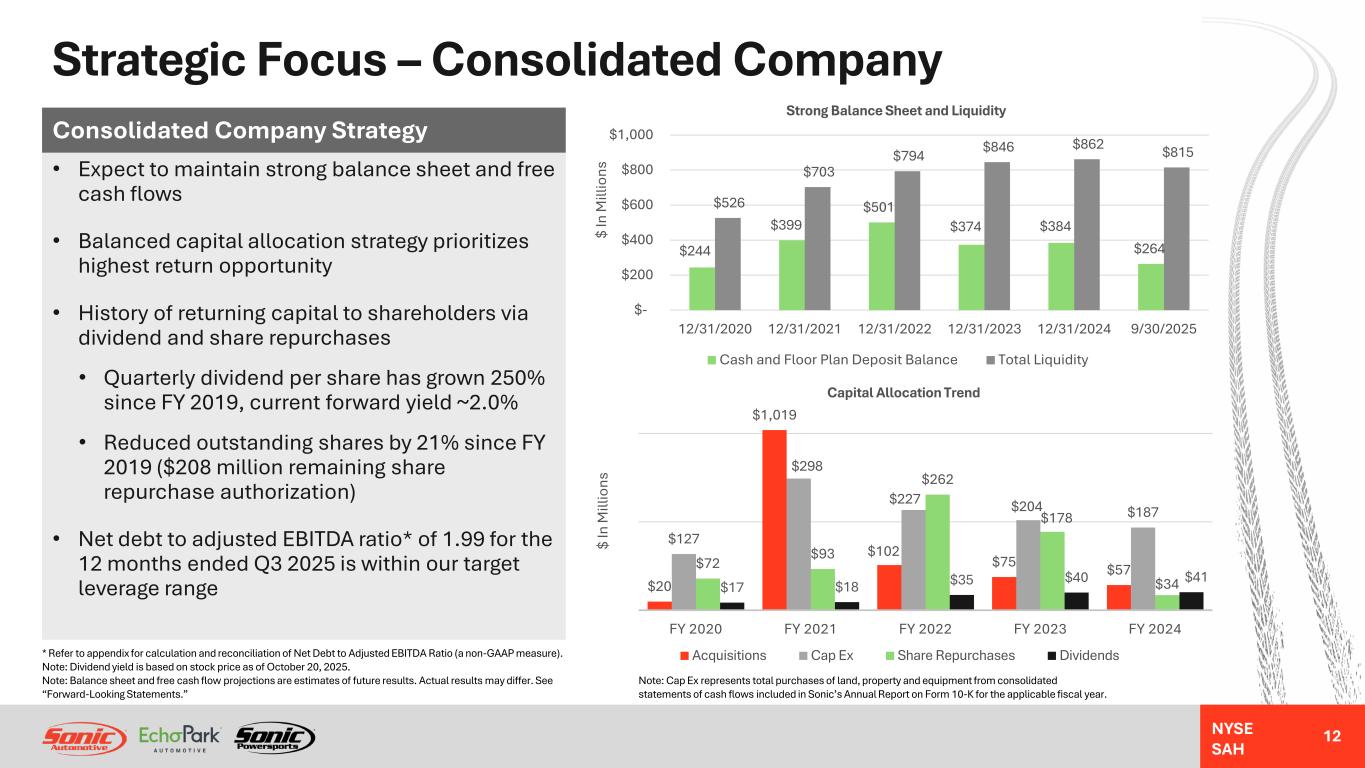
NYSE SAH Strategic Focus – Consolidated Company 12 • Expect to maintain strong balance sheet and free cash flows • Balanced capital allocation strategy prioritizes highest return opportunity • History of returning capital to shareholders via dividend and share repurchases • Quarterly dividend per share has grown 250% since FY 2019, current forward yield ~2.0% • Reduced outstanding shares by 21% since FY 2019 ($208 million remaining share repurchase authorization) • Net debt to adjusted EBITDA ratio* of 1.99 for the 12 months ended Q3 2025 is within our target leverage range Consolidated Company Strategy $244 $399 $501 $374 $384 $264 $526 $703 $794 $846 $862 $815 $- $200 $400 $600 $800 $1,000 12/31/2020 12/31/2021 12/31/2022 12/31/2023 12/31/2024 9/30/2025 $ In M ill io ns Strong Balance Sheet and Liquidity Cash and Floor Plan Deposit Balance Total Liquidity * Refer to appendix for calculation and reconciliation of Net Debt to Adjusted EBITDA Ratio (a non-GAAP measure). Note: Dividend yield is based on stock price as of October 20, 2025. Note: Balance sheet and free cash flow projections are estimates of future results. Actual results may differ. See “Forward-Looking Statements.” $20 $1,019 $102 $75 $57 $127 $298 $227 $204 $187 $72 $93 $262 $178 $34 $17 $18 $35 $40 $41 FY 2020 FY 2021 FY 2022 FY 2023 FY 2024 $ In M ill io ns Capital Allocation Trend Acquisitions Cap Ex Share Repurchases Dividends Note: Cap Ex represents total purchases of land, property and equipment from consolidated statements of cash flows included in Sonic’s Annual Report on Form 10-K for the applicable fiscal year.
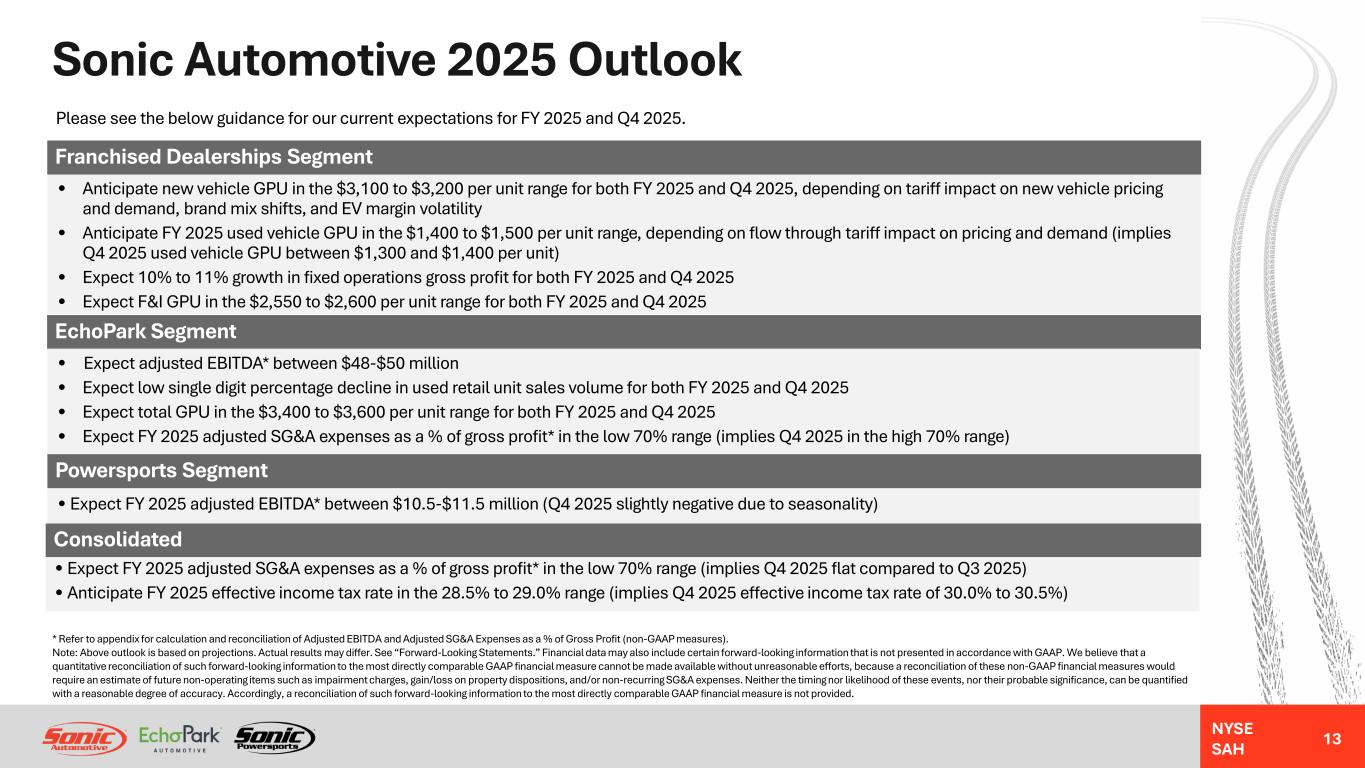
NYSE SAH Sonic Automotive 2025 Outlook • Anticipate new vehicle GPU in the $3,100 to $3,200 per unit range for both FY 2025 and Q4 2025, depending on tariff impact on new vehicle pricing and demand, brand mix shifts, and EV margin volatility • Anticipate FY 2025 used vehicle GPU in the $1,400 to $1,500 per unit range, depending on flow through tariff impact on pricing and demand (implies Q4 2025 used vehicle GPU between $1,300 and $1,400 per unit) • Expect 10% to 11% growth in fixed operations gross profit for both FY 2025 and Q4 2025 • Expect F&I GPU in the $2,550 to $2,600 per unit range for both FY 2025 and Q4 2025 Consolidated • Expect FY 2025 adjusted SG&A expenses as a % of gross profit* in the low 70% range (implies Q4 2025 flat compared to Q3 2025) • Anticipate FY 2025 effective income tax rate in the 28.5% to 29.0% range (implies Q4 2025 effective income tax rate of 30.0% to 30.5%) Franchised Dealerships Segment EchoPark Segment • Expect adjusted EBITDA* between $48-$50 million • Expect low single digit percentage decline in used retail unit sales volume for both FY 2025 and Q4 2025 • Expect total GPU in the $3,400 to $3,600 per unit range for both FY 2025 and Q4 2025 • Expect FY 2025 adjusted SG&A expenses as a % of gross profit* in the low 70% range (implies Q4 2025 in the high 70% range) Powersports Segment • Expect FY 2025 adjusted EBITDA* between $10.5-$11.5 million (Q4 2025 slightly negative due to seasonality) * Refer to appendix for calculation and reconciliation of Adjusted EBITDA and Adjusted SG&A Expenses as a % of Gross Profit (non-GAAP measures). Note: Above outlook is based on projections. Actual results may differ. See “Forward-Looking Statements.” Financial data may also include certain forward-looking information that is not presented in accordance with GAAP. We believe that a quantitative reconciliation of such forward-looking information to the most directly comparable GAAP financial measure cannot be made available without unreasonable efforts, because a reconciliation of these non-GAAP financial measures would require an estimate of future non-operating items such as impairment charges, gain/loss on property dispositions, and/or non-recurring SG&A expenses. Neither the timing nor likelihood of these events, nor their probable significance, can be quantified with a reasonable degree of accuracy. Accordingly, a reconciliation of such forward-looking information to the most directly comparable GAAP financial measure is not provided. 13 Please see the below guidance for our current expectations for FY 2025 and Q4 2025.

Appendix: Financial Tables & Non-GAAP Reconciliations
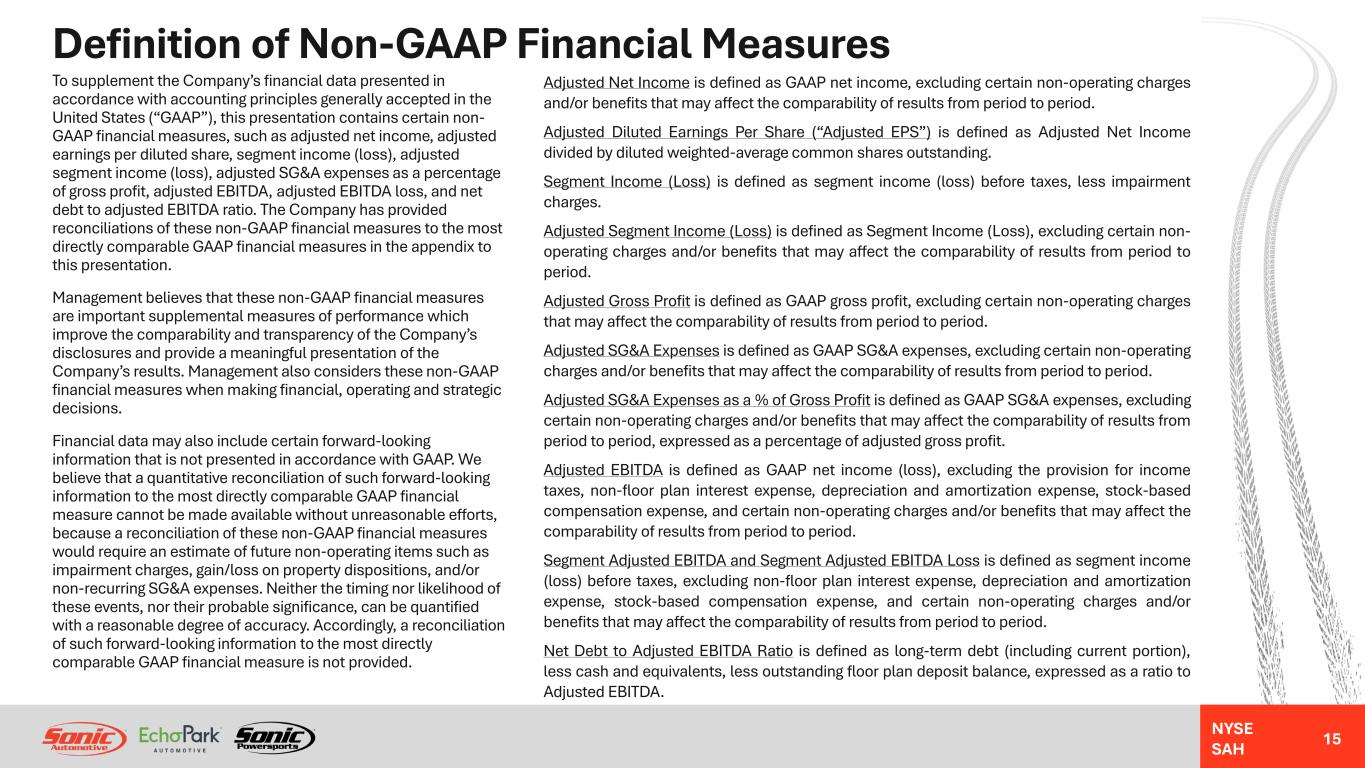
NYSE SAH Definition of Non-GAAP Financial Measures 15 Adjusted Net Income is defined as GAAP net income, excluding certain non-operating charges and/or benefits that may affect the comparability of results from period to period. Adjusted Diluted Earnings Per Share (“Adjusted EPS”) is defined as Adjusted Net Income divided by diluted weighted-average common shares outstanding. Segment Income (Loss) is defined as segment income (loss) before taxes, less impairment charges. Adjusted Segment Income (Loss) is defined as Segment Income (Loss), excluding certain non- operating charges and/or benefits that may affect the comparability of results from period to period. Adjusted Gross Profit is defined as GAAP gross profit, excluding certain non-operating charges that may affect the comparability of results from period to period. Adjusted SG&A Expenses is defined as GAAP SG&A expenses, excluding certain non-operating charges and/or benefits that may affect the comparability of results from period to period. Adjusted SG&A Expenses as a % of Gross Profit is defined as GAAP SG&A expenses, excluding certain non-operating charges and/or benefits that may affect the comparability of results from period to period, expressed as a percentage of adjusted gross profit. Adjusted EBITDA is defined as GAAP net income (loss), excluding the provision for income taxes, non-floor plan interest expense, depreciation and amortization expense, stock-based compensation expense, and certain non-operating charges and/or benefits that may affect the comparability of results from period to period. Segment Adjusted EBITDA and Segment Adjusted EBITDA Loss is defined as segment income (loss) before taxes, excluding non-floor plan interest expense, depreciation and amortization expense, stock-based compensation expense, and certain non-operating charges and/or benefits that may affect the comparability of results from period to period. Net Debt to Adjusted EBITDA Ratio is defined as long-term debt (including current portion), less cash and equivalents, less outstanding floor plan deposit balance, expressed as a ratio to Adjusted EBITDA. To supplement the Company’s financial data presented in accordance with accounting principles generally accepted in the United States (“GAAP”), this presentation contains certain non- GAAP financial measures, such as adjusted net income, adjusted earnings per diluted share, segment income (loss), adjusted segment income (loss), adjusted SG&A expenses as a percentage of gross profit, adjusted EBITDA, adjusted EBITDA loss, and net debt to adjusted EBITDA ratio. The Company has provided reconciliations of these non-GAAP financial measures to the most directly comparable GAAP financial measures in the appendix to this presentation. Management believes that these non-GAAP financial measures are important supplemental measures of performance which improve the comparability and transparency of the Company’s disclosures and provide a meaningful presentation of the Company’s results. Management also considers these non-GAAP financial measures when making financial, operating and strategic decisions. Financial data may also include certain forward-looking information that is not presented in accordance with GAAP. We believe that a quantitative reconciliation of such forward-looking information to the most directly comparable GAAP financial measure cannot be made available without unreasonable efforts, because a reconciliation of these non-GAAP financial measures would require an estimate of future non-operating items such as impairment charges, gain/loss on property dispositions, and/or non-recurring SG&A expenses. Neither the timing nor likelihood of these events, nor their probable significance, can be quantified with a reasonable degree of accuracy. Accordingly, a reconciliation of such forward-looking information to the most directly comparable GAAP financial measure is not provided.
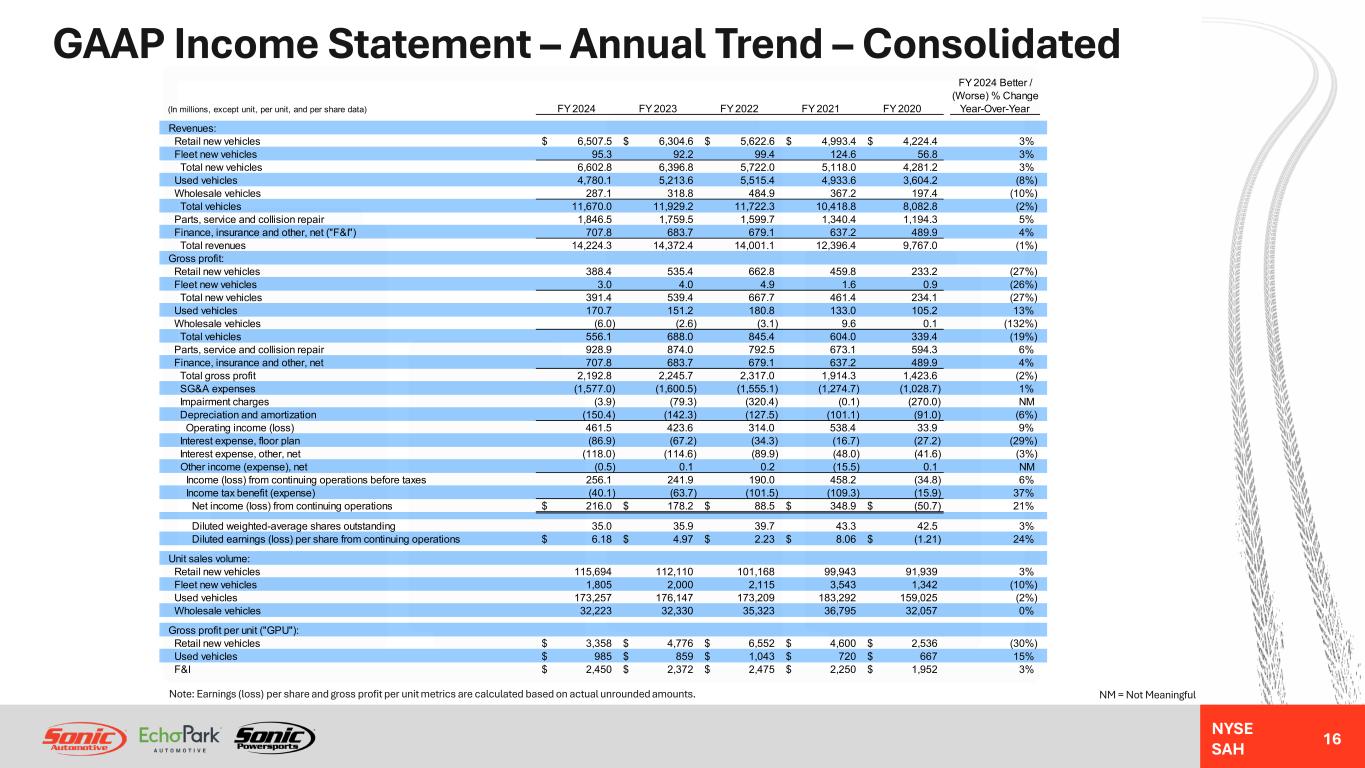
NYSE SAH GAAP Income Statement – Annual Trend – Consolidated 16 NM = Not MeaningfulNote: Earnings (loss) per share and gross profit per unit metrics are calculated based on actual unrounded amounts. FY 2024 Better / (Worse) % Change (In millions, except unit, per unit, and per share data) FY 2024 FY 2023 FY 2022 FY 2021 FY 2020 Year-Over-Year Revenues: Retail new vehicles 6,507.5$ 6,304.6$ 5,622.6$ 4,993.4$ 4,224.4$ 3% Fleet new vehicles 95.3 92.2 99.4 124.6 56.8 3% Total new vehicles 6,602.8 6,396.8 5,722.0 5,118.0 4,281.2 3% Used vehicles 4,780.1 5,213.6 5,515.4 4,933.6 3,604.2 (8%) Wholesale vehicles 287.1 318.8 484.9 367.2 197.4 (10%) Total vehicles 11,670.0 11,929.2 11,722.3 10,418.8 8,082.8 (2%) Parts, service and collision repair 1,846.5 1,759.5 1,599.7 1,340.4 1,194.3 5% Finance, insurance and other, net ("F&I") 707.8 683.7 679.1 637.2 489.9 4% Total revenues 14,224.3 14,372.4 14,001.1 12,396.4 9,767.0 (1%) Gross profit: Retail new vehicles 388.4 535.4 662.8 459.8 233.2 (27%) Fleet new vehicles 3.0 4.0 4.9 1.6 0.9 (26%) Total new vehicles 391.4 539.4 667.7 461.4 234.1 (27%) Used vehicles 170.7 151.2 180.8 133.0 105.2 13% Wholesale vehicles (6.0) (2.6) (3.1) 9.6 0.1 (132%) Total vehicles 556.1 688.0 845.4 604.0 339.4 (19%) Parts, service and collision repair 928.9 874.0 792.5 673.1 594.3 6% Finance, insurance and other, net 707.8 683.7 679.1 637.2 489.9 4% Total gross profit 2,192.8 2,245.7 2,317.0 1,914.3 1,423.6 (2%) SG&A expenses (1,577.0) (1,600.5) (1,555.1) (1,274.7) (1,028.7) 1% Impairment charges (3.9) (79.3) (320.4) (0.1) (270.0) NM Depreciation and amortization (150.4) (142.3) (127.5) (101.1) (91.0) (6%) Operating income (loss) 461.5 423.6 314.0 538.4 33.9 9% Interest expense, floor plan (86.9) (67.2) (34.3) (16.7) (27.2) (29%) Interest expense, other, net (118.0) (114.6) (89.9) (48.0) (41.6) (3%) Other income (expense), net (0.5) 0.1 0.2 (15.5) 0.1 NM Income (loss) from continuing operations before taxes 256.1 241.9 190.0 458.2 (34.8) 6% Income tax benefit (expense) (40.1) (63.7) (101.5) (109.3) (15.9) 37% Net income (loss) from continuing operations 216.0$ 178.2$ 88.5$ 348.9$ (50.7)$ 21% Diluted weighted-average shares outstanding 35.0 35.9 39.7 43.3 42.5 3% Diluted earnings (loss) per share from continuing operations 6.18$ 4.97$ 2.23$ 8.06$ (1.21)$ 24% Unit sales volume: Retail new vehicles 115,694 112,110 101,168 99,943 91,939 3% Fleet new vehicles 1,805 2,000 2,115 3,543 1,342 (10%) Used vehicles 173,257 176,147 173,209 183,292 159,025 (2%) Wholesale vehicles 32,223 32,330 35,323 36,795 32,057 0% Gross profit per unit ("GPU"): Retail new vehicles 3,358$ 4,776$ 6,552$ 4,600$ 2,536$ (30%) Used vehicles 985$ 859$ 1,043$ 720$ 667$ 15% F&I 2,450$ 2,372$ 2,475$ 2,250$ 1,952$ 3%
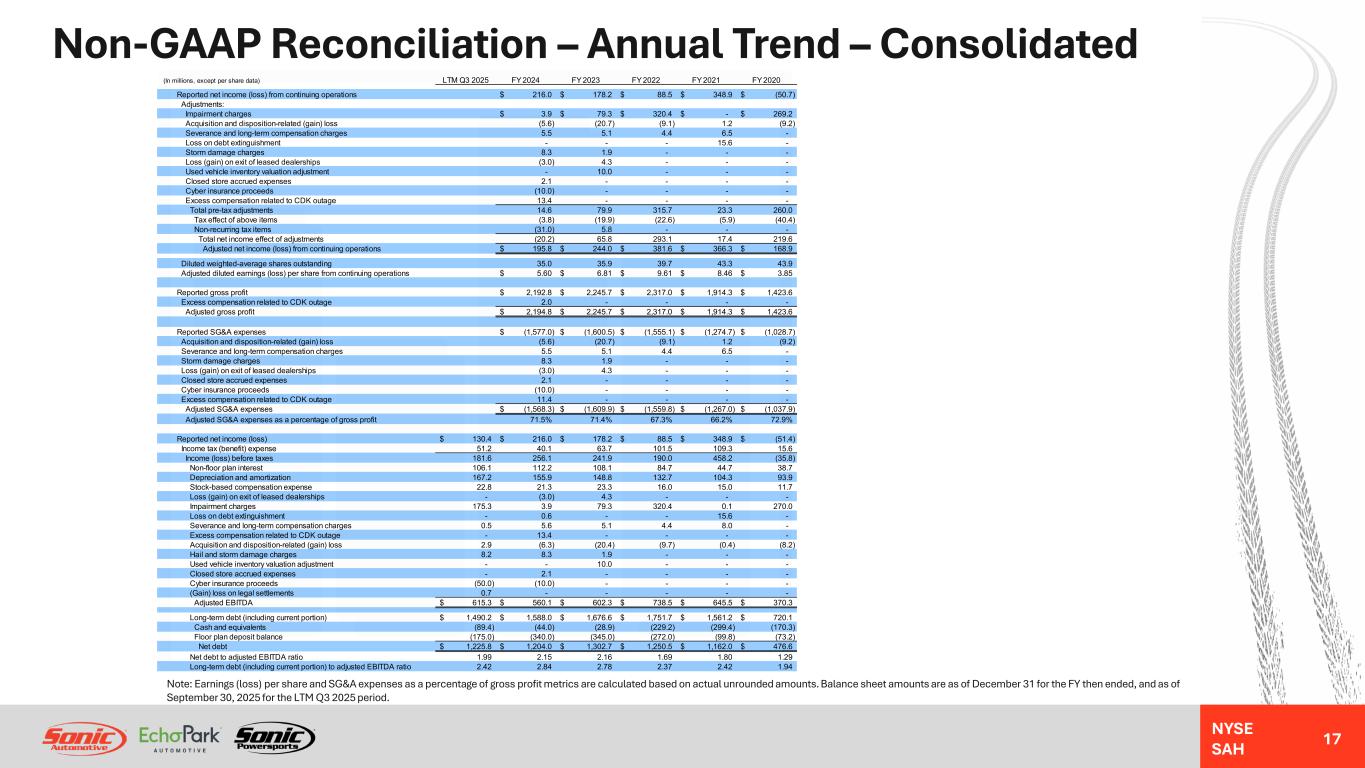
NYSE SAH Non-GAAP Reconciliation – Annual Trend – Consolidated 17 Note: Earnings (loss) per share and SG&A expenses as a percentage of gross profit metrics are calculated based on actual unrounded amounts. Balance sheet amounts are as of December 31 for the FY then ended, and as of September 30, 2025 for the LTM Q3 2025 period. (In millions, except per share data) LTM Q3 2025 FY 2024 FY 2023 FY 2022 FY 2021 FY 2020 Reported net income (loss) from continuing operations 216.0$ 178.2$ 88.5$ 348.9$ (50.7)$ Adjustments: Impairment charges 3.9$ 79.3$ 320.4$ -$ 269.2$ Acquisition and disposition-related (gain) loss (5.6) (20.7) (9.1) 1.2 (9.2) Severance and long-term compensation charges 5.5 5.1 4.4 6.5 - Loss on debt extinguishment - - - 15.6 - Storm damage charges 8.3 1.9 - - - Loss (gain) on exit of leased dealerships (3.0) 4.3 - - - Used vehicle inventory valuation adjustment - 10.0 - - - Closed store accrued expenses 2.1 - - - - Cyber insurance proceeds (10.0) - - - - Excess compensation related to CDK outage 13.4 - - - - Total pre-tax adjustments 14.6 79.9 315.7 23.3 260.0 Tax effect of above items (3.8) (19.9) (22.6) (5.9) (40.4) Non-recurring tax items (31.0) 5.8 - - - Total net income effect of adjustments (20.2) 65.8 293.1 17.4 219.6 Adjusted net income (loss) from continuing operations 195.8$ 244.0$ 381.6$ 366.3$ 168.9$ Diluted weighted-average shares outstanding 35.0 35.9 39.7 43.3 43.9 Adjusted diluted earnings (loss) per share from continuing operations 5.60$ 6.81$ 9.61$ 8.46$ 3.85$ Reported gross profit 2,192.8$ 2,245.7$ 2,317.0$ 1,914.3$ 1,423.6$ Excess compensation related to CDK outage 2.0 - - - - Adjusted gross profit 2,194.8$ 2,245.7$ 2,317.0$ 1,914.3$ 1,423.6$ Reported SG&A expenses (1,577.0)$ (1,600.5)$ (1,555.1)$ (1,274.7)$ (1,028.7)$ Acquisition and disposition-related (gain) loss (5.6) (20.7) (9.1) 1.2 (9.2) Severance and long-term compensation charges 5.5 5.1 4.4 6.5 - Storm damage charges 8.3 1.9 - - - Loss (gain) on exit of leased dealerships (3.0) 4.3 - - - Closed store accrued expenses 2.1 - - - - Cyber insurance proceeds (10.0) - - - - Excess compensation related to CDK outage 11.4 - - - - Adjusted SG&A expenses (1,568.3)$ (1,609.9)$ (1,559.8)$ (1,267.0)$ (1,037.9)$ Adjusted SG&A expenses as a percentage of gross profit 71.5% 71.4% 67.3% 66.2% 72.9% Reported net income (loss) 130.4$ 216.0$ 178.2$ 88.5$ 348.9$ (51.4)$ Income tax (benefit) expense 51.2 40.1 63.7 101.5 109.3 15.6 Income (loss) before taxes 181.6 256.1 241.9 190.0 458.2 (35.8) Non-floor plan interest 106.1 112.2 108.1 84.7 44.7 38.7 Depreciation and amortization 167.2 155.9 148.8 132.7 104.3 93.9 Stock-based compensation expense 22.8 21.3 23.3 16.0 15.0 11.7 Loss (gain) on exit of leased dealerships - (3.0) 4.3 - - - Impairment charges 175.3 3.9 79.3 320.4 0.1 270.0 Loss on debt extinguishment - 0.6 - - 15.6 - Severance and long-term compensation charges 0.5 5.6 5.1 4.4 8.0 - Excess compensation related to CDK outage - 13.4 - - - - Acquisition and disposition-related (gain) loss 2.9 (6.3) (20.4) (9.7) (0.4) (8.2) Hail and storm damage charges 8.2 8.3 1.9 - - - Used vehicle inventory valuation adjustment - - 10.0 - - - Closed store accrued expenses - 2.1 - - - - Cyber insurance proceeds (50.0) (10.0) - - - - (Gain) loss on legal settlements 0.7 - - - - - Adjusted EBITDA 615.3$ 560.1$ 602.3$ 738.5$ 645.5$ 370.3$ Long-term debt (including current portion) 1,490.2$ 1,588.0$ 1,676.6$ 1,751.7$ 1,561.2$ 720.1$ Cash and equivalents (89.4) (44.0) (28.9) (229.2) (299.4) (170.3) Floor plan deposit balance (175.0) (340.0) (345.0) (272.0) (99.8) (73.2) Net debt 1,225.8$ 1,204.0$ 1,302.7$ 1,250.5$ 1,162.0$ 476.6$ Net debt to adjusted EBITDA ratio 1.99 2.15 2.16 1.69 1.80 1.29 Long-term debt (including current portion) to adjusted EBITDA ratio 2.42 2.84 2.78 2.37 2.42 1.94
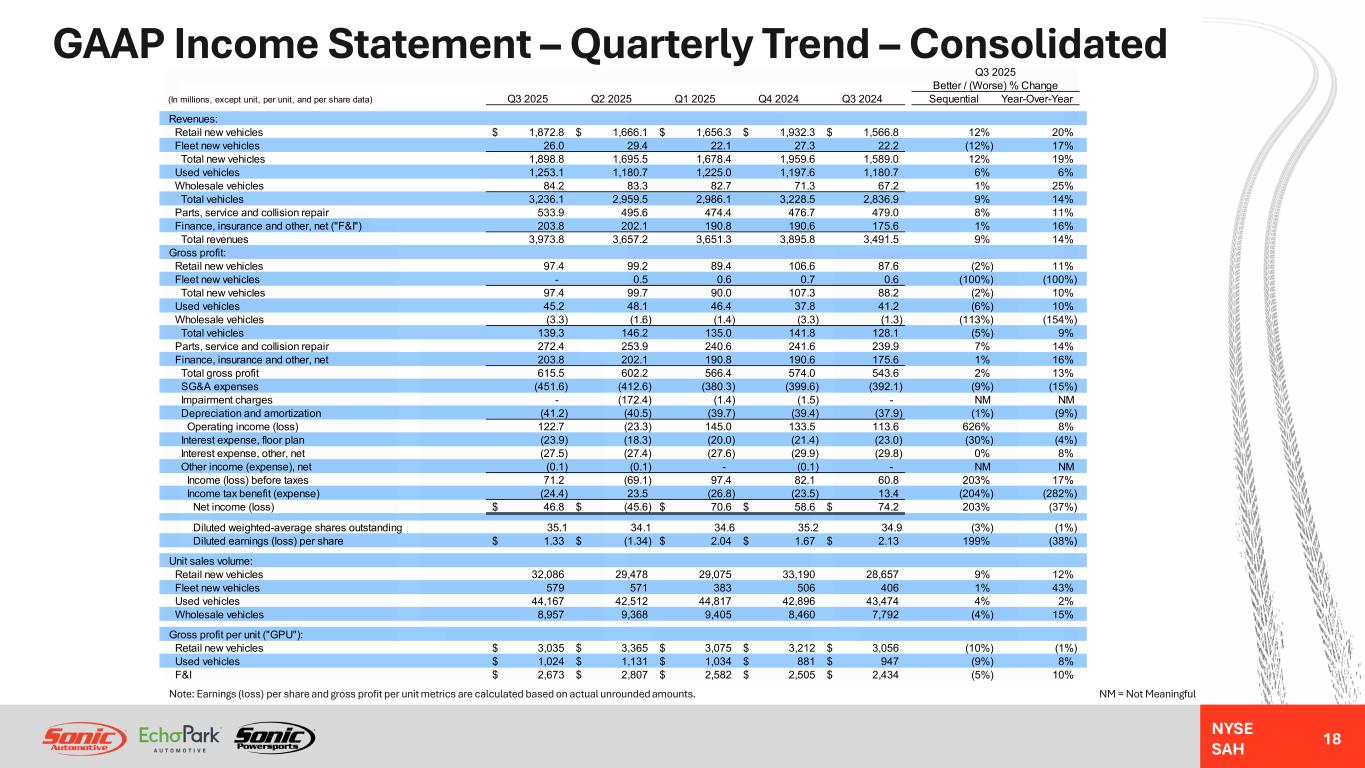
NYSE SAH GAAP Income Statement – Quarterly Trend – Consolidated 18 NM = Not MeaningfulNote: Earnings (loss) per share and gross profit per unit metrics are calculated based on actual unrounded amounts. Q3 2025 Better / (Worse) % Change (In millions, except unit, per unit, and per share data) Q3 2025 Q2 2025 Q1 2025 Q4 2024 Q3 2024 Sequential Year-Over-Year Revenues: Retail new vehicles 1,872.8$ 1,666.1$ 1,656.3$ 1,932.3$ 1,566.8$ 12% 20% Fleet new vehicles 26.0 29.4 22.1 27.3 22.2 (12%) 17% Total new vehicles 1,898.8 1,695.5 1,678.4 1,959.6 1,589.0 12% 19% Used vehicles 1,253.1 1,180.7 1,225.0 1,197.6 1,180.7 6% 6% Wholesale vehicles 84.2 83.3 82.7 71.3 67.2 1% 25% Total vehicles 3,236.1 2,959.5 2,986.1 3,228.5 2,836.9 9% 14% Parts, service and collision repair 533.9 495.6 474.4 476.7 479.0 8% 11% Finance, insurance and other, net ("F&I") 203.8 202.1 190.8 190.6 175.6 1% 16% Total revenues 3,973.8 3,657.2 3,651.3 3,895.8 3,491.5 9% 14% Gross profit: Retail new vehicles 97.4 99.2 89.4 106.6 87.6 (2%) 11% Fleet new vehicles - 0.5 0.6 0.7 0.6 (100%) (100%) Total new vehicles 97.4 99.7 90.0 107.3 88.2 (2%) 10% Used vehicles 45.2 48.1 46.4 37.8 41.2 (6%) 10% Wholesale vehicles (3.3) (1.6) (1.4) (3.3) (1.3) (113%) (154%) Total vehicles 139.3 146.2 135.0 141.8 128.1 (5%) 9% Parts, service and collision repair 272.4 253.9 240.6 241.6 239.9 7% 14% Finance, insurance and other, net 203.8 202.1 190.8 190.6 175.6 1% 16% Total gross profit 615.5 602.2 566.4 574.0 543.6 2% 13% SG&A expenses (451.6) (412.6) (380.3) (399.6) (392.1) (9%) (15%) Impairment charges - (172.4) (1.4) (1.5) - NM NM Depreciation and amortization (41.2) (40.5) (39.7) (39.4) (37.9) (1%) (9%) Operating income (loss) 122.7 (23.3) 145.0 133.5 113.6 626% 8% Interest expense, floor plan (23.9) (18.3) (20.0) (21.4) (23.0) (30%) (4%) Interest expense, other, net (27.5) (27.4) (27.6) (29.9) (29.8) 0% 8% Other income (expense), net (0.1) (0.1) - (0.1) - NM NM Income (loss) before taxes 71.2 (69.1) 97.4 82.1 60.8 203% 17% Income tax benefit (expense) (24.4) 23.5 (26.8) (23.5) 13.4 (204%) (282%) Net income (loss) 46.8$ (45.6)$ 70.6$ 58.6$ 74.2$ 203% (37%) Diluted weighted-average shares outstanding 35.1 34.1 34.6 35.2 34.9 (3%) (1%) Diluted earnings (loss) per share 1.33$ (1.34)$ 2.04$ 1.67$ 2.13$ 199% (38%) Unit sales volume: Retail new vehicles 32,086 29,478 29,075 33,190 28,657 9% 12% Fleet new vehicles 579 571 383 506 406 1% 43% Used vehicles 44,167 42,512 44,817 42,896 43,474 4% 2% Wholesale vehicles 8,957 9,368 9,405 8,460 7,792 (4%) 15% Gross profit per unit ("GPU"): Retail new vehicles 3,035$ 3,365$ 3,075$ 3,212$ 3,056$ (10%) (1%) Used vehicles 1,024$ 1,131$ 1,034$ 881$ 947$ (9%) 8% F&I 2,673$ 2,807$ 2,582$ 2,505$ 2,434$ (5%) 10%
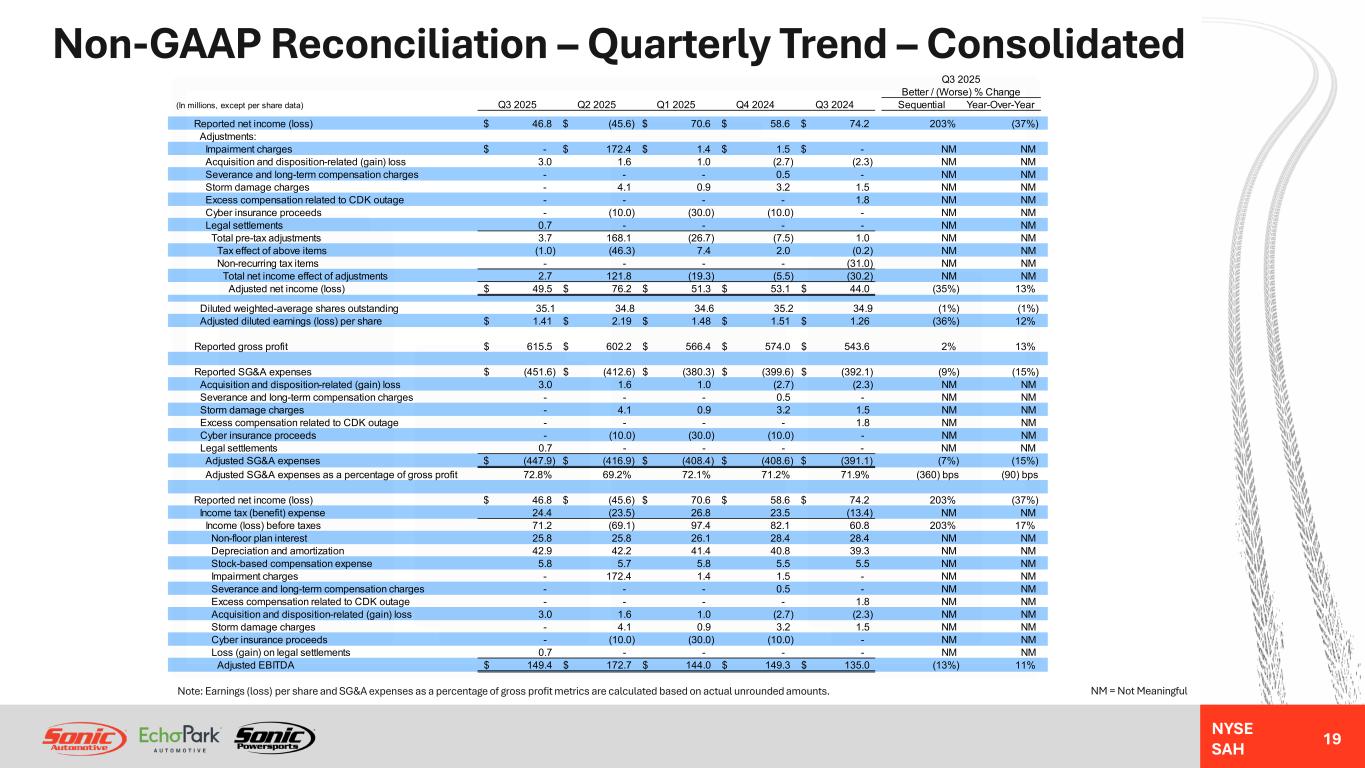
NYSE SAH Non-GAAP Reconciliation – Quarterly Trend – Consolidated 19 NM = Not MeaningfulNote: Earnings (loss) per share and SG&A expenses as a percentage of gross profit metrics are calculated based on actual unrounded amounts. Q3 2025 Better / (Worse) % Change (In millions, except per share data) Q3 2025 Q2 2025 Q1 2025 Q4 2024 Q3 2024 Sequential Year-Over-Year Reported net income (loss) 46.8$ (45.6)$ 70.6$ 58.6$ 74.2$ 203% (37%) Adjustments: Impairment charges -$ 172.4$ 1.4$ 1.5$ -$ NM NM Acquisition and disposition-related (gain) loss 3.0 1.6 1.0 (2.7) (2.3) NM NM Severance and long-term compensation charges - - - 0.5 - NM NM Storm damage charges - 4.1 0.9 3.2 1.5 NM NM Excess compensation related to CDK outage - - - - 1.8 NM NM Cyber insurance proceeds - (10.0) (30.0) (10.0) - NM NM Legal settlements 0.7 - - - - NM NM Total pre-tax adjustments 3.7 168.1 (26.7) (7.5) 1.0 NM NM Tax effect of above items (1.0) (46.3) 7.4 2.0 (0.2) NM NM Non-recurring tax items - - - - (31.0) NM NM Total net income effect of adjustments 2.7 121.8 (19.3) (5.5) (30.2) NM NM Adjusted net income (loss) 49.5$ 76.2$ 51.3$ 53.1$ 44.0$ (35%) 13% Diluted weighted-average shares outstanding 35.1 34.8 34.6 35.2 34.9 (1%) (1%) Adjusted diluted earnings (loss) per share 1.41$ 2.19$ 1.48$ 1.51$ 1.26$ (36%) 12% Reported gross profit 615.5$ 602.2$ 566.4$ 574.0$ 543.6$ 2% 13% Reported SG&A expenses (451.6)$ (412.6)$ (380.3)$ (399.6)$ (392.1)$ (9%) (15%) Acquisition and disposition-related (gain) loss 3.0 1.6 1.0 (2.7) (2.3) NM NM Severance and long-term compensation charges - - - 0.5 - NM NM Storm damage charges - 4.1 0.9 3.2 1.5 NM NM Excess compensation related to CDK outage - - - - 1.8 NM NM Cyber insurance proceeds - (10.0) (30.0) (10.0) - NM NM Legal settlements 0.7 - - - - NM NM Adjusted SG&A expenses (447.9)$ (416.9)$ (408.4)$ (408.6)$ (391.1)$ (7%) (15%) Adjusted SG&A expenses as a percentage of gross profit 72.8% 69.2% 72.1% 71.2% 71.9% (360) bps (90) bps Reported net income (loss) 46.8$ (45.6)$ 70.6$ 58.6$ 74.2$ 203% (37%) Income tax (benefit) expense 24.4 (23.5) 26.8 23.5 (13.4) NM NM Income (loss) before taxes 71.2 (69.1) 97.4 82.1 60.8 203% 17% Non-floor plan interest 25.8 25.8 26.1 28.4 28.4 NM NM Depreciation and amortization 42.9 42.2 41.4 40.8 39.3 NM NM Stock-based compensation expense 5.8 5.7 5.8 5.5 5.5 NM NM Impairment charges - 172.4 1.4 1.5 - NM NM Severance and long-term compensation charges - - - 0.5 - NM NM Excess compensation related to CDK outage - - - - 1.8 NM NM Acquisition and disposition-related (gain) loss 3.0 1.6 1.0 (2.7) (2.3) NM NM Storm damage charges - 4.1 0.9 3.2 1.5 NM NM Cyber insurance proceeds - (10.0) (30.0) (10.0) - NM NM Loss (gain) on legal settlements 0.7 - - - - NM NM Adjusted EBITDA 149.4$ 172.7$ 144.0$ 149.3$ 135.0$ (13%) 11%
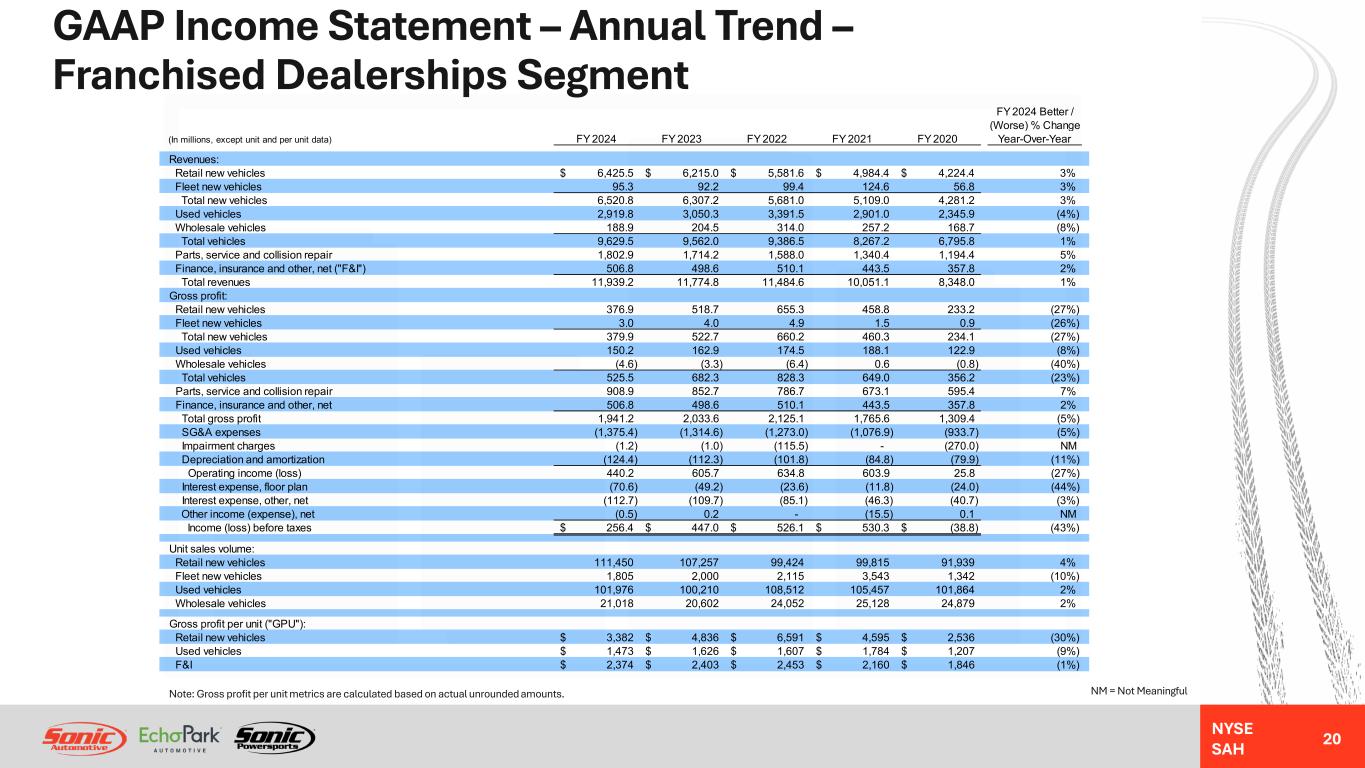
NYSE SAH GAAP Income Statement – Annual Trend – Franchised Dealerships Segment 20 NM = Not MeaningfulNote: Gross profit per unit metrics are calculated based on actual unrounded amounts. FY 2024 Better / (Worse) % Change (In millions, except unit and per unit data) FY 2024 FY 2023 FY 2022 FY 2021 FY 2020 Year-Over-Year Revenues: Retail new vehicles 6,425.5$ 6,215.0$ 5,581.6$ 4,984.4$ 4,224.4$ 3% Fleet new vehicles 95.3 92.2 99.4 124.6 56.8 3% Total new vehicles 6,520.8 6,307.2 5,681.0 5,109.0 4,281.2 3% Used vehicles 2,919.8 3,050.3 3,391.5 2,901.0 2,345.9 (4%) Wholesale vehicles 188.9 204.5 314.0 257.2 168.7 (8%) Total vehicles 9,629.5 9,562.0 9,386.5 8,267.2 6,795.8 1% Parts, service and collision repair 1,802.9 1,714.2 1,588.0 1,340.4 1,194.4 5% Finance, insurance and other, net ("F&I") 506.8 498.6 510.1 443.5 357.8 2% Total revenues 11,939.2 11,774.8 11,484.6 10,051.1 8,348.0 1% Gross profit: Retail new vehicles 376.9 518.7 655.3 458.8 233.2 (27%) Fleet new vehicles 3.0 4.0 4.9 1.5 0.9 (26%) Total new vehicles 379.9 522.7 660.2 460.3 234.1 (27%) Used vehicles 150.2 162.9 174.5 188.1 122.9 (8%) Wholesale vehicles (4.6) (3.3) (6.4) 0.6 (0.8) (40%) Total vehicles 525.5 682.3 828.3 649.0 356.2 (23%) Parts, service and collision repair 908.9 852.7 786.7 673.1 595.4 7% Finance, insurance and other, net 506.8 498.6 510.1 443.5 357.8 2% Total gross profit 1,941.2 2,033.6 2,125.1 1,765.6 1,309.4 (5%) SG&A expenses (1,375.4) (1,314.6) (1,273.0) (1,076.9) (933.7) (5%) Impairment charges (1.2) (1.0) (115.5) - (270.0) NM Depreciation and amortization (124.4) (112.3) (101.8) (84.8) (79.9) (11%) Operating income (loss) 440.2 605.7 634.8 603.9 25.8 (27%) Interest expense, floor plan (70.6) (49.2) (23.6) (11.8) (24.0) (44%) Interest expense, other, net (112.7) (109.7) (85.1) (46.3) (40.7) (3%) Other income (expense), net (0.5) 0.2 - (15.5) 0.1 NM Income (loss) before taxes 256.4$ 447.0$ 526.1$ 530.3$ (38.8)$ (43%) Unit sales volume: Retail new vehicles 111,450 107,257 99,424 99,815 91,939 4% Fleet new vehicles 1,805 2,000 2,115 3,543 1,342 (10%) Used vehicles 101,976 100,210 108,512 105,457 101,864 2% Wholesale vehicles 21,018 20,602 24,052 25,128 24,879 2% Gross profit per unit ("GPU"): Retail new vehicles 3,382$ 4,836$ 6,591$ 4,595$ 2,536$ (30%) Used vehicles 1,473$ 1,626$ 1,607$ 1,784$ 1,207$ (9%) F&I 2,374$ 2,403$ 2,453$ 2,160$ 1,846$ (1%)
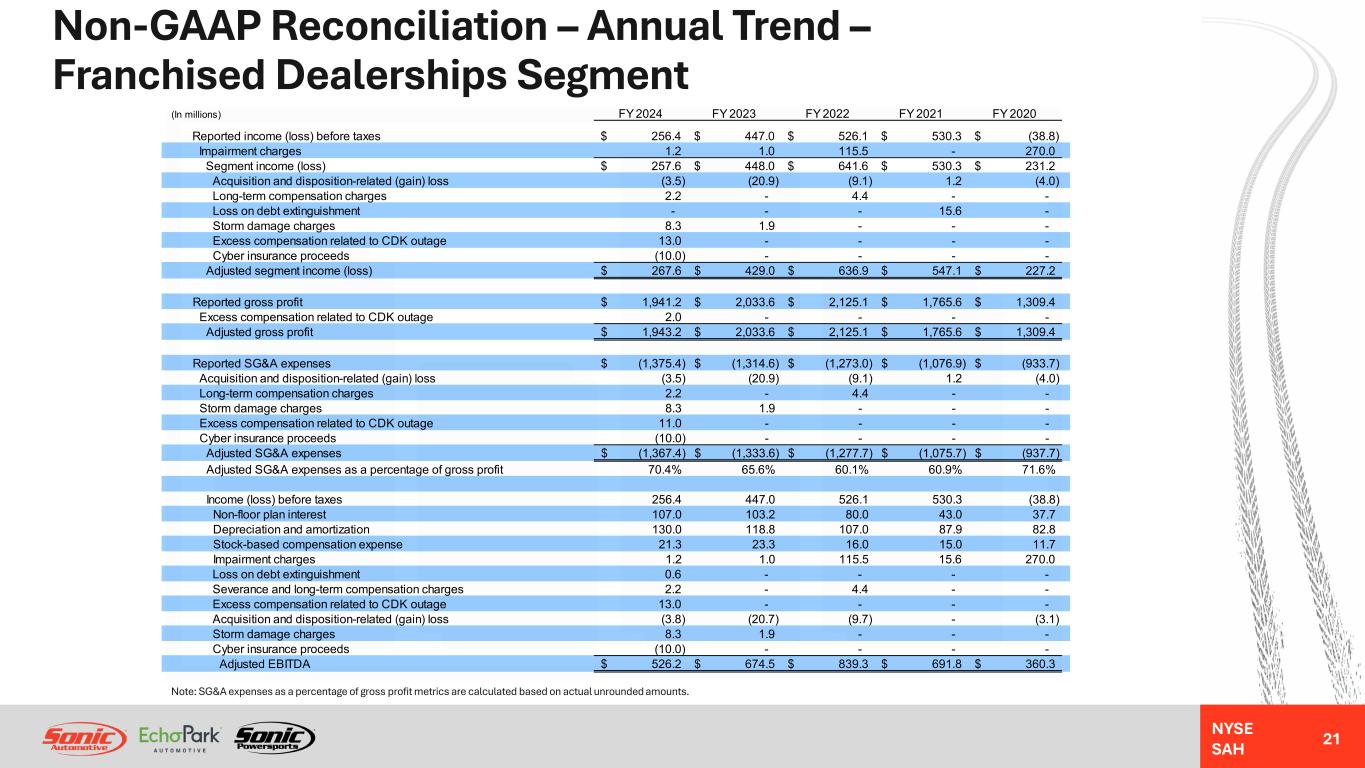
NYSE SAH Non-GAAP Reconciliation – Annual Trend – Franchised Dealerships Segment 21 Note: SG&A expenses as a percentage of gross profit metrics are calculated based on actual unrounded amounts. (In millions) FY 2024 FY 2023 FY 2022 FY 2021 FY 2020 Reported income (loss) before taxes 256.4$ 447.0$ 526.1$ 530.3$ (38.8)$ Impairment charges 1.2 1.0 115.5 - 270.0 Segment income (loss) 257.6$ 448.0$ 641.6$ 530.3$ 231.2$ Acquisition and disposition-related (gain) loss (3.5) (20.9) (9.1) 1.2 (4.0) Long-term compensation charges 2.2 - 4.4 - - Loss on debt extinguishment - - - 15.6 - Storm damage charges 8.3 1.9 - - - Excess compensation related to CDK outage 13.0 - - - - Cyber insurance proceeds (10.0) - - - - Adjusted segment income (loss) 267.6$ 429.0$ 636.9$ 547.1$ 227.2$ Reported gross profit 1,941.2$ 2,033.6$ 2,125.1$ 1,765.6$ 1,309.4$ Excess compensation related to CDK outage 2.0 - - - - Adjusted gross profit 1,943.2$ 2,033.6$ 2,125.1$ 1,765.6$ 1,309.4$ Reported SG&A expenses (1,375.4)$ (1,314.6)$ (1,273.0)$ (1,076.9)$ (933.7)$ Acquisition and disposition-related (gain) loss (3.5) (20.9) (9.1) 1.2 (4.0) Long-term compensation charges 2.2 - 4.4 - - Storm damage charges 8.3 1.9 - - - Excess compensation related to CDK outage 11.0 - - - - Cyber insurance proceeds (10.0) - - - - Adjusted SG&A expenses (1,367.4)$ (1,333.6)$ (1,277.7)$ (1,075.7)$ (937.7)$ Adjusted SG&A expenses as a percentage of gross profit 70.4% 65.6% 60.1% 60.9% 71.6% Income (loss) before taxes 256.4 447.0 526.1 530.3 (38.8) Non-floor plan interest 107.0 103.2 80.0 43.0 37.7 Depreciation and amortization 130.0 118.8 107.0 87.9 82.8 Stock-based compensation expense 21.3 23.3 16.0 15.0 11.7 Impairment charges 1.2 1.0 115.5 15.6 270.0 Loss on debt extinguishment 0.6 - - - - Severance and long-term compensation charges 2.2 - 4.4 - - Excess compensation related to CDK outage 13.0 - - - - Acquisition and disposition-related (gain) loss (3.8) (20.7) (9.7) - (3.1) Storm damage charges 8.3 1.9 - - - Cyber insurance proceeds (10.0) - - - - Adjusted EBITDA 526.2$ 674.5$ 839.3$ 691.8$ 360.3$
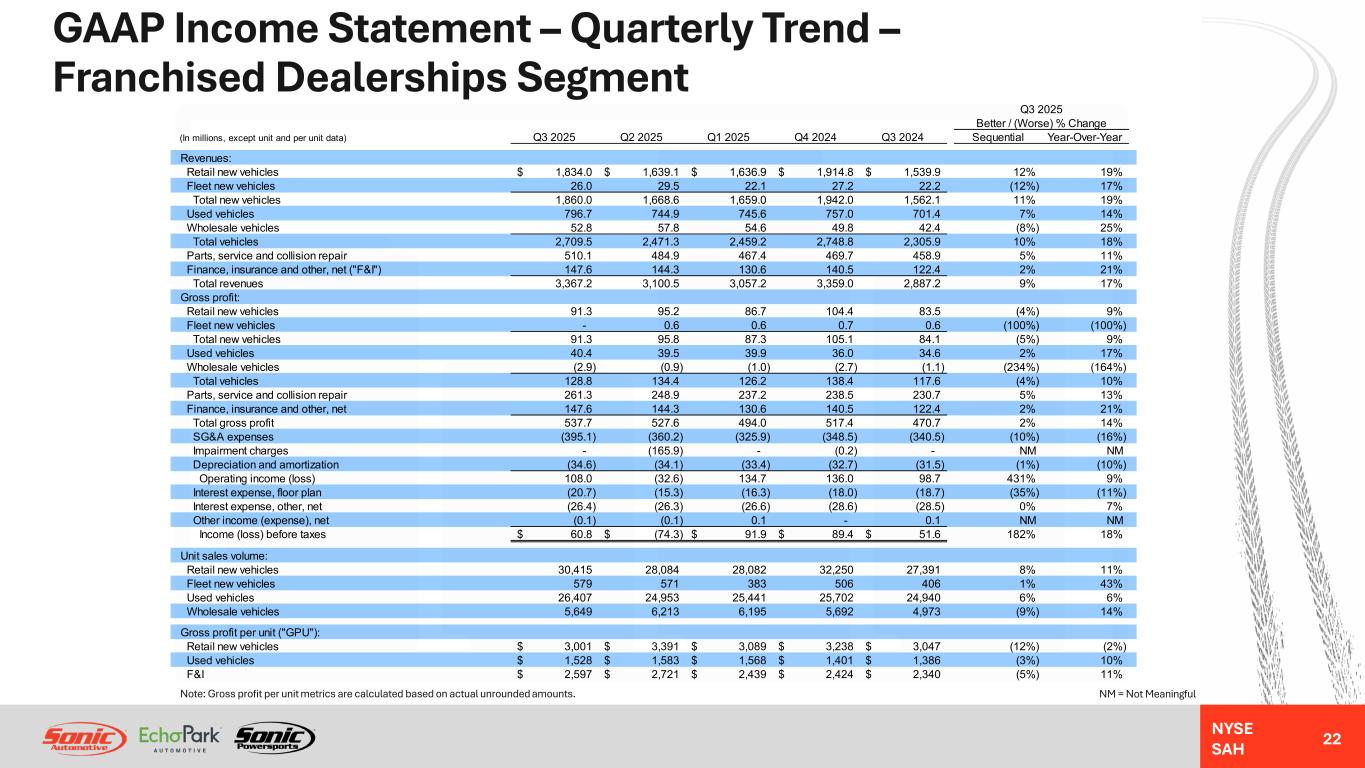
NYSE SAH GAAP Income Statement – Quarterly Trend – Franchised Dealerships Segment 22 NM = Not MeaningfulNote: Gross profit per unit metrics are calculated based on actual unrounded amounts. Q3 2025 Better / (Worse) % Change (In millions, except unit and per unit data) Q3 2025 Q2 2025 Q1 2025 Q4 2024 Q3 2024 Sequential Year-Over-Year Revenues: Retail new vehicles 1,834.0$ 1,639.1$ 1,636.9$ 1,914.8$ 1,539.9$ 12% 19% Fleet new vehicles 26.0 29.5 22.1 27.2 22.2 (12%) 17% Total new vehicles 1,860.0 1,668.6 1,659.0 1,942.0 1,562.1 11% 19% Used vehicles 796.7 744.9 745.6 757.0 701.4 7% 14% Wholesale vehicles 52.8 57.8 54.6 49.8 42.4 (8%) 25% Total vehicles 2,709.5 2,471.3 2,459.2 2,748.8 2,305.9 10% 18% Parts, service and collision repair 510.1 484.9 467.4 469.7 458.9 5% 11% Finance, insurance and other, net ("F&I") 147.6 144.3 130.6 140.5 122.4 2% 21% Total revenues 3,367.2 3,100.5 3,057.2 3,359.0 2,887.2 9% 17% Gross profit: Retail new vehicles 91.3 95.2 86.7 104.4 83.5 (4%) 9% Fleet new vehicles - 0.6 0.6 0.7 0.6 (100%) (100%) Total new vehicles 91.3 95.8 87.3 105.1 84.1 (5%) 9% Used vehicles 40.4 39.5 39.9 36.0 34.6 2% 17% Wholesale vehicles (2.9) (0.9) (1.0) (2.7) (1.1) (234%) (164%) Total vehicles 128.8 134.4 126.2 138.4 117.6 (4%) 10% Parts, service and collision repair 261.3 248.9 237.2 238.5 230.7 5% 13% Finance, insurance and other, net 147.6 144.3 130.6 140.5 122.4 2% 21% Total gross profit 537.7 527.6 494.0 517.4 470.7 2% 14% SG&A expenses (395.1) (360.2) (325.9) (348.5) (340.5) (10%) (16%) Impairment charges - (165.9) - (0.2) - NM NM Depreciation and amortization (34.6) (34.1) (33.4) (32.7) (31.5) (1%) (10%) Operating income (loss) 108.0 (32.6) 134.7 136.0 98.7 431% 9% Interest expense, floor plan (20.7) (15.3) (16.3) (18.0) (18.7) (35%) (11%) Interest expense, other, net (26.4) (26.3) (26.6) (28.6) (28.5) 0% 7% Other income (expense), net (0.1) (0.1) 0.1 - 0.1 NM NM Income (loss) before taxes 60.8$ (74.3)$ 91.9$ 89.4$ 51.6$ 182% 18% Unit sales volume: Retail new vehicles 30,415 28,084 28,082 32,250 27,391 8% 11% Fleet new vehicles 579 571 383 506 406 1% 43% Used vehicles 26,407 24,953 25,441 25,702 24,940 6% 6% Wholesale vehicles 5,649 6,213 6,195 5,692 4,973 (9%) 14% Gross profit per unit ("GPU"): Retail new vehicles 3,001$ 3,391$ 3,089$ 3,238$ 3,047$ (12%) (2%) Used vehicles 1,528$ 1,583$ 1,568$ 1,401$ 1,386$ (3%) 10% F&I 2,597$ 2,721$ 2,439$ 2,424$ 2,340$ (5%) 11%
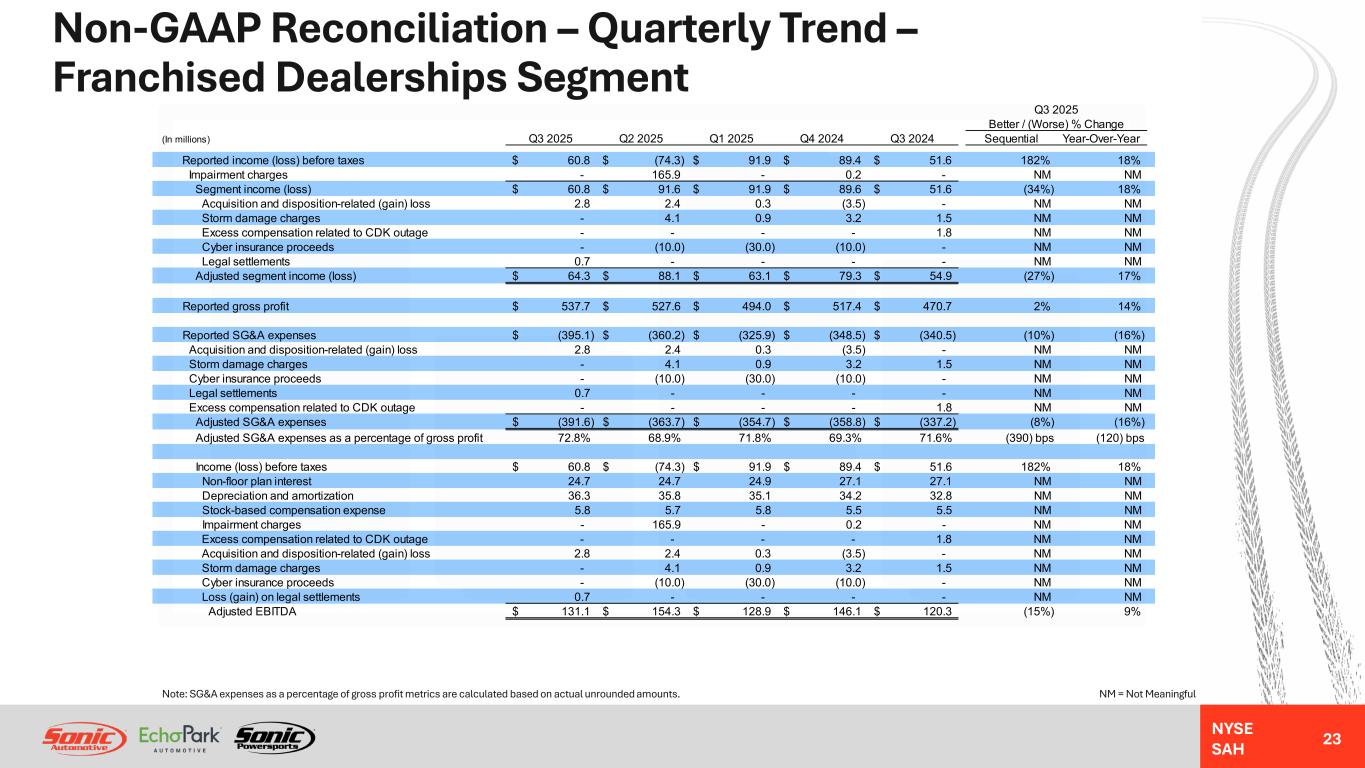
NYSE SAH Non-GAAP Reconciliation – Quarterly Trend – Franchised Dealerships Segment 23 NM = Not MeaningfulNote: SG&A expenses as a percentage of gross profit metrics are calculated based on actual unrounded amounts. Q3 2025 Better / (Worse) % Change (In millions) Q3 2025 Q2 2025 Q1 2025 Q4 2024 Q3 2024 Sequential Year-Over-Year Reported income (loss) before taxes 60.8$ (74.3)$ 91.9$ 89.4$ 51.6$ 182% 18% Impairment charges - 165.9 - 0.2 - NM NM Segment income (loss) 60.8$ 91.6$ 91.9$ 89.6$ 51.6$ (34%) 18% Acquisition and disposition-related (gain) loss 2.8 2.4 0.3 (3.5) - NM NM Storm damage charges - 4.1 0.9 3.2 1.5 NM NM Excess compensation related to CDK outage - - - - 1.8 NM NM Cyber insurance proceeds - (10.0) (30.0) (10.0) - NM NM Legal settlements 0.7 - - - - NM NM Adjusted segment income (loss) 64.3$ 88.1$ 63.1$ 79.3$ 54.9$ (27%) 17% Reported gross profit 537.7$ 527.6$ 494.0$ 517.4$ 470.7$ 2% 14% Reported SG&A expenses (395.1)$ (360.2)$ (325.9)$ (348.5)$ (340.5)$ (10%) (16%) Acquisition and disposition-related (gain) loss 2.8 2.4 0.3 (3.5) - NM NM Storm damage charges - 4.1 0.9 3.2 1.5 NM NM Cyber insurance proceeds - (10.0) (30.0) (10.0) - NM NM Legal settlements 0.7 - - - - NM NM Excess compensation related to CDK outage - - - - 1.8 NM NM Adjusted SG&A expenses (391.6)$ (363.7)$ (354.7)$ (358.8)$ (337.2)$ (8%) (16%) Adjusted SG&A expenses as a percentage of gross profit 72.8% 68.9% 71.8% 69.3% 71.6% (390) bps (120) bps Income (loss) before taxes 60.8$ (74.3)$ 91.9$ 89.4$ 51.6$ 182% 18% Non-floor plan interest 24.7 24.7 24.9 27.1 27.1 NM NM Depreciation and amortization 36.3 35.8 35.1 34.2 32.8 NM NM Stock-based compensation expense 5.8 5.7 5.8 5.5 5.5 NM NM Impairment charges - 165.9 - 0.2 - NM NM Excess compensation related to CDK outage - - - - 1.8 NM NM Acquisition and disposition-related (gain) loss 2.8 2.4 0.3 (3.5) - NM NM Storm damage charges - 4.1 0.9 3.2 1.5 NM NM Cyber insurance proceeds - (10.0) (30.0) (10.0) - NM NM Loss (gain) on legal settlements 0.7 - - - - NM NM Adjusted EBITDA 131.1$ 154.3$ 128.9$ 146.1$ 120.3$ (15%) 9%
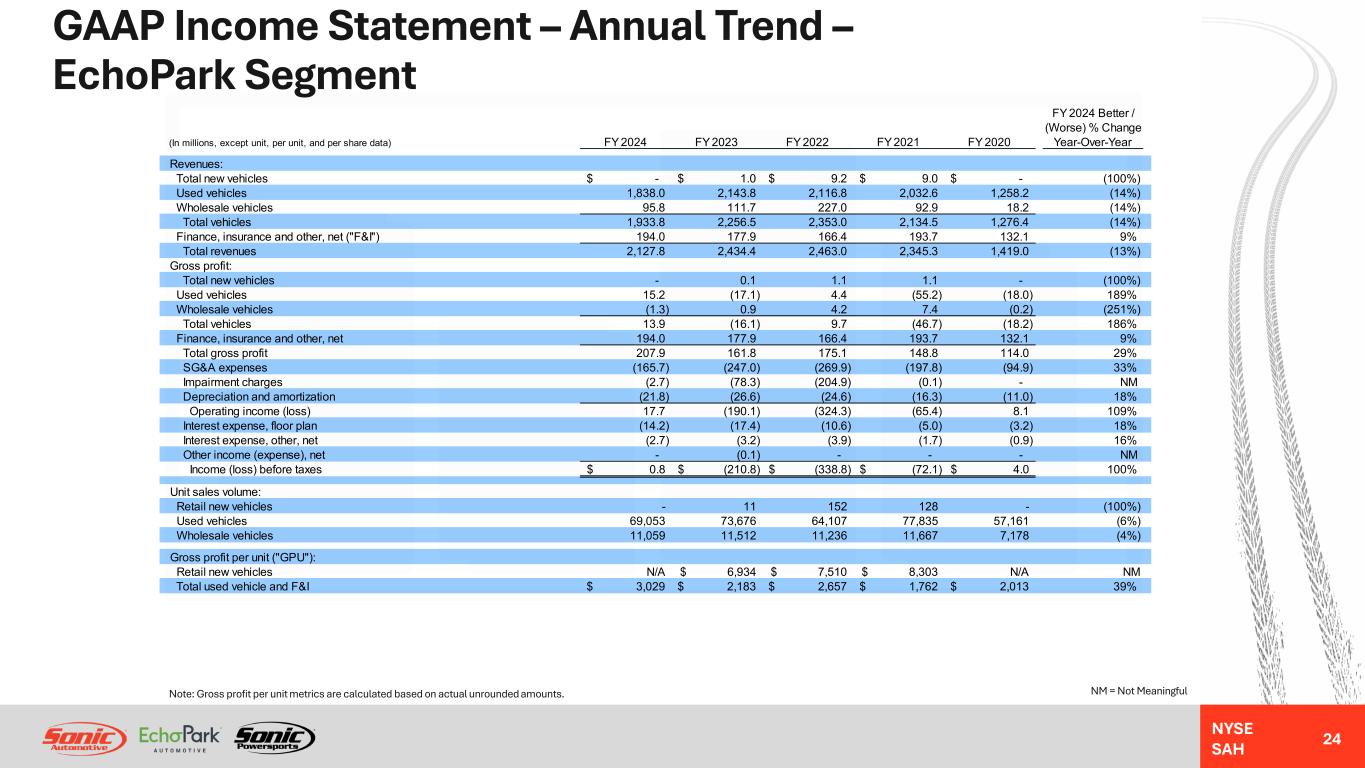
NYSE SAH GAAP Income Statement – Annual Trend – EchoPark Segment 24 NM = Not MeaningfulNote: Gross profit per unit metrics are calculated based on actual unrounded amounts. FY 2024 Better / (Worse) % Change (In millions, except unit, per unit, and per share data) FY 2024 FY 2023 FY 2022 FY 2021 FY 2020 Year-Over-Year Revenues: Total new vehicles -$ 1.0$ 9.2$ 9.0$ -$ (100%) Used vehicles 1,838.0 2,143.8 2,116.8 2,032.6 1,258.2 (14%) Wholesale vehicles 95.8 111.7 227.0 92.9 18.2 (14%) Total vehicles 1,933.8 2,256.5 2,353.0 2,134.5 1,276.4 (14%) Finance, insurance and other, net ("F&I") 194.0 177.9 166.4 193.7 132.1 9% Total revenues 2,127.8 2,434.4 2,463.0 2,345.3 1,419.0 (13%) Gross profit: Total new vehicles - 0.1 1.1 1.1 - (100%) Used vehicles 15.2 (17.1) 4.4 (55.2) (18.0) 189% Wholesale vehicles (1.3) 0.9 4.2 7.4 (0.2) (251%) Total vehicles 13.9 (16.1) 9.7 (46.7) (18.2) 186% Finance, insurance and other, net 194.0 177.9 166.4 193.7 132.1 9% Total gross profit 207.9 161.8 175.1 148.8 114.0 29% SG&A expenses (165.7) (247.0) (269.9) (197.8) (94.9) 33% Impairment charges (2.7) (78.3) (204.9) (0.1) - NM Depreciation and amortization (21.8) (26.6) (24.6) (16.3) (11.0) 18% Operating income (loss) 17.7 (190.1) (324.3) (65.4) 8.1 109% Interest expense, floor plan (14.2) (17.4) (10.6) (5.0) (3.2) 18% Interest expense, other, net (2.7) (3.2) (3.9) (1.7) (0.9) 16% Other income (expense), net - (0.1) - - - NM Income (loss) before taxes 0.8$ (210.8)$ (338.8)$ (72.1)$ 4.0$ 100% Unit sales volume: Retail new vehicles - 11 152 128 - (100%) Used vehicles 69,053 73,676 64,107 77,835 57,161 (6%) Wholesale vehicles 11,059 11,512 11,236 11,667 7,178 (4%) Gross profit per unit ("GPU"): Retail new vehicles N/A 6,934$ 7,510$ 8,303$ N/A NM Total used vehicle and F&I 3,029$ 2,183$ 2,657$ 1,762$ 2,013$ 39%
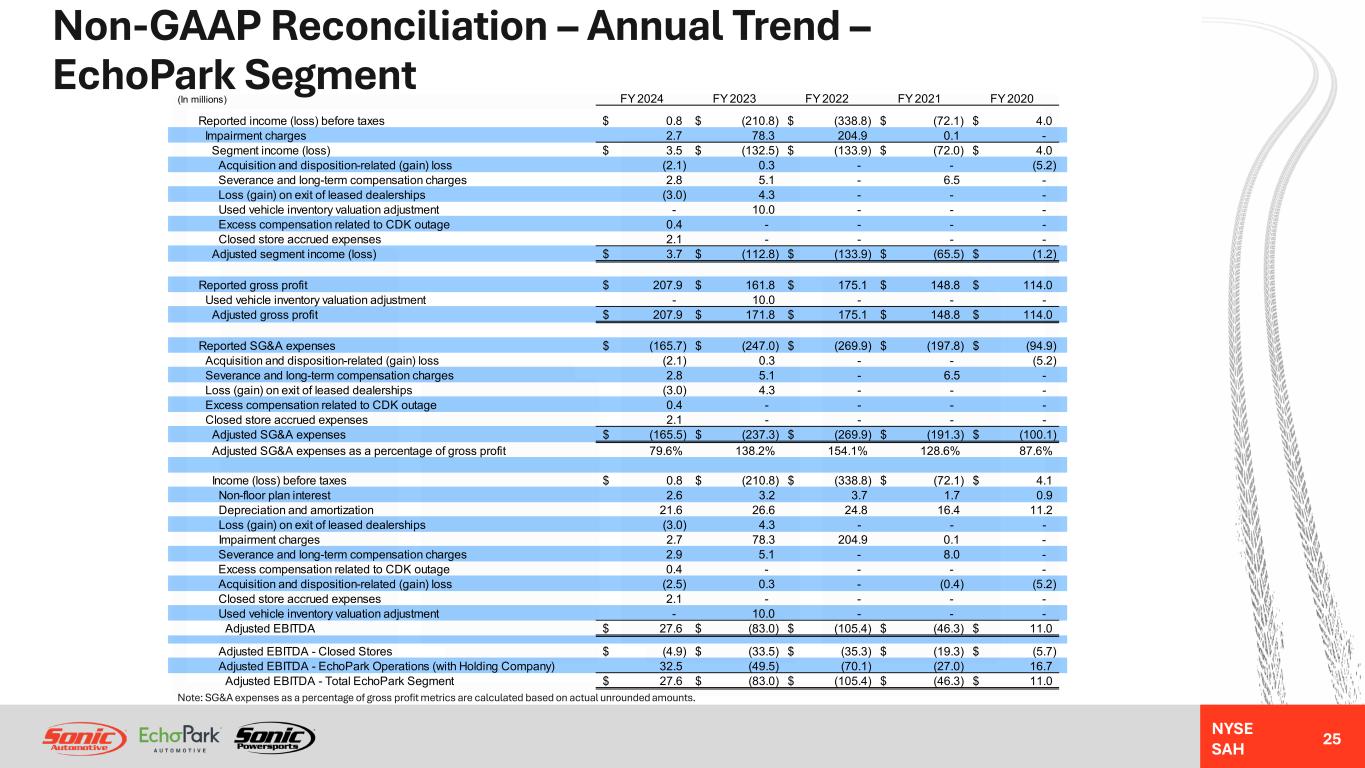
NYSE SAH Non-GAAP Reconciliation – Annual Trend – EchoPark Segment 25 Note: SG&A expenses as a percentage of gross profit metrics are calculated based on actual unrounded amounts. (In millions) FY 2024 FY 2023 FY 2022 FY 2021 FY 2020 Reported income (loss) before taxes 0.8$ (210.8)$ (338.8)$ (72.1)$ 4.0$ Impairment charges 2.7 78.3 204.9 0.1 - Segment income (loss) 3.5$ (132.5)$ (133.9)$ (72.0)$ 4.0$ Acquisition and disposition-related (gain) loss (2.1) 0.3 - - (5.2) Severance and long-term compensation charges 2.8 5.1 - 6.5 - Loss (gain) on exit of leased dealerships (3.0) 4.3 - - - Used vehicle inventory valuation adjustment - 10.0 - - - Excess compensation related to CDK outage 0.4 - - - - Closed store accrued expenses 2.1 - - - - Adjusted segment income (loss) 3.7$ (112.8)$ (133.9)$ (65.5)$ (1.2)$ Reported gross profit 207.9$ 161.8$ 175.1$ 148.8$ 114.0$ Used vehicle inventory valuation adjustment - 10.0 - - - Adjusted gross profit 207.9$ 171.8$ 175.1$ 148.8$ 114.0$ Reported SG&A expenses (165.7)$ (247.0)$ (269.9)$ (197.8)$ (94.9)$ Acquisition and disposition-related (gain) loss (2.1) 0.3 - - (5.2) Severance and long-term compensation charges 2.8 5.1 - 6.5 - Loss (gain) on exit of leased dealerships (3.0) 4.3 - - - Excess compensation related to CDK outage 0.4 - - - - Closed store accrued expenses 2.1 - - - - Adjusted SG&A expenses (165.5)$ (237.3)$ (269.9)$ (191.3)$ (100.1)$ Adjusted SG&A expenses as a percentage of gross profit 79.6% 138.2% 154.1% 128.6% 87.6% Income (loss) before taxes 0.8$ (210.8)$ (338.8)$ (72.1)$ 4.1$ Non-floor plan interest 2.6 3.2 3.7 1.7 0.9 Depreciation and amortization 21.6 26.6 24.8 16.4 11.2 Loss (gain) on exit of leased dealerships (3.0) 4.3 - - - Impairment charges 2.7 78.3 204.9 0.1 - Severance and long-term compensation charges 2.9 5.1 - 8.0 - Excess compensation related to CDK outage 0.4 - - - - Acquisition and disposition-related (gain) loss (2.5) 0.3 - (0.4) (5.2) Closed store accrued expenses 2.1 - - - - Used vehicle inventory valuation adjustment - 10.0 - - - Adjusted EBITDA 27.6$ (83.0)$ (105.4)$ (46.3)$ 11.0$ Adjusted EBITDA - Closed Stores (4.9)$ (33.5)$ (35.3)$ (19.3)$ (5.7)$ Adjusted EBITDA - EchoPark Operations (with Holding Company) 32.5 (49.5) (70.1) (27.0) 16.7 Adjusted EBITDA - Total EchoPark Segment 27.6$ (83.0)$ (105.4)$ (46.3)$ 11.0$
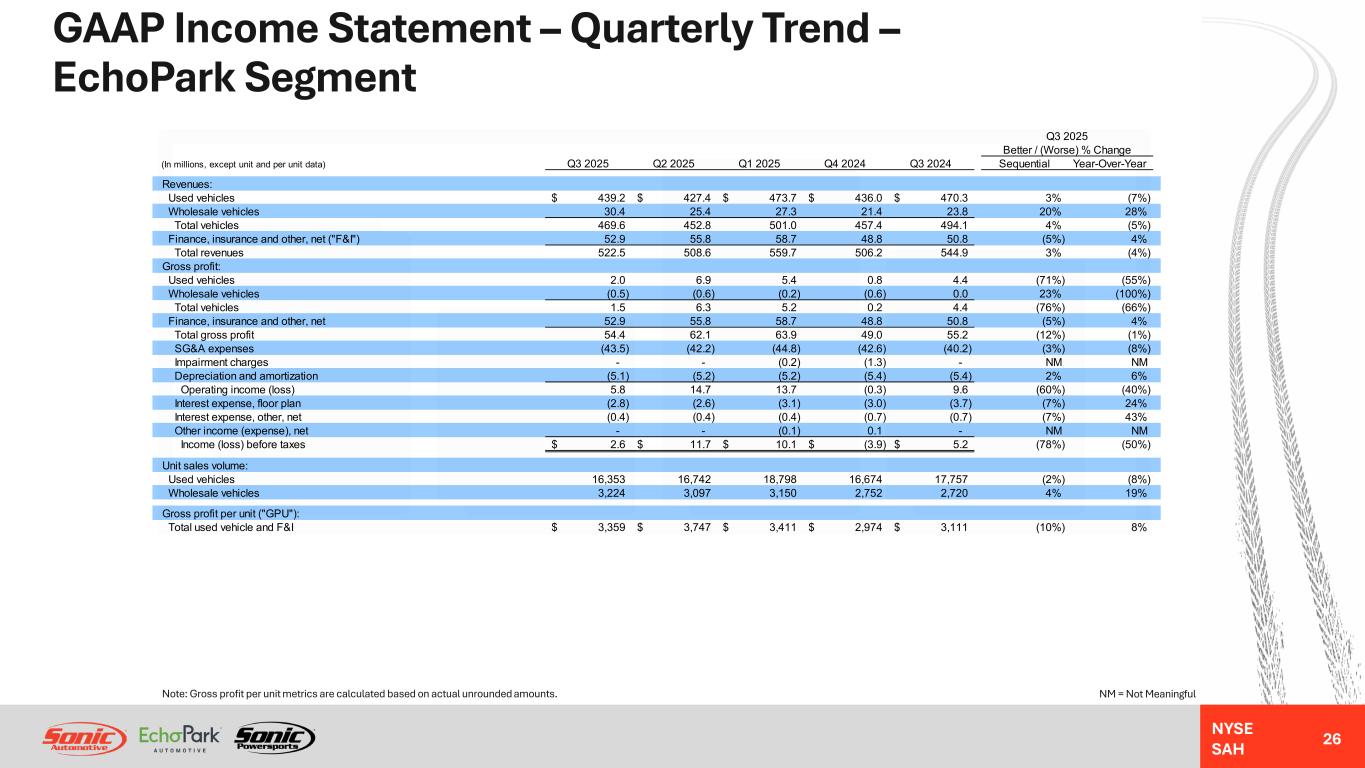
NYSE SAH GAAP Income Statement – Quarterly Trend – EchoPark Segment 26 NM = Not MeaningfulNote: Gross profit per unit metrics are calculated based on actual unrounded amounts. Q3 2025 Better / (Worse) % Change (In millions, except unit and per unit data) Q3 2025 Q2 2025 Q1 2025 Q4 2024 Q3 2024 Sequential Year-Over-Year Revenues: Used vehicles 439.2$ 427.4$ 473.7$ 436.0$ 470.3$ 3% (7%) Wholesale vehicles 30.4 25.4 27.3 21.4 23.8 20% 28% Total vehicles 469.6 452.8 501.0 457.4 494.1 4% (5%) Finance, insurance and other, net ("F&I") 52.9 55.8 58.7 48.8 50.8 (5%) 4% Total revenues 522.5 508.6 559.7 506.2 544.9 3% (4%) Gross profit: Used vehicles 2.0 6.9 5.4 0.8 4.4 (71%) (55%) Wholesale vehicles (0.5) (0.6) (0.2) (0.6) 0.0 23% (100%) Total vehicles 1.5 6.3 5.2 0.2 4.4 (76%) (66%) Finance, insurance and other, net 52.9 55.8 58.7 48.8 50.8 (5%) 4% Total gross profit 54.4 62.1 63.9 49.0 55.2 (12%) (1%) SG&A expenses (43.5) (42.2) (44.8) (42.6) (40.2) (3%) (8%) Impairment charges - - (0.2) (1.3) - NM NM Depreciation and amortization (5.1) (5.2) (5.2) (5.4) (5.4) 2% 6% Operating income (loss) 5.8 14.7 13.7 (0.3) 9.6 (60%) (40%) Interest expense, floor plan (2.8) (2.6) (3.1) (3.0) (3.7) (7%) 24% Interest expense, other, net (0.4) (0.4) (0.4) (0.7) (0.7) (7%) 43% Other income (expense), net - - (0.1) 0.1 - NM NM Income (loss) before taxes 2.6$ 11.7$ 10.1$ (3.9)$ 5.2$ (78%) (50%) Unit sales volume: Used vehicles 16,353 16,742 18,798 16,674 17,757 (2%) (8%) Wholesale vehicles 3,224 3,097 3,150 2,752 2,720 4% 19% Gross profit per unit ("GPU"): Total used vehicle and F&I 3,359$ 3,747$ 3,411$ 2,974$ 3,111$ (10%) 8%
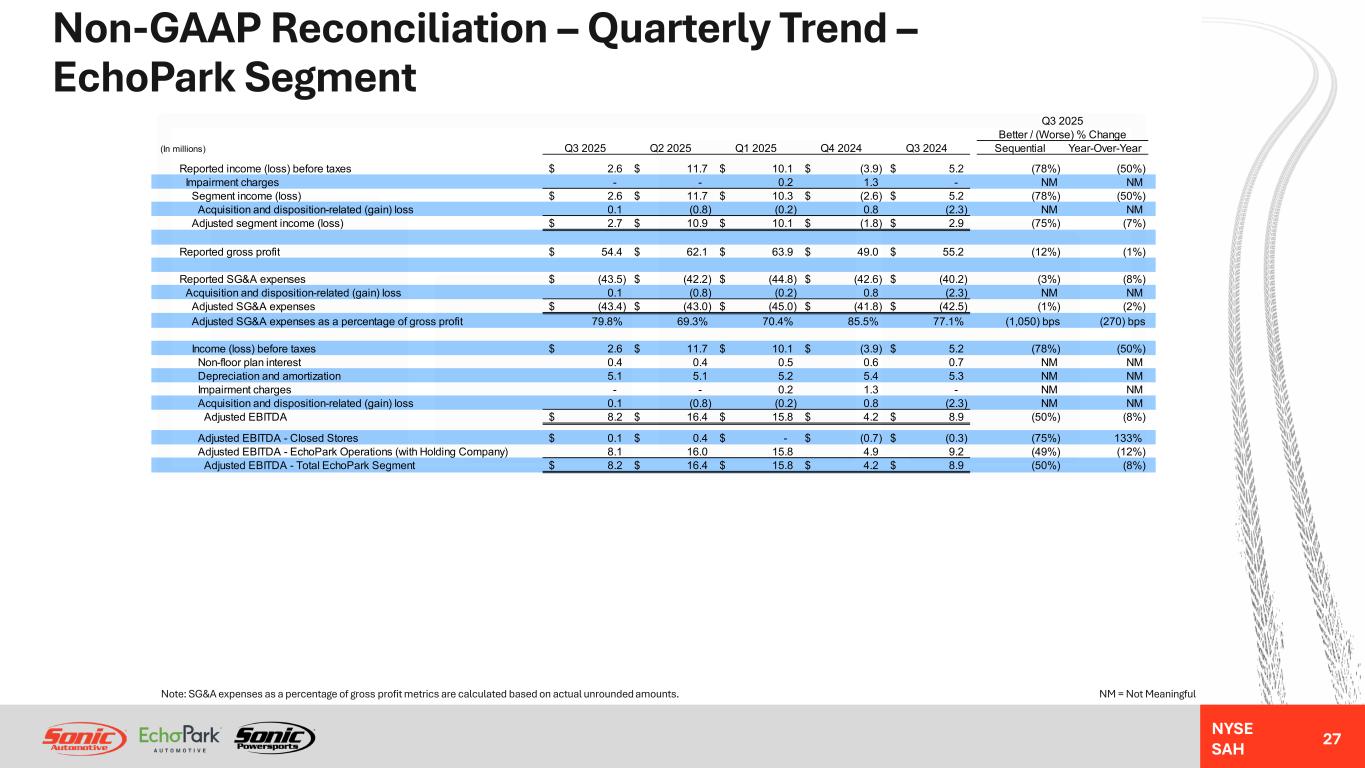
NYSE SAH Non-GAAP Reconciliation – Quarterly Trend – EchoPark Segment 27 NM = Not MeaningfulNote: SG&A expenses as a percentage of gross profit metrics are calculated based on actual unrounded amounts. Q3 2025 Better / (Worse) % Change (In millions) Q3 2025 Q2 2025 Q1 2025 Q4 2024 Q3 2024 Sequential Year-Over-Year Reported income (loss) before taxes 2.6$ 11.7$ 10.1$ (3.9)$ 5.2$ (78%) (50%) Impairment charges - - 0.2 1.3 - NM NM Segment income (loss) 2.6$ 11.7$ 10.3$ (2.6)$ 5.2$ (78%) (50%) Acquisition and disposition-related (gain) loss 0.1 (0.8) (0.2) 0.8 (2.3) NM NM Adjusted segment income (loss) 2.7$ 10.9$ 10.1$ (1.8)$ 2.9$ (75%) (7%) Reported gross profit 54.4$ 62.1$ 63.9$ 49.0$ 55.2$ (12%) (1%) Reported SG&A expenses (43.5)$ (42.2)$ (44.8)$ (42.6)$ (40.2)$ (3%) (8%) Acquisition and disposition-related (gain) loss 0.1 (0.8) (0.2) 0.8 (2.3) NM NM Adjusted SG&A expenses (43.4)$ (43.0)$ (45.0)$ (41.8)$ (42.5)$ (1%) (2%) Adjusted SG&A expenses as a percentage of gross profit 79.8% 69.3% 70.4% 85.5% 77.1% (1,050) bps (270) bps Income (loss) before taxes 2.6$ 11.7$ 10.1$ (3.9)$ 5.2$ (78%) (50%) Non-floor plan interest 0.4 0.4 0.5 0.6 0.7 NM NM Depreciation and amortization 5.1 5.1 5.2 5.4 5.3 NM NM Impairment charges - - 0.2 1.3 - NM NM Acquisition and disposition-related (gain) loss 0.1 (0.8) (0.2) 0.8 (2.3) NM NM Adjusted EBITDA 8.2$ 16.4$ 15.8$ 4.2$ 8.9$ (50%) (8%) Adjusted EBITDA - Closed Stores 0.1$ 0.4$ -$ (0.7)$ (0.3)$ (75%) 133% Adjusted EBITDA - EchoPark Operations (with Holding Company) 8.1 16.0 15.8 4.9 9.2 (49%) (12%) Adjusted EBITDA - Total EchoPark Segment 8.2$ 16.4$ 15.8$ 4.2$ 8.9$ (50%) (8%)
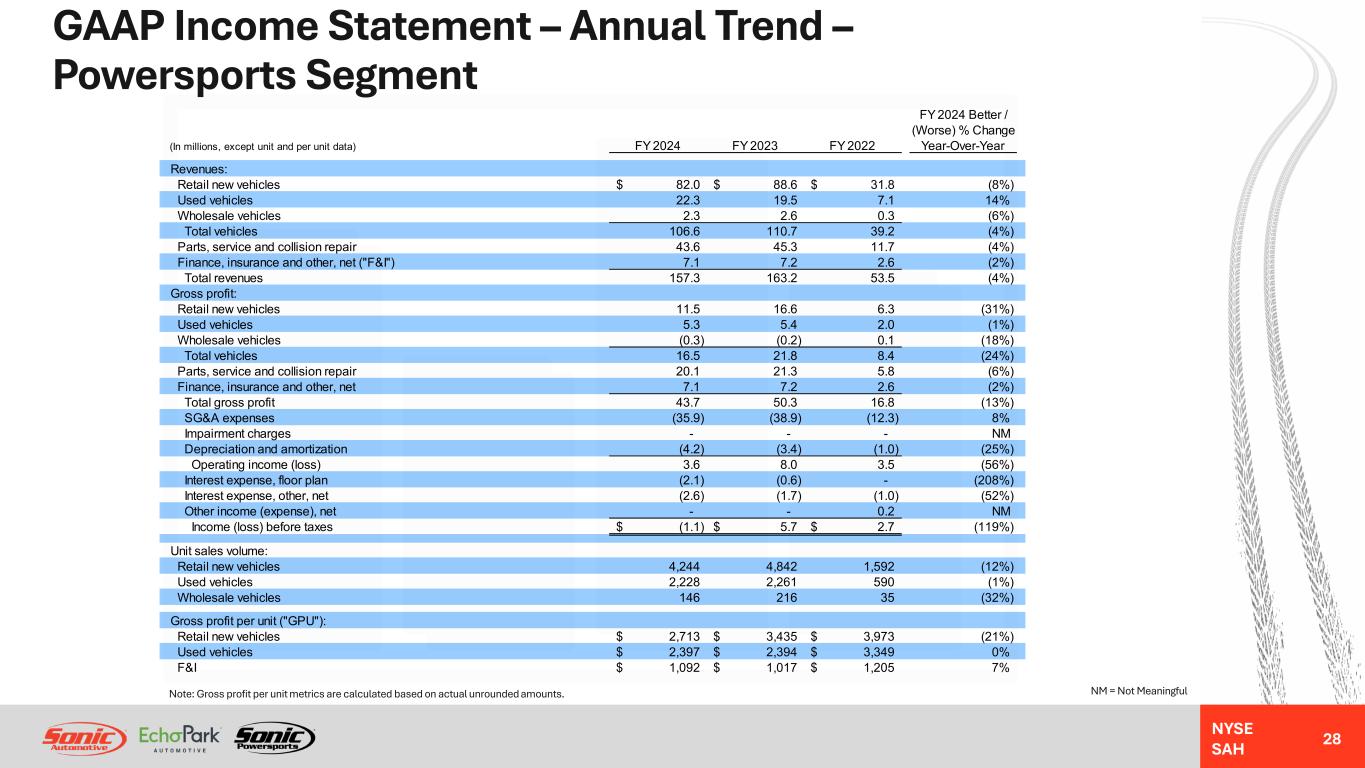
NYSE SAH GAAP Income Statement – Annual Trend – Powersports Segment 28 NM = Not MeaningfulNote: Gross profit per unit metrics are calculated based on actual unrounded amounts. FY 2024 Better / (Worse) % Change (In millions, except unit and per unit data) FY 2024 FY 2023 FY 2022 Year-Over-Year Revenues: Retail new vehicles 82.0$ 88.6$ 31.8$ (8%) Used vehicles 22.3 19.5 7.1 14% Wholesale vehicles 2.3 2.6 0.3 (6%) Total vehicles 106.6 110.7 39.2 (4%) Parts, service and collision repair 43.6 45.3 11.7 (4%) Finance, insurance and other, net ("F&I") 7.1 7.2 2.6 (2%) Total revenues 157.3 163.2 53.5 (4%) Gross profit: Retail new vehicles 11.5 16.6 6.3 (31%) Used vehicles 5.3 5.4 2.0 (1%) Wholesale vehicles (0.3) (0.2) 0.1 (18%) Total vehicles 16.5 21.8 8.4 (24%) Parts, service and collision repair 20.1 21.3 5.8 (6%) Finance, insurance and other, net 7.1 7.2 2.6 (2%) Total gross profit 43.7 50.3 16.8 (13%) SG&A expenses (35.9) (38.9) (12.3) 8% Impairment charges - - - NM Depreciation and amortization (4.2) (3.4) (1.0) (25%) Operating income (loss) 3.6 8.0 3.5 (56%) Interest expense, floor plan (2.1) (0.6) - (208%) Interest expense, other, net (2.6) (1.7) (1.0) (52%) Other income (expense), net - - 0.2 NM Income (loss) before taxes (1.1)$ 5.7$ 2.7$ (119%) Unit sales volume: Retail new vehicles 4,244 4,842 1,592 (12%) Used vehicles 2,228 2,261 590 (1%) Wholesale vehicles 146 216 35 (32%) Gross profit per unit ("GPU"): Retail new vehicles 2,713$ 3,435$ 3,973$ (21%) Used vehicles 2,397$ 2,394$ 3,349$ 0% F&I 1,092$ 1,017$ 1,205$ 7%
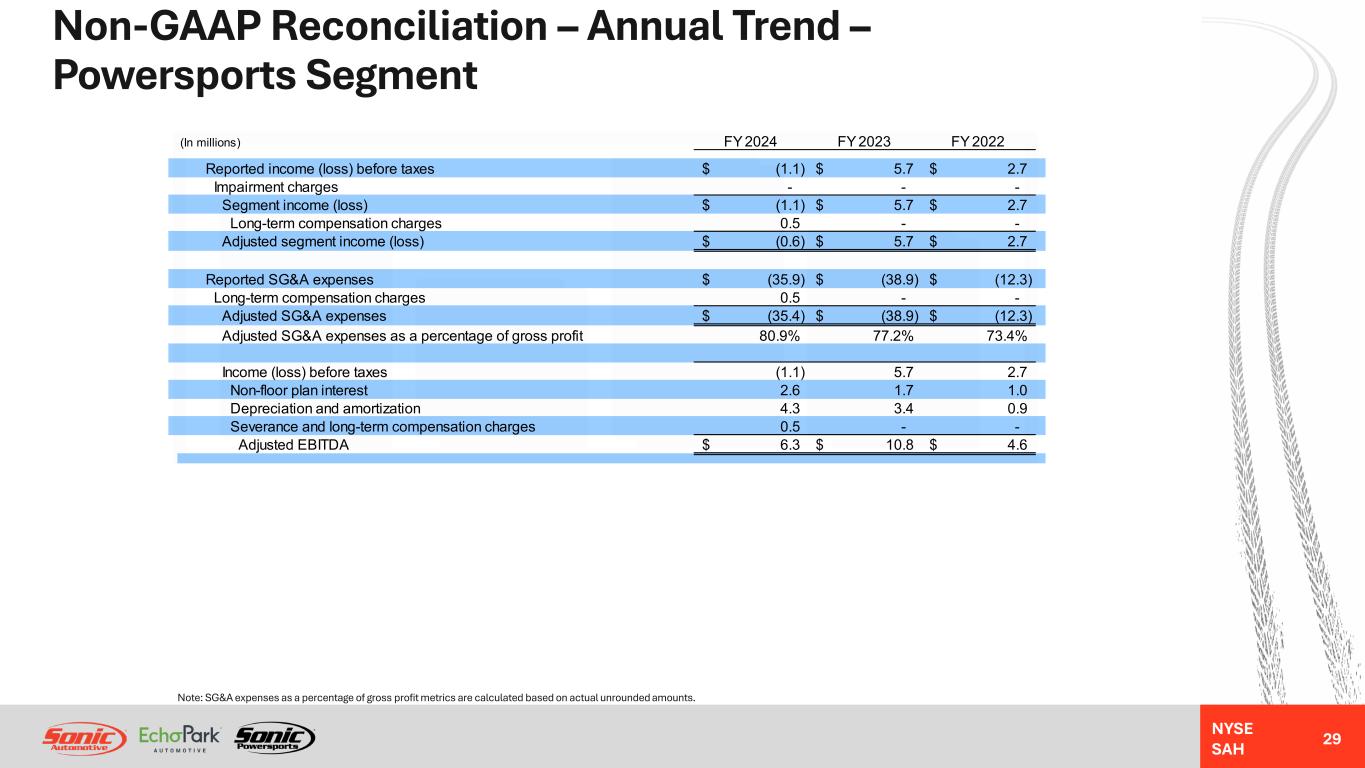
NYSE SAH Non-GAAP Reconciliation – Annual Trend – Powersports Segment 29 Note: SG&A expenses as a percentage of gross profit metrics are calculated based on actual unrounded amounts. (In millions) FY 2024 FY 2023 FY 2022 Reported income (loss) before taxes (1.1)$ 5.7$ 2.7$ Impairment charges - - - Segment income (loss) (1.1)$ 5.7$ 2.7$ Long-term compensation charges 0.5 - - Adjusted segment income (loss) (0.6)$ 5.7$ 2.7$ Reported SG&A expenses (35.9)$ (38.9)$ (12.3)$ Long-term compensation charges 0.5 - - Adjusted SG&A expenses (35.4)$ (38.9)$ (12.3)$ Adjusted SG&A expenses as a percentage of gross profit 80.9% 77.2% 73.4% Income (loss) before taxes (1.1) 5.7 2.7 Non-floor plan interest 2.6 1.7 1.0 Depreciation and amortization 4.3 3.4 0.9 Severance and long-term compensation charges 0.5 - - Adjusted EBITDA 6.3$ 10.8$ 4.6$
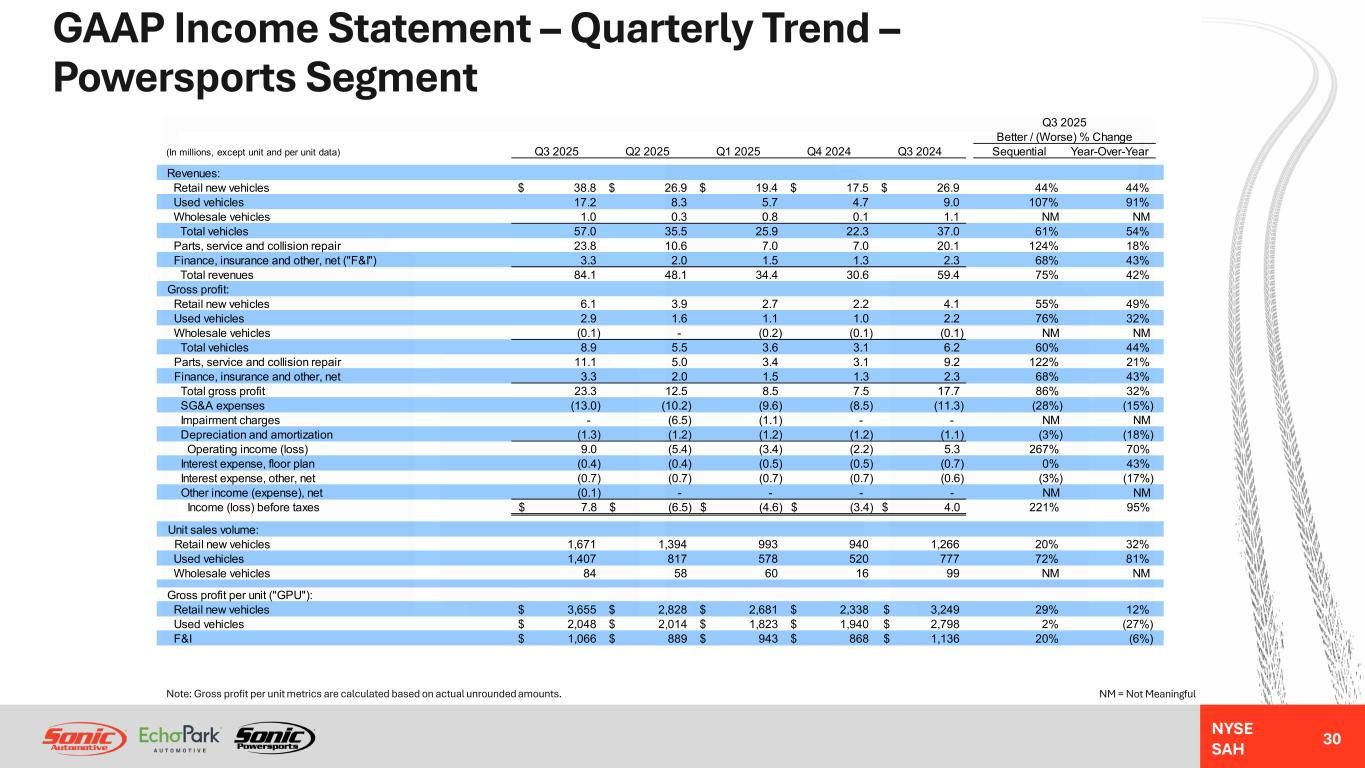
NYSE SAH GAAP Income Statement – Quarterly Trend – Powersports Segment 30 NM = Not MeaningfulNote: Gross profit per unit metrics are calculated based on actual unrounded amounts. Q3 2025 Better / (Worse) % Change (In millions, except unit and per unit data) Q3 2025 Q2 2025 Q1 2025 Q4 2024 Q3 2024 Sequential Year-Over-Year Revenues: Retail new vehicles 38.8$ 26.9$ 19.4$ 17.5$ 26.9$ 44% 44% Used vehicles 17.2 8.3 5.7 4.7 9.0 107% 91% Wholesale vehicles 1.0 0.3 0.8 0.1 1.1 NM NM Total vehicles 57.0 35.5 25.9 22.3 37.0 61% 54% Parts, service and collision repair 23.8 10.6 7.0 7.0 20.1 124% 18% Finance, insurance and other, net ("F&I") 3.3 2.0 1.5 1.3 2.3 68% 43% Total revenues 84.1 48.1 34.4 30.6 59.4 75% 42% Gross profit: Retail new vehicles 6.1 3.9 2.7 2.2 4.1 55% 49% Used vehicles 2.9 1.6 1.1 1.0 2.2 76% 32% Wholesale vehicles (0.1) - (0.2) (0.1) (0.1) NM NM Total vehicles 8.9 5.5 3.6 3.1 6.2 60% 44% Parts, service and collision repair 11.1 5.0 3.4 3.1 9.2 122% 21% Finance, insurance and other, net 3.3 2.0 1.5 1.3 2.3 68% 43% Total gross profit 23.3 12.5 8.5 7.5 17.7 86% 32% SG&A expenses (13.0) (10.2) (9.6) (8.5) (11.3) (28%) (15%) Impairment charges - (6.5) (1.1) - - NM NM Depreciation and amortization (1.3) (1.2) (1.2) (1.2) (1.1) (3%) (18%) Operating income (loss) 9.0 (5.4) (3.4) (2.2) 5.3 267% 70% Interest expense, floor plan (0.4) (0.4) (0.5) (0.5) (0.7) 0% 43% Interest expense, other, net (0.7) (0.7) (0.7) (0.7) (0.6) (3%) (17%) Other income (expense), net (0.1) - - - - NM NM Income (loss) before taxes 7.8$ (6.5)$ (4.6)$ (3.4)$ 4.0$ 221% 95% Unit sales volume: Retail new vehicles 1,671 1,394 993 940 1,266 20% 32% Used vehicles 1,407 817 578 520 777 72% 81% Wholesale vehicles 84 58 60 16 99 NM NM Gross profit per unit ("GPU"): Retail new vehicles 3,655$ 2,828$ 2,681$ 2,338$ 3,249$ 29% 12% Used vehicles 2,048$ 2,014$ 1,823$ 1,940$ 2,798$ 2% (27%) F&I 1,066$ 889$ 943$ 868$ 1,136$ 20% (6%)
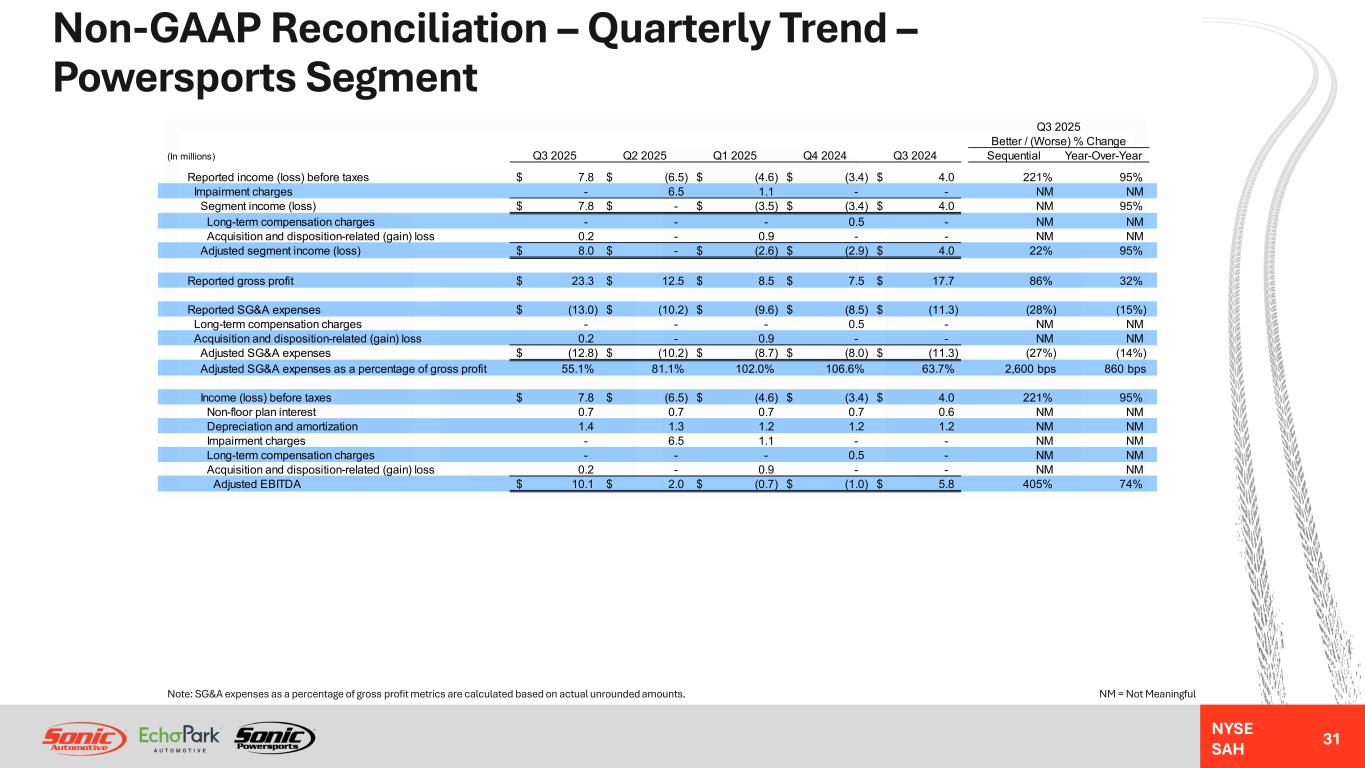
NYSE SAH Non-GAAP Reconciliation – Quarterly Trend – Powersports Segment 31 NM = Not MeaningfulNote: SG&A expenses as a percentage of gross profit metrics are calculated based on actual unrounded amounts. Q3 2025 Better / (Worse) % Change (In millions) Q3 2025 Q2 2025 Q1 2025 Q4 2024 Q3 2024 Sequential Year-Over-Year Reported income (loss) before taxes 7.8$ (6.5)$ (4.6)$ (3.4)$ 4.0$ 221% 95% Impairment charges - 6.5 1.1 - - NM NM Segment income (loss) 7.8$ -$ (3.5)$ (3.4)$ 4.0$ NM 95% Long-term compensation charges - - - 0.5 - NM NM Acquisition and disposition-related (gain) loss 0.2 - 0.9 - - NM NM Adjusted segment income (loss) 8.0$ -$ (2.6)$ (2.9)$ 4.0$ 22% 95% Reported gross profit 23.3$ 12.5$ 8.5$ 7.5$ 17.7$ 86% 32% Reported SG&A expenses (13.0)$ (10.2)$ (9.6)$ (8.5)$ (11.3)$ (28%) (15%) Long-term compensation charges - - - 0.5 - NM NM Acquisition and disposition-related (gain) loss 0.2 - 0.9 - - NM NM Adjusted SG&A expenses (12.8)$ (10.2)$ (8.7)$ (8.0)$ (11.3)$ (27%) (14%) Adjusted SG&A expenses as a percentage of gross profit 55.1% 81.1% 102.0% 106.6% 63.7% 2,600 bps 860 bps Income (loss) before taxes 7.8$ (6.5)$ (4.6)$ (3.4)$ 4.0$ 221% 95% Non-floor plan interest 0.7 0.7 0.7 0.7 0.6 NM NM Depreciation and amortization 1.4 1.3 1.2 1.2 1.2 NM NM Impairment charges - 6.5 1.1 - - NM NM Long-term compensation charges - - - 0.5 - NM NM Acquisition and disposition-related (gain) loss 0.2 - 0.9 - - NM NM Adjusted EBITDA 10.1$ 2.0$ (0.7)$ (1.0)$ 5.8$ 405% 74%
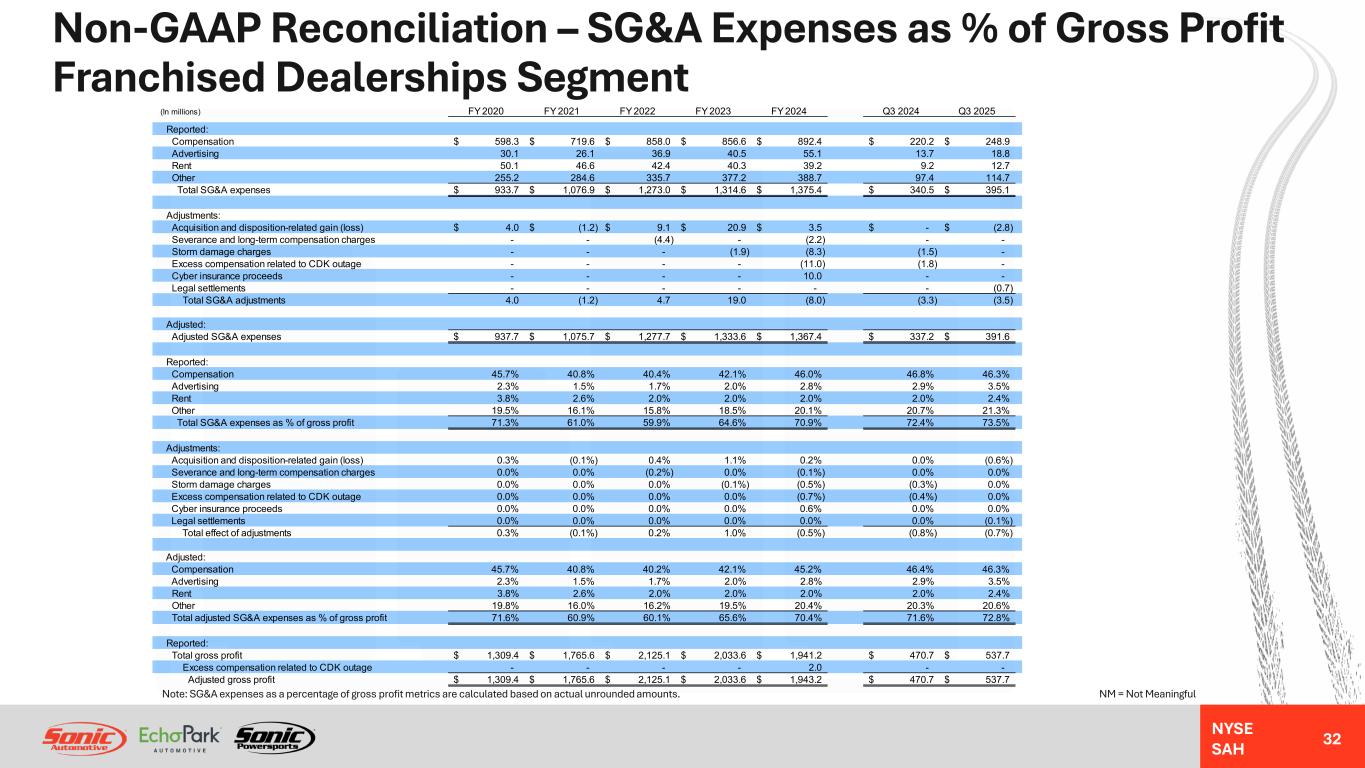
NYSE SAH Non-GAAP Reconciliation – SG&A Expenses as % of Gross Profit Franchised Dealerships Segment 32 NM = Not MeaningfulNote: SG&A expenses as a percentage of gross profit metrics are calculated based on actual unrounded amounts. (In millions) FY 2020 FY 2021 FY 2022 FY 2023 FY 2024 Q3 2024 Q3 2025 Reported: Compensation 598.3$ 719.6$ 858.0$ 856.6$ 892.4$ 220.2$ 248.9$ Advertising 30.1 26.1 36.9 40.5 55.1 13.7 18.8 Rent 50.1 46.6 42.4 40.3 39.2 9.2 12.7 Other 255.2 284.6 335.7 377.2 388.7 97.4 114.7 Total SG&A expenses 933.7$ 1,076.9$ 1,273.0$ 1,314.6$ 1,375.4$ 340.5$ 395.1$ Adjustments: Acquisition and disposition-related gain (loss) 4.0$ (1.2)$ 9.1$ 20.9$ 3.5$ -$ (2.8)$ Severance and long-term compensation charges - - (4.4) - (2.2) - - Storm damage charges - - - (1.9) (8.3) (1.5) - Excess compensation related to CDK outage - - - - (11.0) (1.8) - Cyber insurance proceeds - - - - 10.0 - - Legal settlements - - - - - - (0.7) Total SG&A adjustments 4.0 (1.2) 4.7 19.0 (8.0) (3.3) (3.5) Adjusted: Adjusted SG&A expenses 937.7$ 1,075.7$ 1,277.7$ 1,333.6$ 1,367.4$ 337.2$ 391.6$ Reported: Compensation 45.7% 40.8% 40.4% 42.1% 46.0% 46.8% 46.3% Advertising 2.3% 1.5% 1.7% 2.0% 2.8% 2.9% 3.5% Rent 3.8% 2.6% 2.0% 2.0% 2.0% 2.0% 2.4% Other 19.5% 16.1% 15.8% 18.5% 20.1% 20.7% 21.3% Total SG&A expenses as % of gross profit 71.3% 61.0% 59.9% 64.6% 70.9% 72.4% 73.5% Adjustments: Acquisition and disposition-related gain (loss) 0.3% (0.1%) 0.4% 1.1% 0.2% 0.0% (0.6%) Severance and long-term compensation charges 0.0% 0.0% (0.2%) 0.0% (0.1%) 0.0% 0.0% Storm damage charges 0.0% 0.0% 0.0% (0.1%) (0.5%) (0.3%) 0.0% Excess compensation related to CDK outage 0.0% 0.0% 0.0% 0.0% (0.7%) (0.4%) 0.0% Cyber insurance proceeds 0.0% 0.0% 0.0% 0.0% 0.6% 0.0% 0.0% Legal settlements 0.0% 0.0% 0.0% 0.0% 0.0% 0.0% (0.1%) Total effect of adjustments 0.3% (0.1%) 0.2% 1.0% (0.5%) (0.8%) (0.7%) Adjusted: Compensation 45.7% 40.8% 40.2% 42.1% 45.2% 46.4% 46.3% Advertising 2.3% 1.5% 1.7% 2.0% 2.8% 2.9% 3.5% Rent 3.8% 2.6% 2.0% 2.0% 2.0% 2.0% 2.4% Other 19.8% 16.0% 16.2% 19.5% 20.4% 20.3% 20.6% Total adjusted SG&A expenses as % of gross profit 71.6% 60.9% 60.1% 65.6% 70.4% 71.6% 72.8% Reported: Total gross profit 1,309.4$ 1,765.6$ 2,125.1$ 2,033.6$ 1,941.2$ 470.7$ 537.7$ Excess compensation related to CDK outage - - - - 2.0 - - Adjusted gross profit 1,309.4$ 1,765.6$ 2,125.1$ 2,033.6$ 1,943.2$ 470.7$ 537.7$

Investor Relations Contact: Danny Wieland, Vice President, Investor Relations & Financial Reporting Sonic Automotive Inc. (NYSE: SAH) Email: ir@sonicautomotive.com Investor Relations Website: ir.sonicautomotive.com