Forward Air Corporation Earnings Presentation 3Q26 November 9, 2026
E a r n i n g s P r e s e n t a t i o n Statements & Disclaimers 2 Forward Looking Statements This presentation contains “forward-looking statements” within the meaning of the safe harbor provisions of the U.S. Private Securities Litigation Reform Act of 1995. Forward-looking statements can be identified by words such as: “anticipate,” “intend,” “plan,” “goal,” “seek,” “believe,” “project,” “estimate,” “expect,” “strategy,” “future,” “likely,” “may,” “should,” “will” and similar references to future periods. Forward-looking statements included in this presentation relate to: expectations regarding customer demand for services of Forward Air Corporation (“Forward,” “we,” “us” or “our”); our outlook on the freight market, including expectations regarding freight market conditions, capacity and the pace and extent of any freight market recovery; our expectations regarding revenue growth, margin improvement relative to our peers and the realization of synergies and operational improvements following the Omni acquisition; our goals to achieve sustainable growth and long-term profitability; our expectations regarding the definitive agreement with our largest customer, including the services and revenue expected to be retained, the revenue we expect to generate from the customer in 2026, 2027 and 2028, the term of the agreement and the anticipated timing of the transition of certain services to other providers; our plans and expectations regarding the disposition of non- core assets, including the anticipated timing and completion of the sale of our Intermodal business and the expected use of proceeds therefrom; our deleveraging goals; our expectations regarding liquidity, cash flow generation and continued improvement in our results of operations; and our future debt service requirements. Forward-looking statements are neither historical facts nor assurances of future performance. Instead, they are based only on our current beliefs, expectations and assumptions regarding the future of our business, future plans and strategies, projections, anticipated events and trends, the economy and other future conditions. Because forward-looking statements relate to the future, they are subject to inherent uncertainties, risks and changes in circumstances that are difficult to predict and many of which are outside of our control. Our actual results and financial condition may differ materially from those indicated in the forward-looking statements. The following is a list of factors, among others, that could cause actual results to differ materially from those contemplated by the forward-looking statements: economic factors such as recessions, inflation, higher interest rates and downturns in customer business cycles; the outcome of our review of strategic alternatives; our ability to execute on a strategic sale of non-core assets, including our Intermodal business, on the anticipated timing and terms, or at all; the risk that our largest customer transitions a greater portion of its business than currently anticipated, that the transition otherwise occurs on terms less favorable than expected or that revenue from the customer does not meet our expectations; our ability to achieve ongoing strategic, financial and other benefits as we continue to transform our business after the acquisition of Omni Logistics, including the realization of expected synergies and the achievement of deleveraging targets within the expected timeframes or at all; the risk of customer loss; the risk of additional impairments to goodwill; the risk of management and employee loss; the creditworthiness of our customers and their ability to pay for services rendered; our inability to maintain our historical growth rate because of a decreased volume of freight or decreased average revenue per pound of freight moving through our network; the availability and compensation of qualified Leased Capacity Providers and freight handlers as well as contracted, third-party carriers needed to serve our customers’ transportation needs; our inability to manage our information systems and the occurrence of cybersecurity risks and events; market acceptance of our service offerings; claims for property damage, personal injuries or workers’ compensation; enforcement of and changes in governmental regulations; environmental, tax, insurance and accounting matters; the handling of hazardous materials; changes in fuel prices; loss of a major customer; increasing competition and pricing pressure; evolving macroeconomic factors, including the imposition of additional tariffs, potential escalation from trading partners, the uncertainty surrounding trade policy, including the extent to which increased tariffs will affect our operations and strategic plan, and our limited visibility into the impact of tariffs on third-party shipments; our dependence on our senior management team and the potential effects of changes in employee status; seasonal trends; the occurrence of certain weather events; restrictions in our charter and bylaws; and the risks described in our Annual Report on Form 10-K for the year ended December 31, 2025, and as may be identified in our subsequent Quarterly Reports on Form 10-Q and Current Reports on Form 8-K. We caution readers that any forward-looking statement made by us in this presentation is based only on information currently available to us, and readers should not place undue reliance on any forward-looking statement, which reflects management’s opinion only as of the date on which it is made. We undertake no obligation to publicly update any forward-looking statement, whether written or oral, that may be made from time to time, whether as a result of new information, future developments or otherwise unless required by law. Non-GAAP Measures To supplement the financial measures prepared in accordance with generally accepted accounting principles in the United States (“GAAP”), we have included Adjusted EBITDA, Adjusted EBITDA Margin %, Consolidated EBITDA, Consolidated EBITDA Margin %, Adjusted Operating Income, Net Leverage Ratio, Net Debt, Reported EBITDA, Reported EBITDA Margin %, LTM Reported EBITDA, LTM Reported EBITDA Margin %, Unlevered Free Cash Flow and Adjusted Operating Cash Flow, each of which is a non-GAAP financial measure (each, a “Non-GAAP Measure”), in this presentation. The reconciliation of each Non-GAAP Measure to the most directly comparable financial measure calculated and presented in accordance with GAAP can be found in the Appendix to this presentation. Because each Non-GAAP Measure excludes certain items as described herein, it may not be indicative of the results that Forward expects to recognize for future periods. As a result, each Non-GAAP Measure should be considered in addition to, and not a substitute for, financial information prepared in accordance with GAAP. The Company is also providing Consolidated EBITDA, Liquidity, and Net Leverage Ratio calculated in accordance with Forward’s credit agreement as we believe these measures provide investors with important information regarding our liquidity, financial condition and compliance with our obligations under our credit agreement.
01 Combined Overview 02 3Q26 Results 03 Liquidity, Leverage and Cash Flow 04 Investment Rationale 05 Closing Summary 06 Appendix E a r n i n g s P r e s e n t a t i o n Agenda 3
E a r n i n g s P r e s e n t a t i o n Combined Overview 4
C o m b i n e d O v e r v i e w Who We Are: A Story of Transformation and Excellence Our Heritage Forward Air's revolutionary expedited ground freight network, established in 1981, and Omni’s innovative logistics solutions, founded in 2000, represent decades of excellence in logistics innovation. Our Combined Strength Together, we have created a logistics powerhouse that combines Forward Air's robust North American LTL network with Omni's global logistics solutions, delivering unprecedented value and capabilities to our customers. Our Future We are positioned to be a leading force in global logistics, offering comprehensive solutions that span continents and streamline supply chains. 5
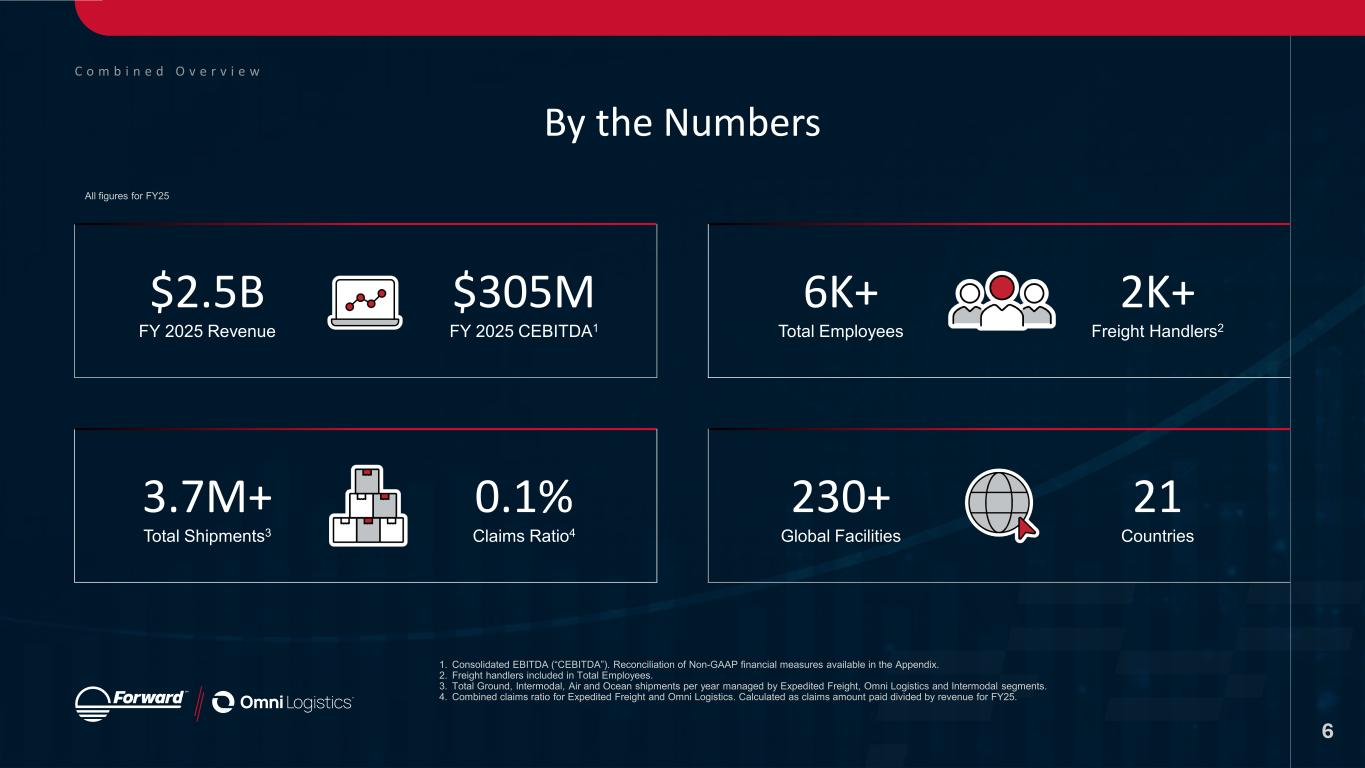
C o m b i n e d O v e r v i e w By the Numbers $2.5B FY 2025 Revenue $305M FY 2025 CEBITDA1 6K+ Total Employees 2K+ Freight Handlers2 3.7M+ Total Shipments3 0.1% Claims Ratio4 230+ Global Facilities 21 Countries 6 1. Consolidated EBITDA (“CEBITDA”). Reconciliation of Non-GAAP financial measures available in the Appendix. 2. Freight handlers included in Total Employees. 3. Total Ground, Intermodal, Air and Ocean shipments per year managed by Expedited Freight, Omni Logistics and Intermodal segments. 4. Combined claims ratio for Expedited Freight and Omni Logistics. Calculated as claims amount paid divided by revenue for FY25. All figures for FY25
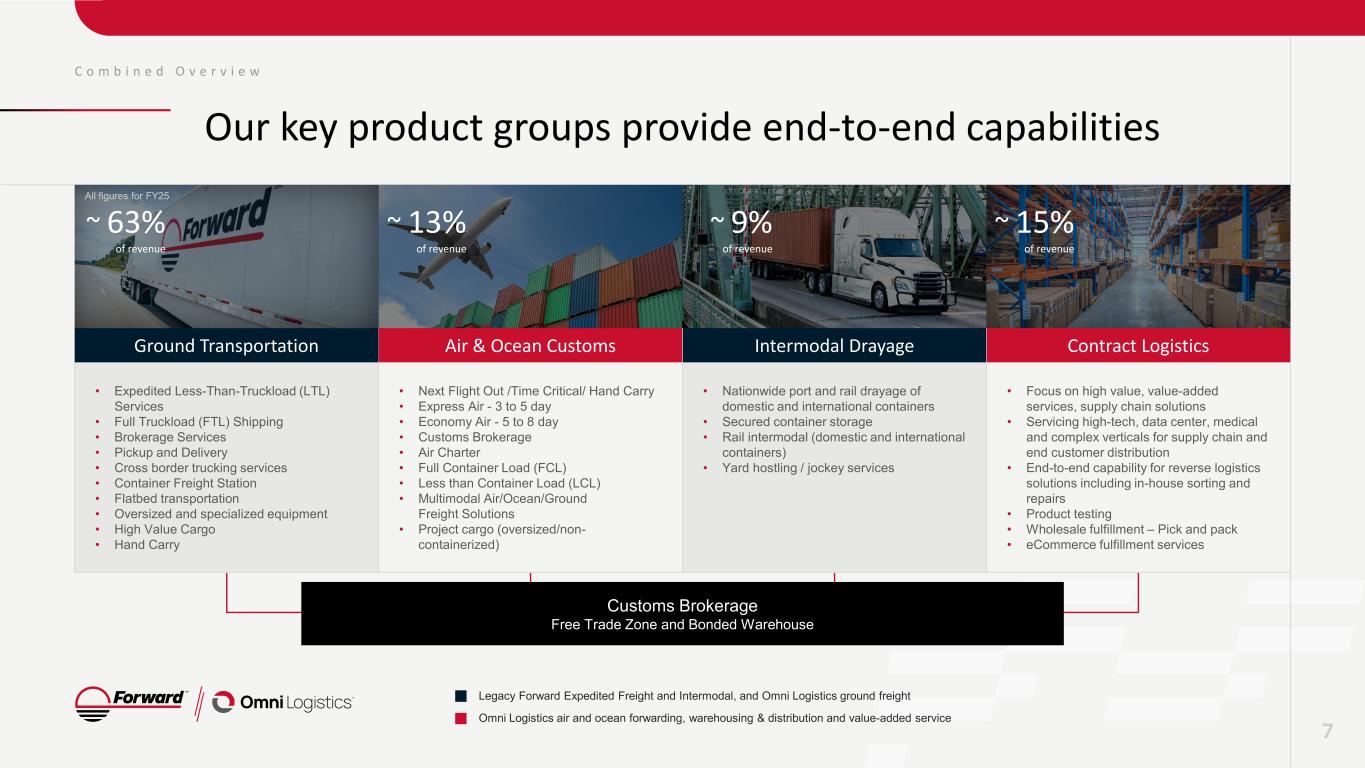
Ground Transportation Air & Ocean Customs Intermodal Drayage Contract Logistics • Expedited Less-Than-Truckload (LTL) Services • Full Truckload (FTL) Shipping • Brokerage Services • Pickup and Delivery • Cross border trucking services • Container Freight Station • Flatbed transportation • Oversized and specialized equipment • High Value Cargo • Hand Carry • Next Flight Out /Time Critical/ Hand Carry • Express Air - 3 to 5 day • Economy Air - 5 to 8 day • Customs Brokerage • Air Charter • Full Container Load (FCL) • Less than Container Load (LCL) • Multimodal Air/Ocean/Ground Freight Solutions • Project cargo (oversized/non- containerized) • Nationwide port and rail drayage of domestic and international containers • Secured container storage • Rail intermodal (domestic and international containers) • Yard hostling / jockey services • Focus on high value, value-added services, supply chain solutions • Servicing high-tech, data center, medical and complex verticals for supply chain and end customer distribution • End-to-end capability for reverse logistics solutions including in-house sorting and repairs • Product testing • Wholesale fulfillment – Pick and pack • eCommerce fulfillment services Customs Brokerage Free Trade Zone and Bonded Warehouse C o m b i n e d O v e r v i e w Our key product groups provide end-to-end capabilities 7 ~ 63% of revenue Legacy Forward Expedited Freight and Intermodal, and Omni Logistics ground freight Omni Logistics air and ocean forwarding, warehousing & distribution and value-added service All figures for FY25 ~ 13% of revenue ~ 9% of revenue ~ 15% of revenue
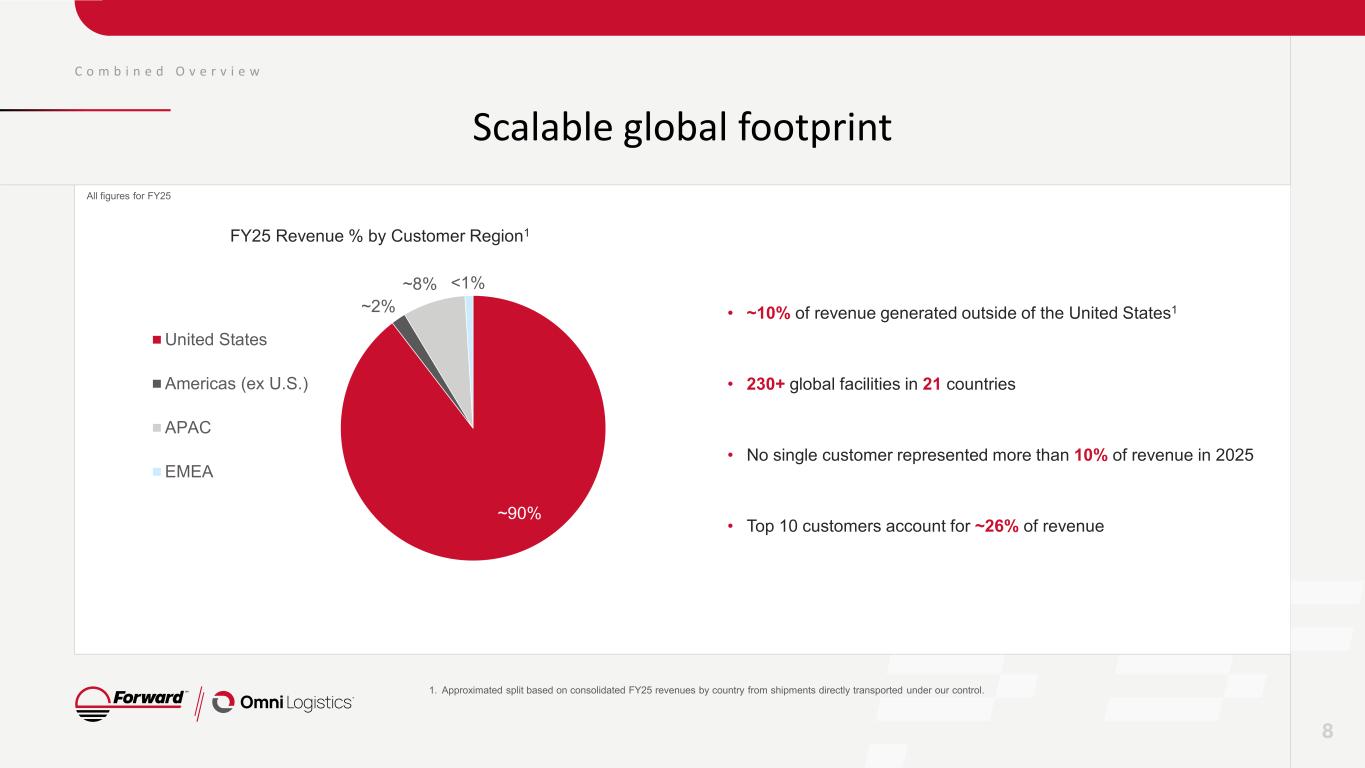
C o m b i n e d O v e r v i e w Scalable global footprint 1. Approximated split based on consolidated FY25 revenues by country from shipments directly transported under our control. 8 ~90% ~2% ~8% <1% United States Americas (ex U.S.) APAC EMEA • ~10% of revenue generated outside of the United States1 • 230+ global facilities in 21 countries • No single customer represented more than 10% of revenue in 2025 • Top 10 customers account for ~26% of revenue FY25 Revenue % by Customer Region1 All figures for FY25
E a r n i n g s P r e s e n t a t i o n 3Q26 Results 9
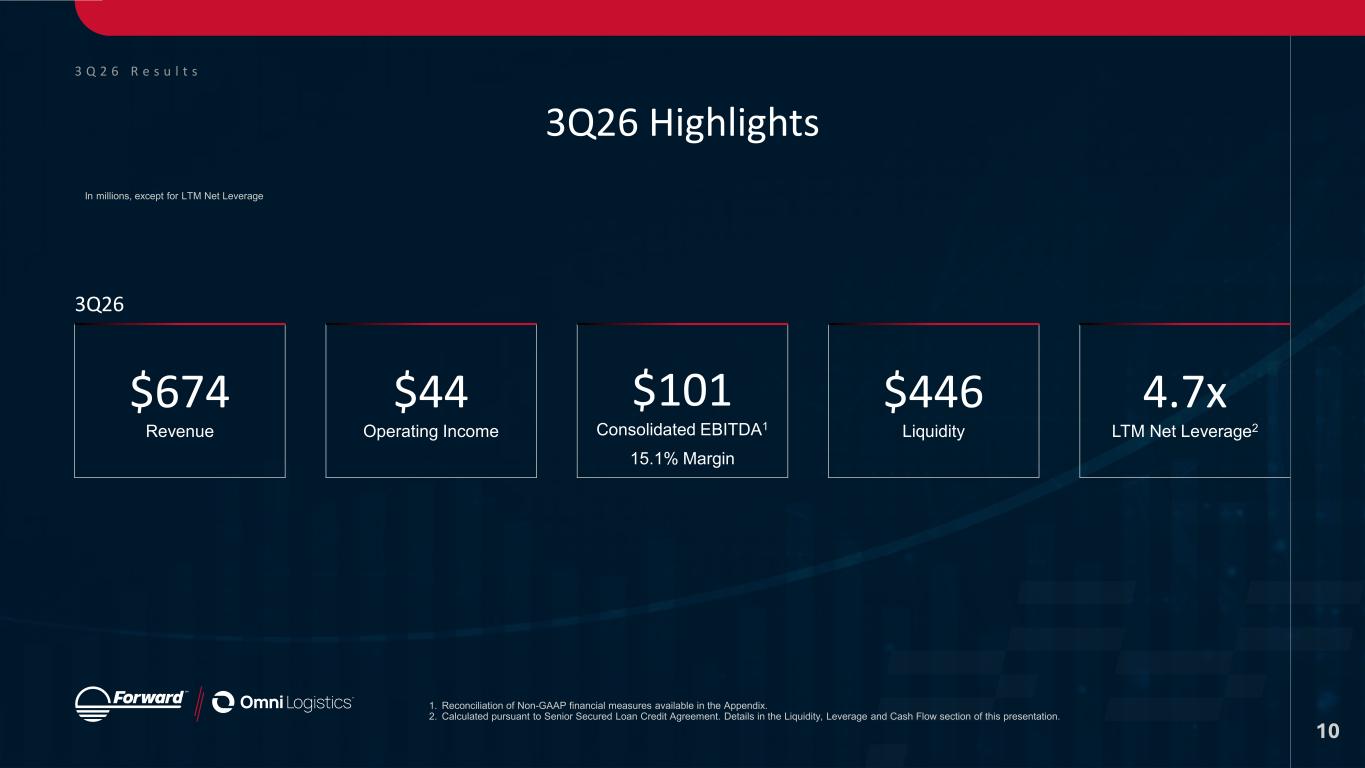
3 Q 2 6 R e s u l t s 3Q26 Highlights 3Q26 $674 Revenue $44 Operating Income $101 Consolidated EBITDA1 15.1% Margin $446 Liquidity 4.7x LTM Net Leverage2 10 1. Reconciliation of Non-GAAP financial measures available in the Appendix. 2. Calculated pursuant to Senior Secured Loan Credit Agreement. Details in the Liquidity, Leverage and Cash Flow section of this presentation. In millions, except for LTM Net Leverage
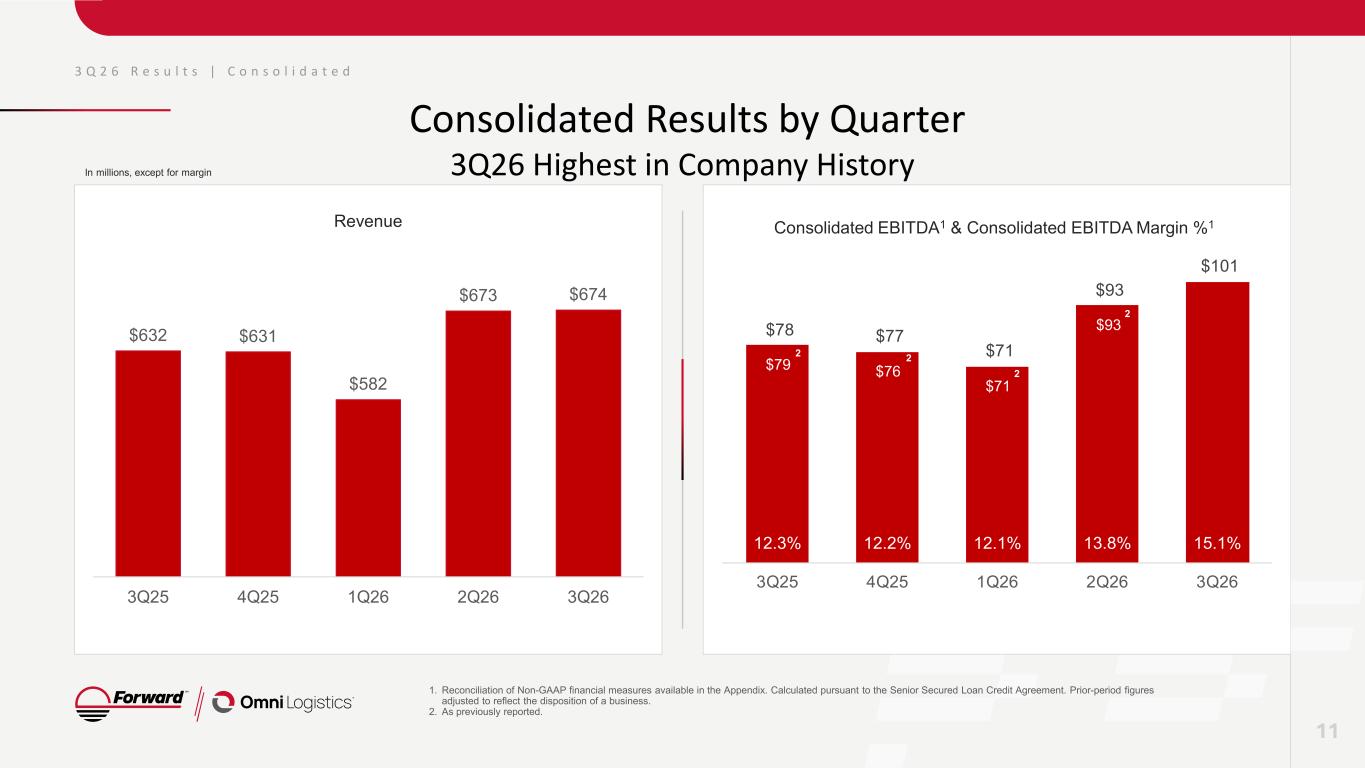
3 Q 2 6 R e s u l t s | C o n s o l i d a t e d Consolidated Results by Quarter 3Q26 Highest in Company History 1. Reconciliation of Non-GAAP financial measures available in the Appendix. Calculated pursuant to the Senior Secured Loan Credit Agreement. Prior-period figures adjusted to reflect the disposition of a business. 2. As previously reported. Revenue Consolidated EBITDA1 & Consolidated EBITDA Margin %1 11 In millions, except for margin 2 22 2 2 2 2 2 $78 $77 $71 $93 $101 12.3% 12.2% 12.1% 13.8% 15.1% 3Q25 4Q25 1Q26 2Q26 3Q26 2 22 2 $632 $631 $582 $673 $674 3Q25 4Q25 1Q26 2Q26 3Q26 $79 $76 $71 $93
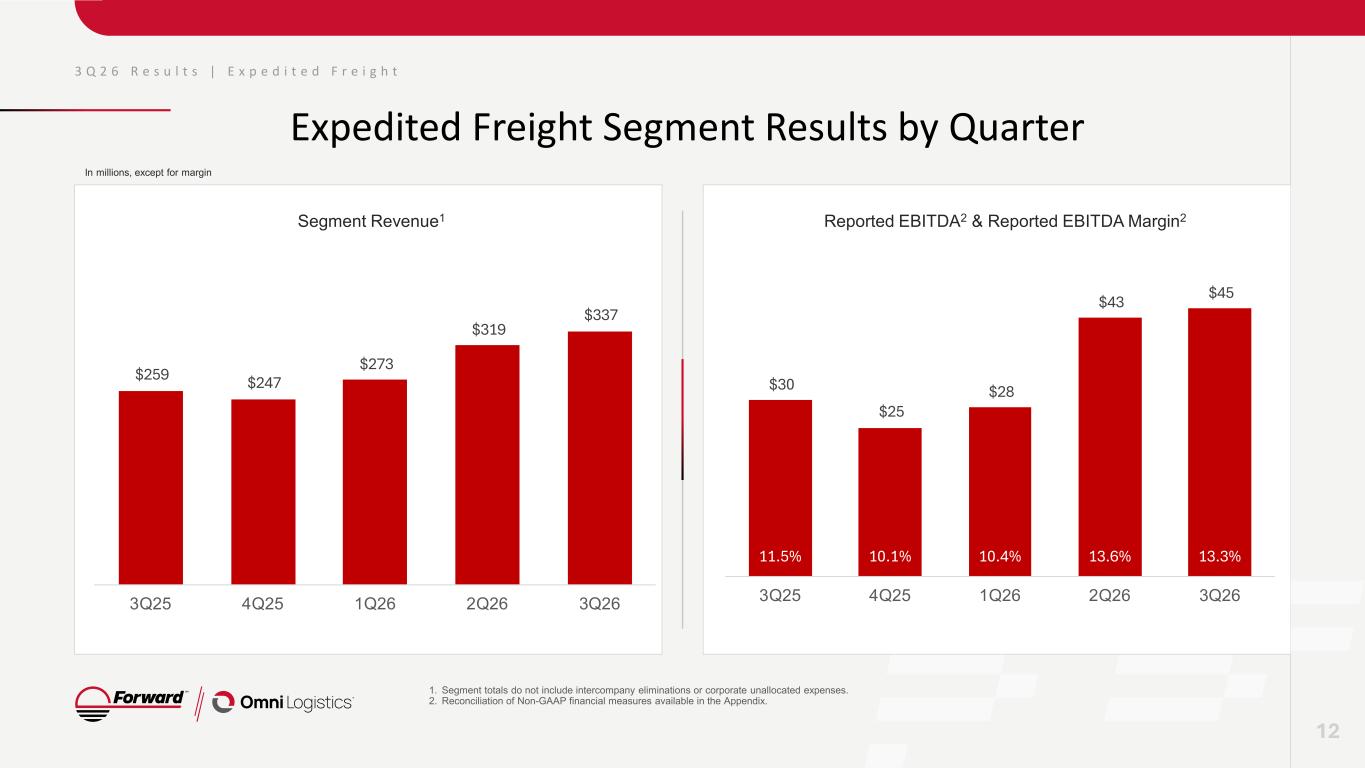
3 Q 2 6 R e s u l t s | E x p e d i t e d F r e i g h t Expedited Freight Segment Results by Quarter 1. Segment totals do not include intercompany eliminations or corporate unallocated expenses. 2. Reconciliation of Non-GAAP financial measures available in the Appendix. Segment Revenue1 Reported EBITDA2 & Reported EBITDA Margin2 12 In millions, except for margin $259 $247 $273 $319 $337 3Q25 4Q25 1Q26 2Q26 3Q26 $30 $25 $28 $43 $45 11.5% 10.1% 10.4% 13.6% 13.3% 3Q25 4Q25 1Q26 2Q26 3Q26
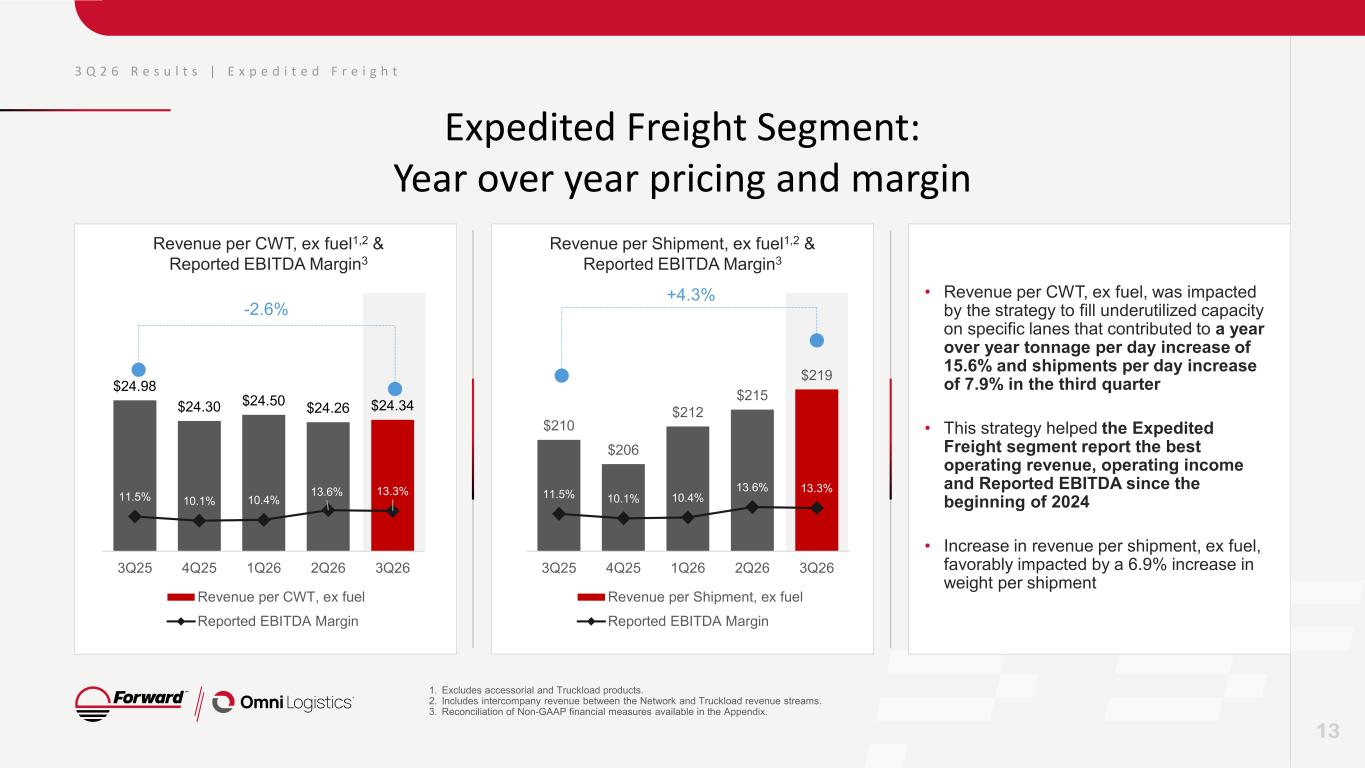
3 Q 2 6 R e s u l t s | E x p e d i t e d F r e i g h t Expedited Freight Segment: Year over year pricing and margin 13 Revenue per CWT, ex fuel1,2 & Reported EBITDA Margin3 Revenue per Shipment, ex fuel1,2 & Reported EBITDA Margin3 $24.98 $24.30 $24.50 $24.26 $24.34 11.5% 10.1% 10.4% 13.6% 13.3% 3Q25 4Q25 1Q26 2Q26 3Q26 Revenue per CWT, ex fuel Reported EBITDA Margin -2.6% $210 $206 $212 $215 $219 11.5% 10.1% 10.4% 13.6% 13.3% 3Q25 4Q25 1Q26 2Q26 3Q26 Revenue per Shipment, ex fuel Reported EBITDA Margin +4.3% 1. Excludes accessorial and Truckload products. 2. Includes intercompany revenue between the Network and Truckload revenue streams. 3. Reconciliation of Non-GAAP financial measures available in the Appendix. • Revenue per CWT, ex fuel, was impacted by the strategy to fill underutilized capacity on specific lanes that contributed to a year over year tonnage per day increase of 15.6% and shipments per day increase of 7.9% in the third quarter • This strategy helped the Expedited Freight segment report the best operating revenue, operating income and Reported EBITDA since the beginning of 2024 • Increase in revenue per shipment, ex fuel, favorably impacted by a 6.9% increase in weight per shipment
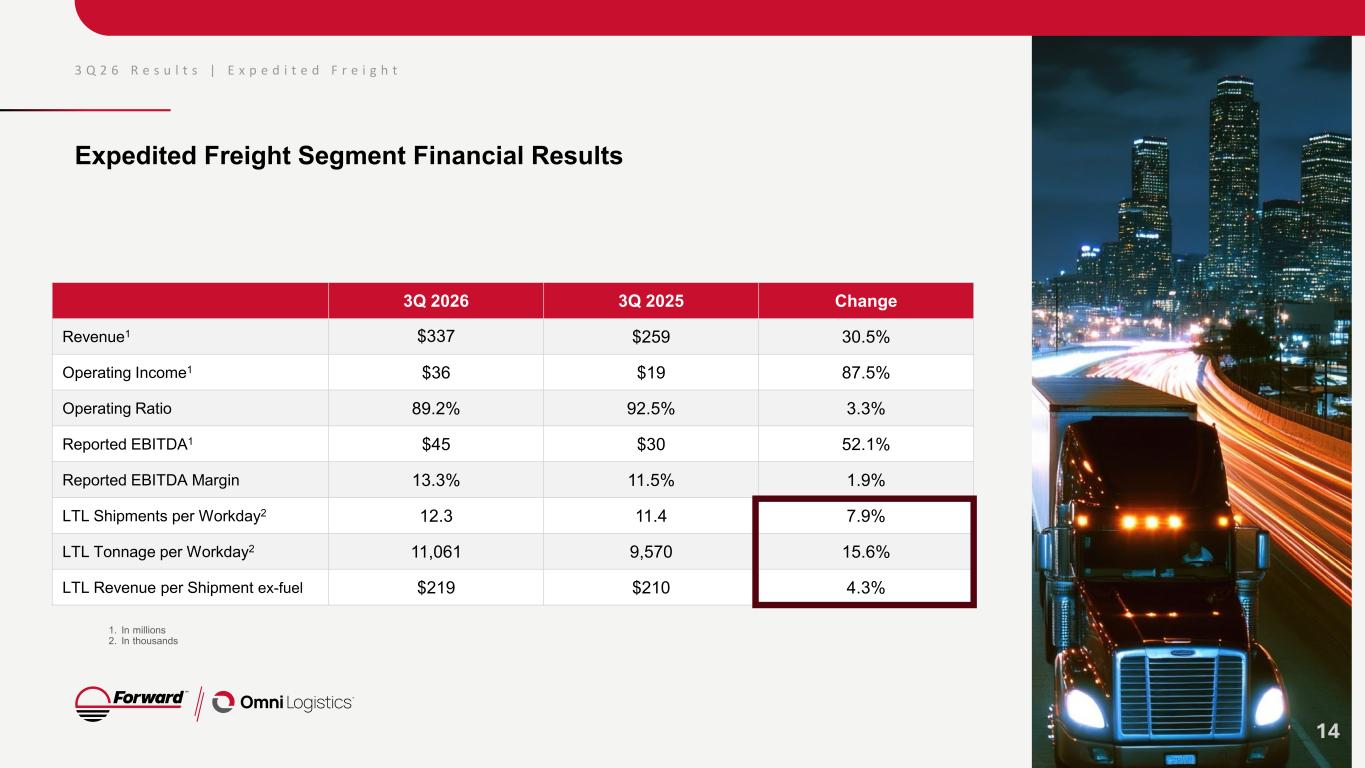
3 Q 2 6 R e s u l t s | E x p e d i t e d F r e i g h t Expedited Freight Segment Financial Results 3Q 2026 3Q 2025 Change Revenue1 $337 $259 30.5% Operating Income1 $36 $19 87.5% Operating Ratio 89.2% 92.5% 3.3% Reported EBITDA1 $45 $30 52.1% Reported EBITDA Margin 13.3% 11.5% 1.9% LTL Shipments per Workday2 12.3 11.4 7.9% LTL Tonnage per Workday2 11,061 9,570 15.6% LTL Revenue per Shipment ex-fuel $219 $210 4.3% 14 1. In millions 2. In thousands
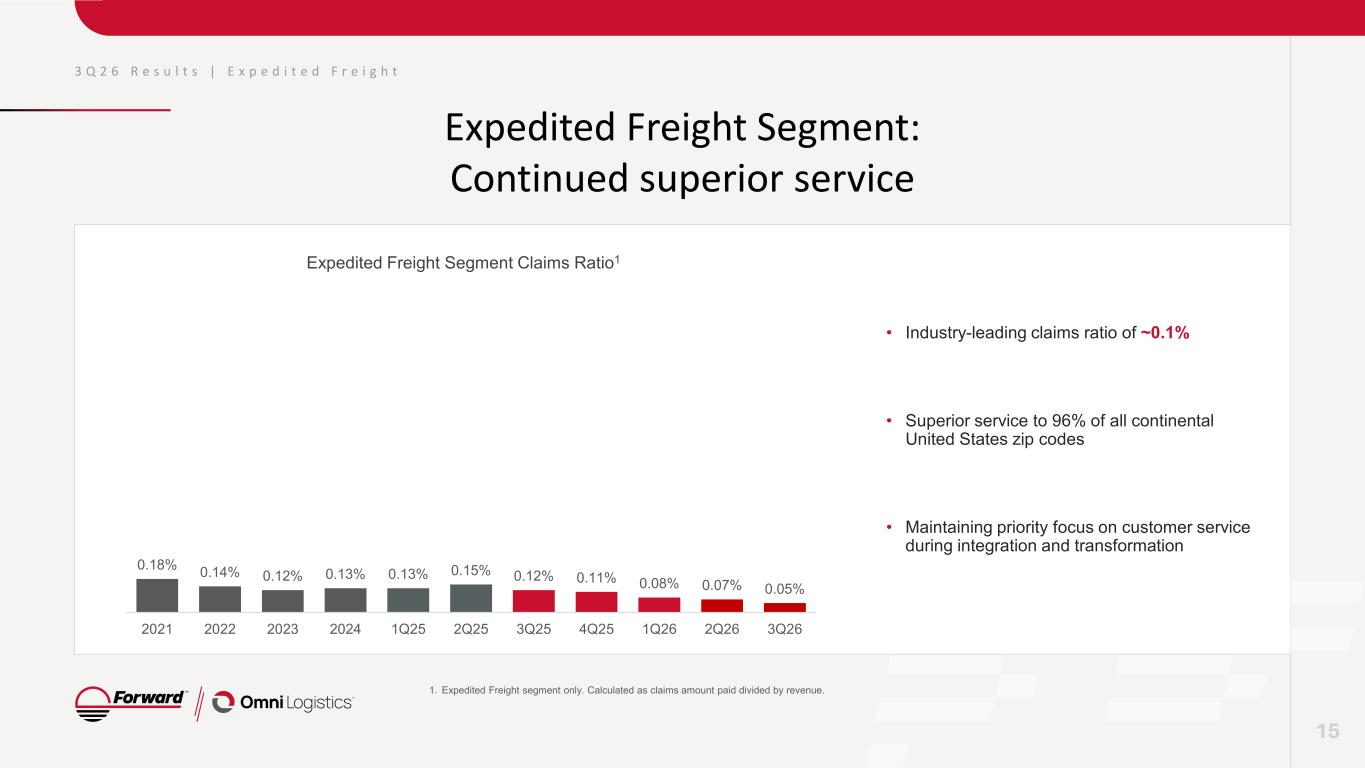
0.18% 0.14% 0.12% 0.13% 0.13% 0.15% 0.12% 0.11% 0.08% 0.07% 0.05% 2021 2022 2023 2024 1Q25 2Q25 3Q25 4Q25 1Q26 2Q26 3Q26 3 Q 2 6 R e s u l t s | E x p e d i t e d F r e i g h t Expedited Freight Segment: Continued superior service 15 Expedited Freight Segment Claims Ratio1 • Industry-leading claims ratio of ~0.1% • Superior service to 96% of all continental United States zip codes • Maintaining priority focus on customer service during integration and transformation 1. Expedited Freight segment only. Calculated as claims amount paid divided by revenue.
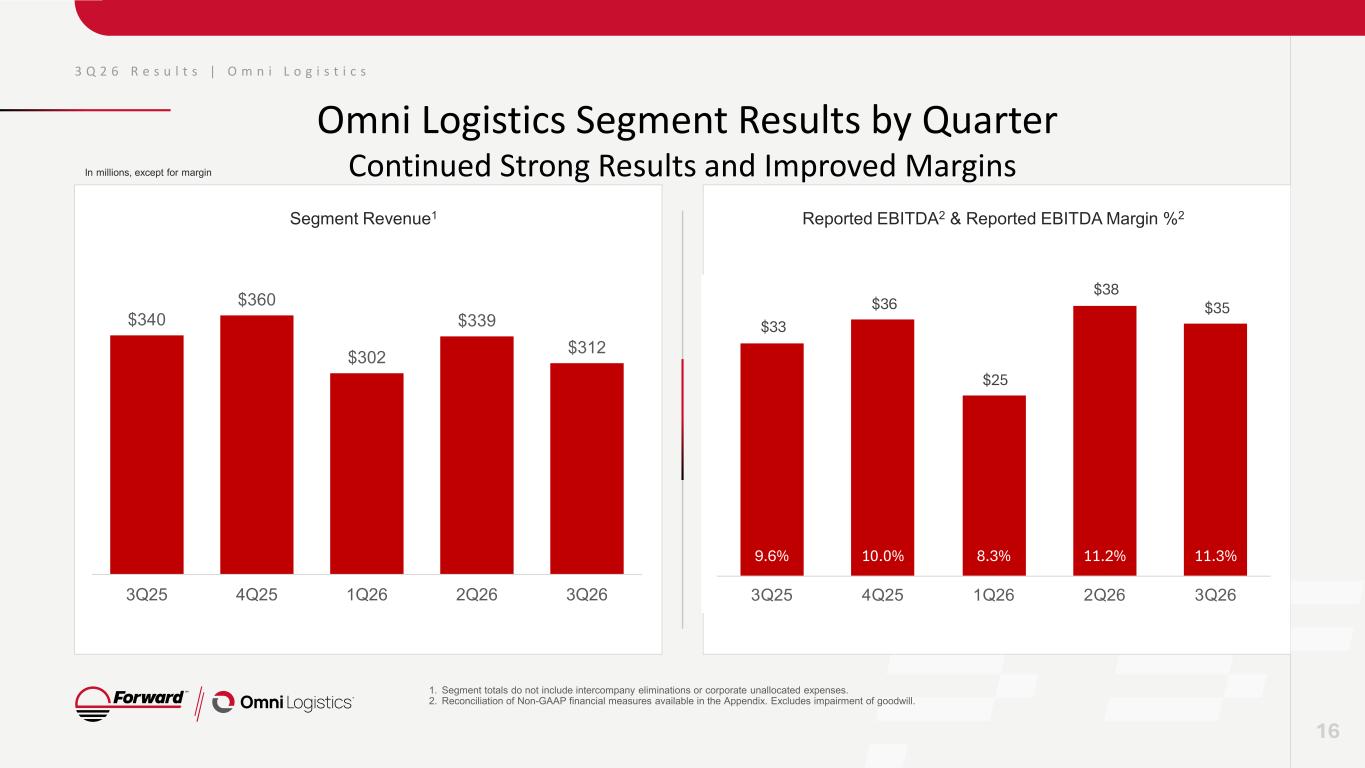
3 Q 2 6 R e s u l t s | O m n i L o g i s t i c s Omni Logistics Segment Results by Quarter Continued Strong Results and Improved Margins Reported EBITDA2 & Reported EBITDA Margin %2Segment Revenue1 16 1. Segment totals do not include intercompany eliminations or corporate unallocated expenses. 2. Reconciliation of Non-GAAP financial measures available in the Appendix. Excludes impairment of goodwill. In millions, except for margin $33 $36 $25 $38 $35 9.6% 10.0% 8.3% 11.2% 11.3% 3Q25 4Q25 1Q26 2Q26 3Q26 $340 $360 $302 $339 $312 3Q25 4Q25 1Q26 2Q26 3Q26
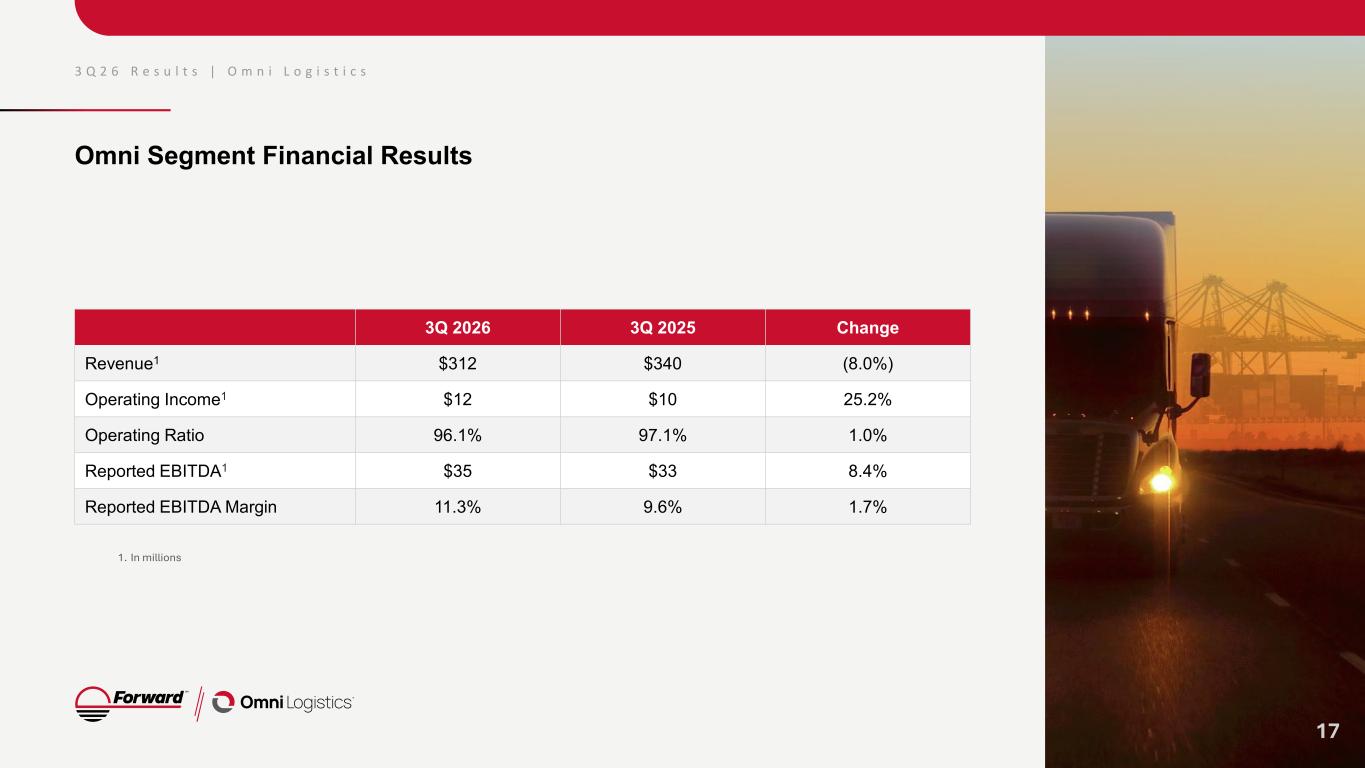
Omni Segment Financial Results 3Q 2026 3Q 2025 Change Revenue1 $312 $340 (8.0%) Operating Income1 $12 $10 25.2% Operating Ratio 96.1% 97.1% 1.0% Reported EBITDA1 $35 $33 8.4% Reported EBITDA Margin 11.3% 9.6% 1.7% 3 Q 2 6 R e s u l t s | O m n i L o g i s t i c s 17 1. In millions
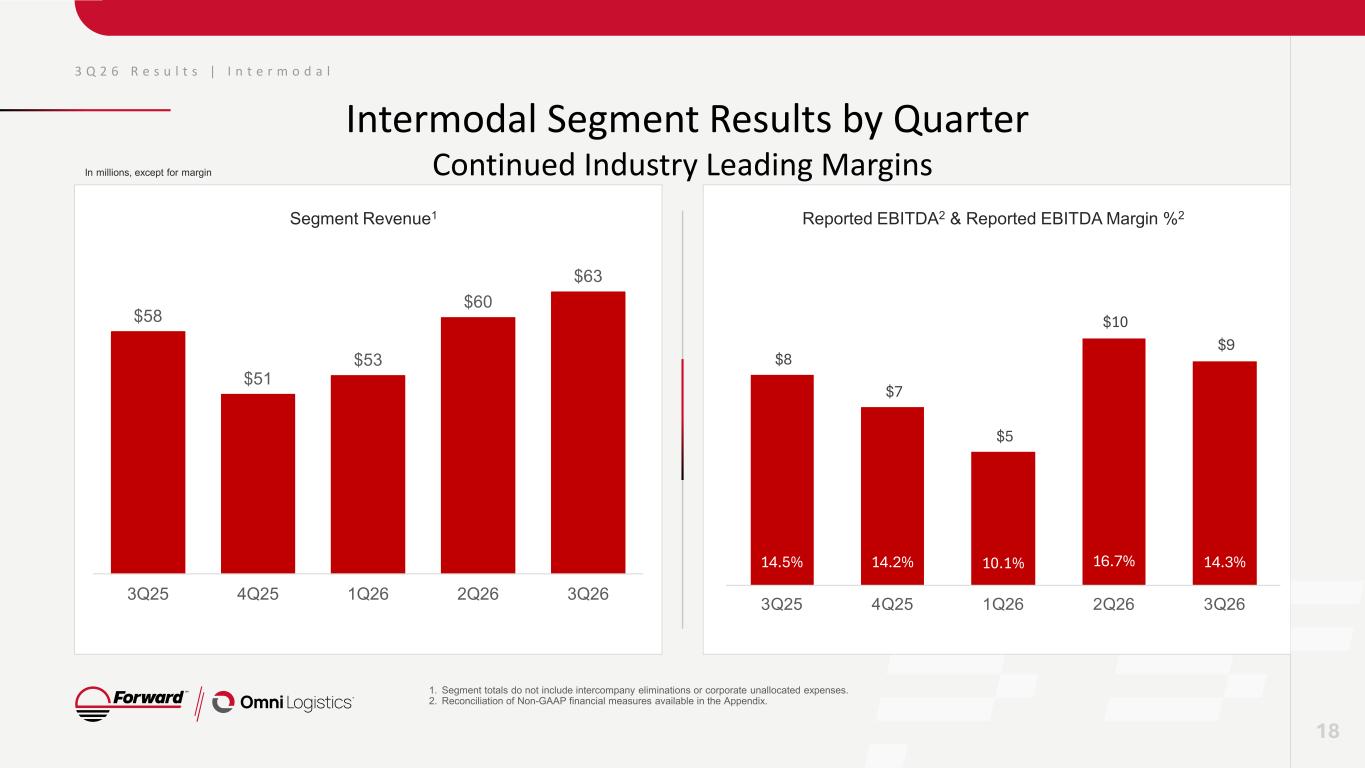
3 Q 2 6 R e s u l t s | I n t e r m o d a l Intermodal Segment Results by Quarter Continued Industry Leading Margins 1. Segment totals do not include intercompany eliminations or corporate unallocated expenses. 2. Reconciliation of Non-GAAP financial measures available in the Appendix. Reported EBITDA2 & Reported EBITDA Margin %2Segment Revenue1 In millions, except for margin 18 $8 $7 $5 $10 $9 14.5% 14.2% 10.1% 16.7% 14.3% 3Q25 4Q25 1Q26 2Q26 3Q26 $58 $51 $53 $60 $63 3Q25 4Q25 1Q26 2Q26 3Q26
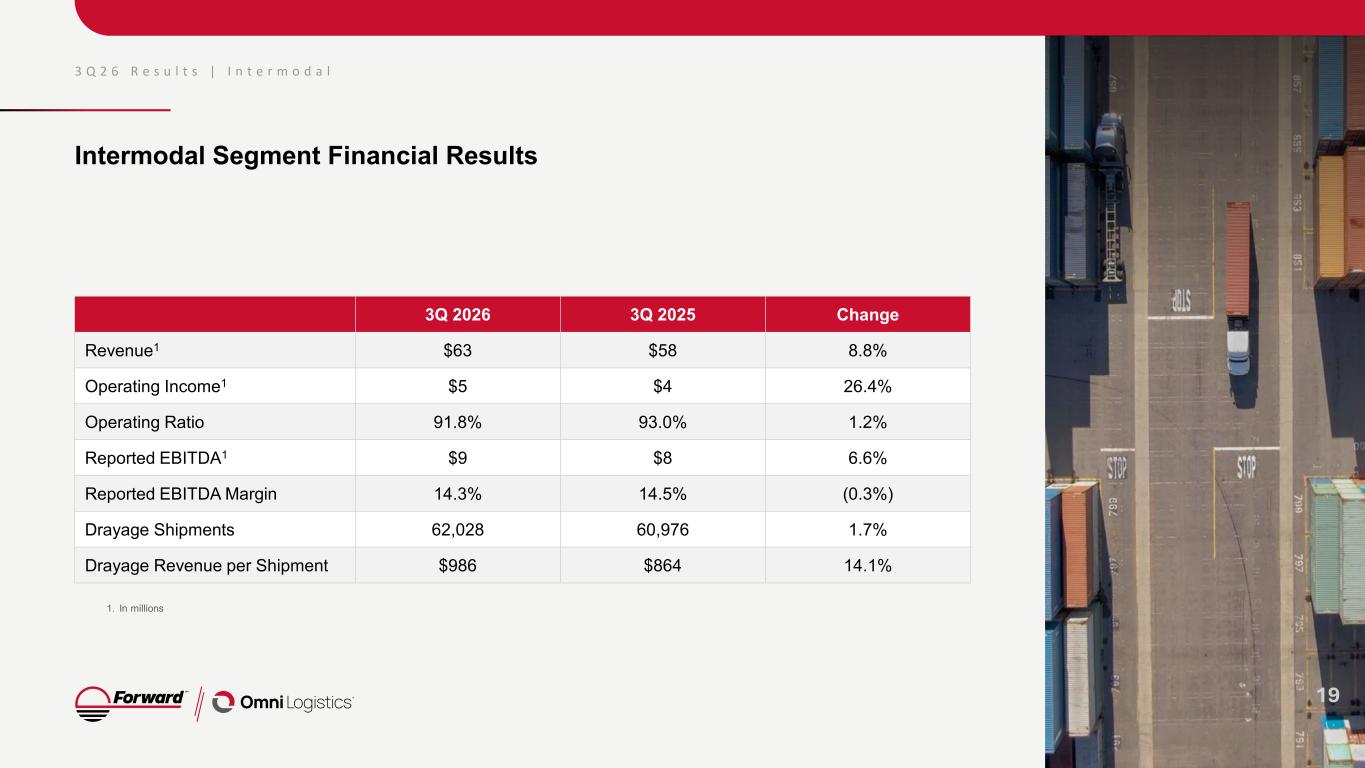
Intermodal Segment Financial Results 3Q 2026 3Q 2025 Change Revenue1 $63 $58 8.8% Operating Income1 $5 $4 26.4% Operating Ratio 91.8% 93.0% 1.2% Reported EBITDA1 $9 $8 6.6% Reported EBITDA Margin 14.3% 14.5% (0.3%) Drayage Shipments 62,028 60,976 1.7% Drayage Revenue per Shipment $986 $864 14.1% 3 Q 2 6 R e s u l t s | I n t e r m o d a l 19 1. In millions
E a r n i n g s P r e s e n t a t i o n Liquidity, Leverage and Cash Flow 20
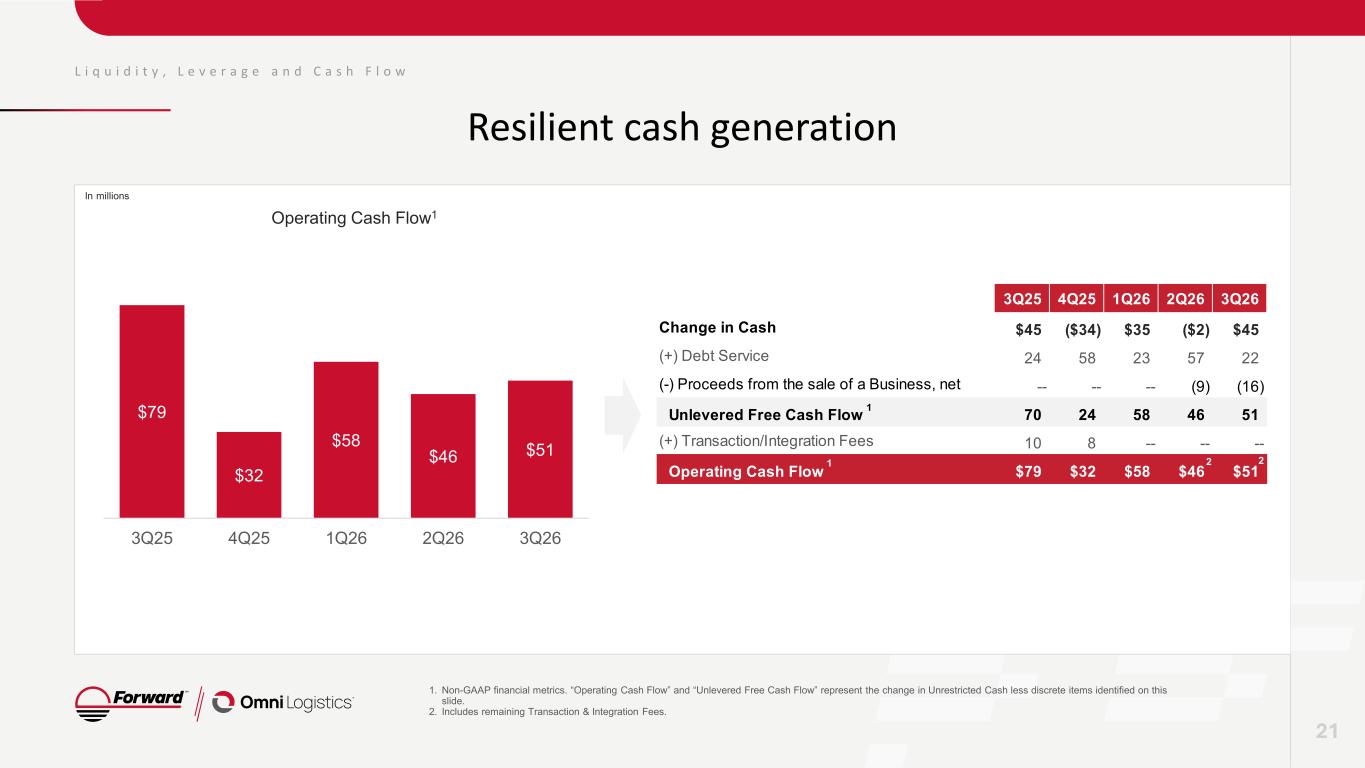
L i q u i d i t y , L e v e r a g e a n d C a s h F l o w Resilient cash generation 1. Non-GAAP financial metrics. “Operating Cash Flow” and “Unlevered Free Cash Flow” represent the change in Unrestricted Cash less discrete items identified on this slide. 2. Includes remaining Transaction & Integration Fees. 21 Operating Cash Flow1 In millions $79 $32 $58 $46 $51 3Q25 4Q25 1Q26 2Q26 3Q26 3Q25 4Q25 1Q26 2Q26 3Q26 Change in Cash $45 ($34) $35 ($2) $45 (+) Debt Service 24 58 23 57 22 (-) Proceeds from the sale of a Business, net -- -- -- (9) (16) Unlevered Free Cash Flow 70 24 58 46 51 (+) Transaction/Integration Fees 10 8 -- -- -- Operating Cash Flow $79 $32 $58 $46 $51 2 21 1
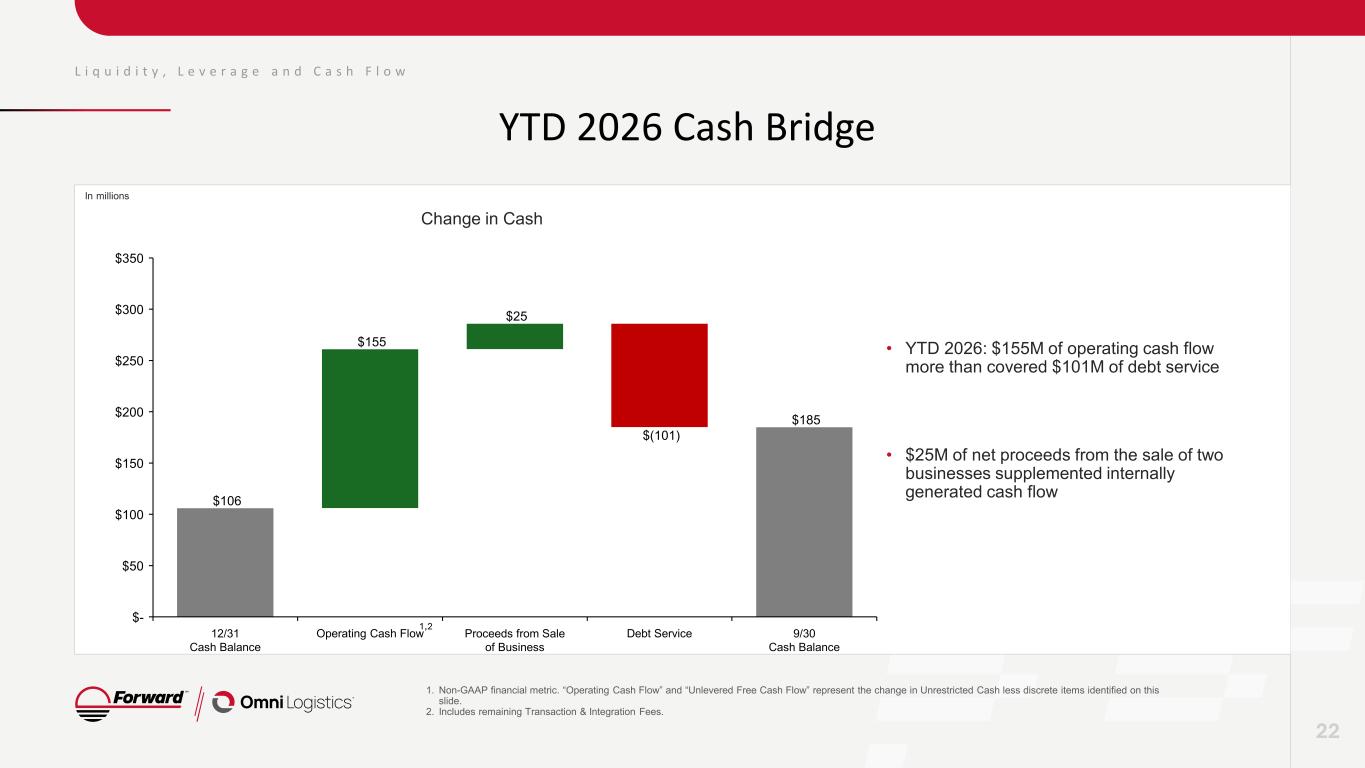
L i q u i d i t y , L e v e r a g e a n d C a s h F l o w YTD 2026 Cash Bridge 22 Change in Cash 1. Non-GAAP financial metric. “Operating Cash Flow” and “Unlevered Free Cash Flow” represent the change in Unrestricted Cash less discrete items identified on this slide. 2. Includes remaining Transaction & Integration Fees. • YTD 2026: $155M of operating cash flow more than covered $101M of debt service • $25M of net proceeds from the sale of two businesses supplemented internally generated cash flow In millions $106 $155 $25 $(101) $185 12/31 Cash Balance Operating Cash Flow Proceeds from Sale of Business Debt Service 9/30 Cash Balance $- $50 $100 $150 $200 $250 $300 $350 1,2
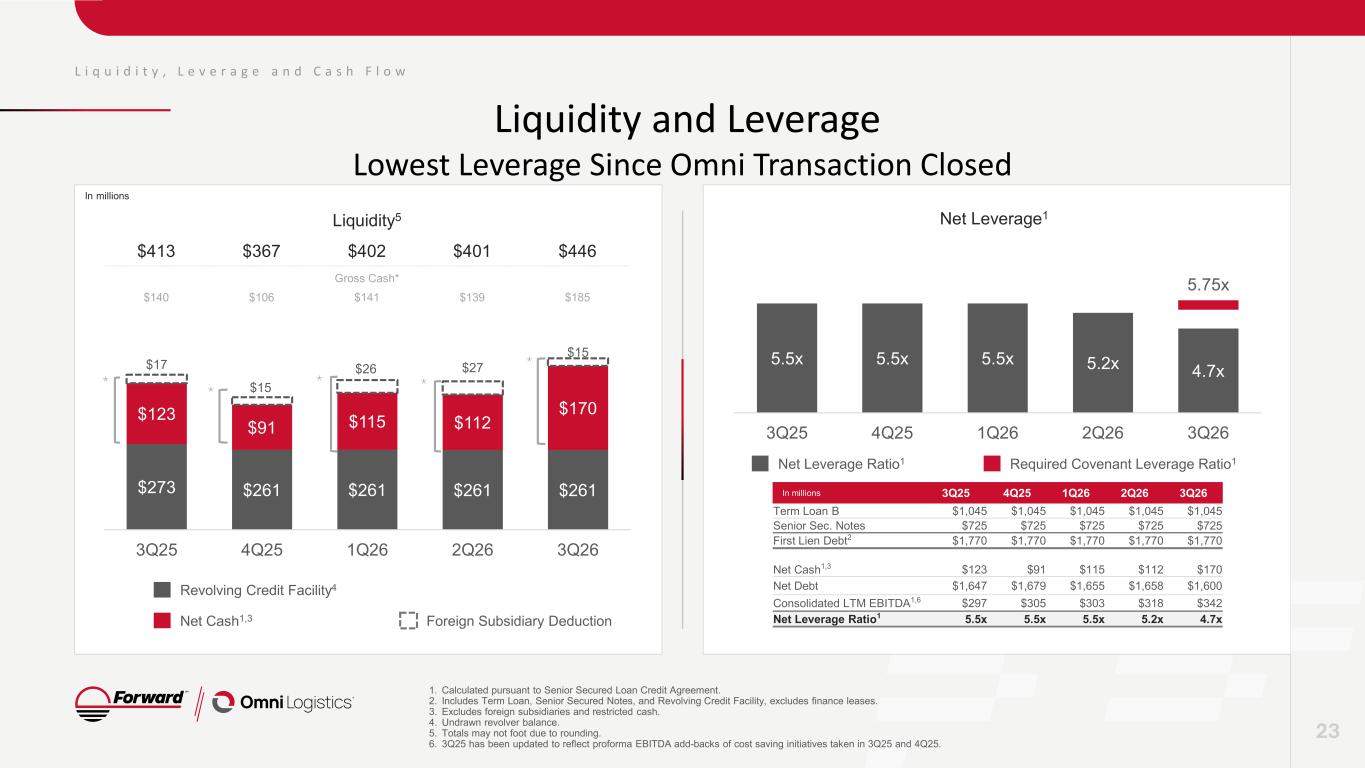
$273 $261 $261 $261 $261 $123 $91 $115 $112 $170 $17 $15 $26 $27 $15 3Q25 4Q25 1Q26 2Q26 3Q26 L i q u i d i t y , L e v e r a g e a n d C a s h F l o w Liquidity and Leverage Lowest Leverage Since Omni Transaction Closed Net Leverage1 Net Leverage Ratio1 Required Covenant Leverage Ratio1 Net Cash1,3 Revolving Credit Facility4 Foreign Subsidiary Deduction * 23 * * * * 1. Calculated pursuant to Senior Secured Loan Credit Agreement. 2. Includes Term Loan, Senior Secured Notes, and Revolving Credit Facility, excludes finance leases. 3. Excludes foreign subsidiaries and restricted cash. 4. Undrawn revolver balance. 5. Totals may not foot due to rounding. 6. 3Q25 has been updated to reflect proforma EBITDA add-backs of cost saving initiatives taken in 3Q25 and 4Q25. In millions 5.5x 5.5x 5.5x 5.2x 4.7x 5.75x 3Q25 4Q25 1Q26 2Q26 3Q26 Liquidity5 $413 $367 $402 $401 $446 Gross Cash* $140 $106 $141 $139 $185 In millions 3Q25 4Q25 1Q26 2Q26 3Q26 Term Loan B $1,045 $1,045 $1,045 $1,045 $1,045 Senior Sec. Notes $725 $725 $725 $725 $725 First Lien Debt2 $1,770 $1,770 $1,770 $1,770 $1,770 Net Cash1,3 $123 $91 $115 $112 $170 Net Debt $1,647 $1,679 $1,655 $1,658 $1,600 Consolidated LTM EBITDA1,6 $297 $305 $303 $318 $342 Net Leverage Ratio1 5.5x 5.5x 5.5x 5.2x 4.7x
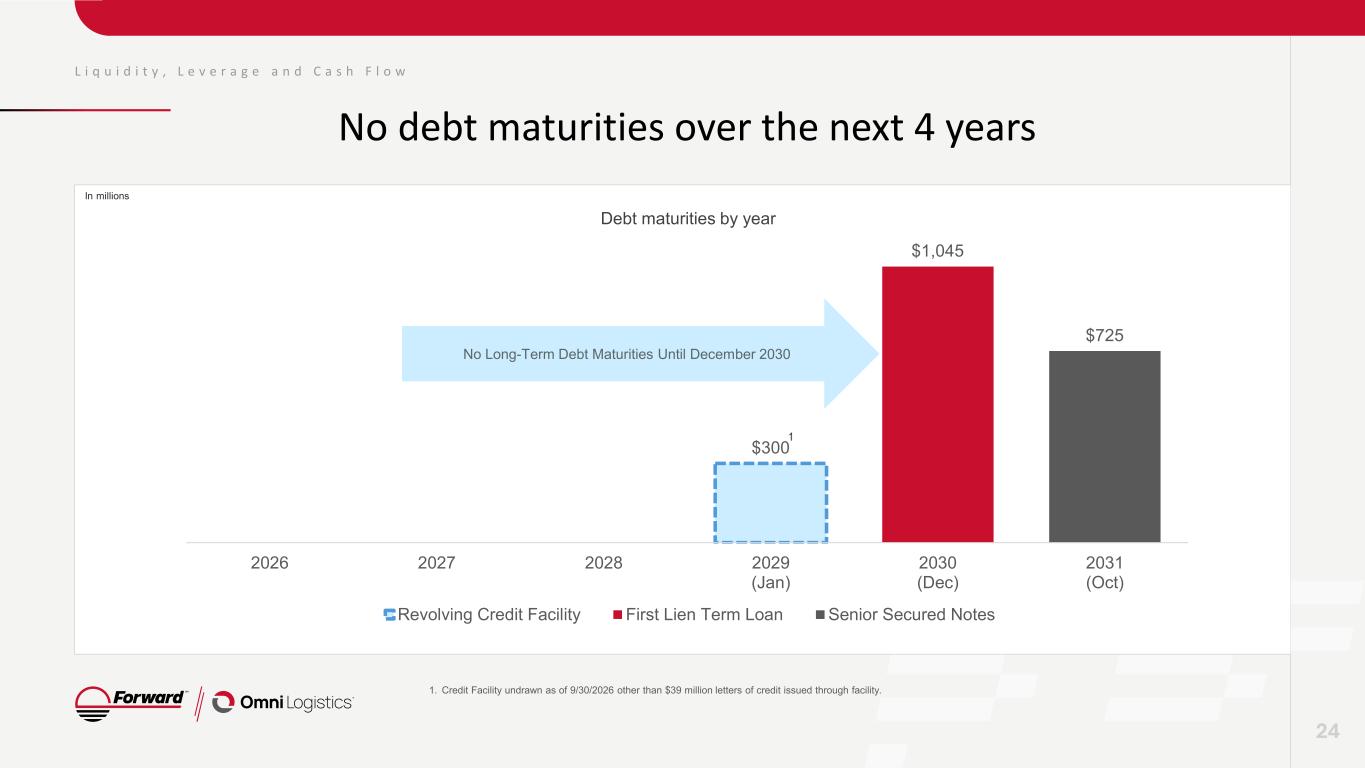
L i q u i d i t y , L e v e r a g e a n d C a s h F l o w No debt maturities over the next 4 years 1. Credit Facility undrawn as of 9/30/2026 other than $39 million letters of credit issued through facility. 24 $300 $1,045 $725 2026 2027 2028 2029 (Jan) 2030 (Dec) 2031 (Oct) Revolving Credit Facility First Lien Term Loan Senior Secured Notes No Long-Term Debt Maturities Until December 2030 Debt maturities by year In millions
E a r n i n g s P r e s e n t a t i o n Investment Rationale 25
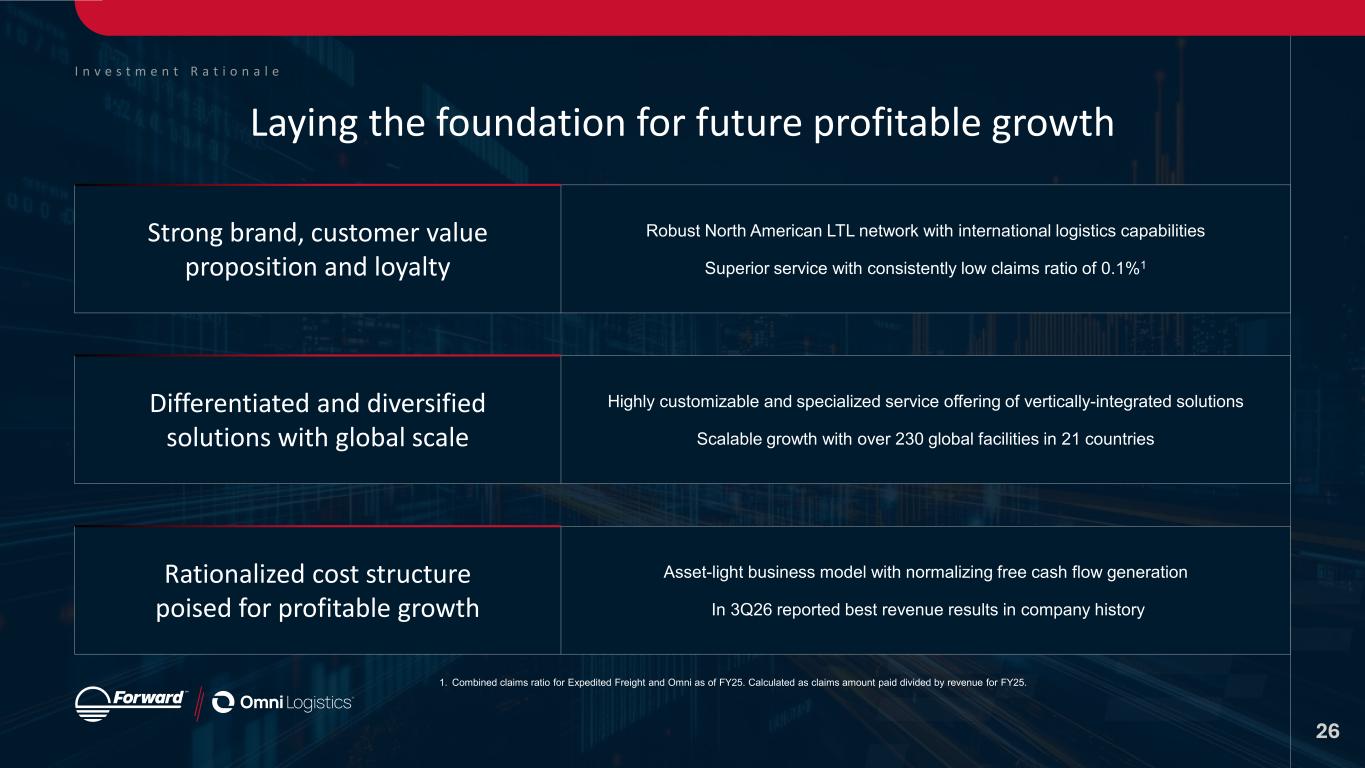
I n v e s t m e n t R a t i o n a l e Laying the foundation for future profitable growth Strong brand, customer value proposition and loyalty Robust North American LTL network with international logistics capabilities Superior service with consistently low claims ratio of 0.1%1 Differentiated and diversified solutions with global scale Highly customizable and specialized service offering of vertically-integrated solutions Scalable growth with over 230 global facilities in 21 countries Rationalized cost structure poised for profitable growth Asset-light business model with normalizing free cash flow generation In 3Q26 reported best revenue results in company history 26 1. Combined claims ratio for Expedited Freight and Omni as of FY25. Calculated as claims amount paid divided by revenue for FY25.
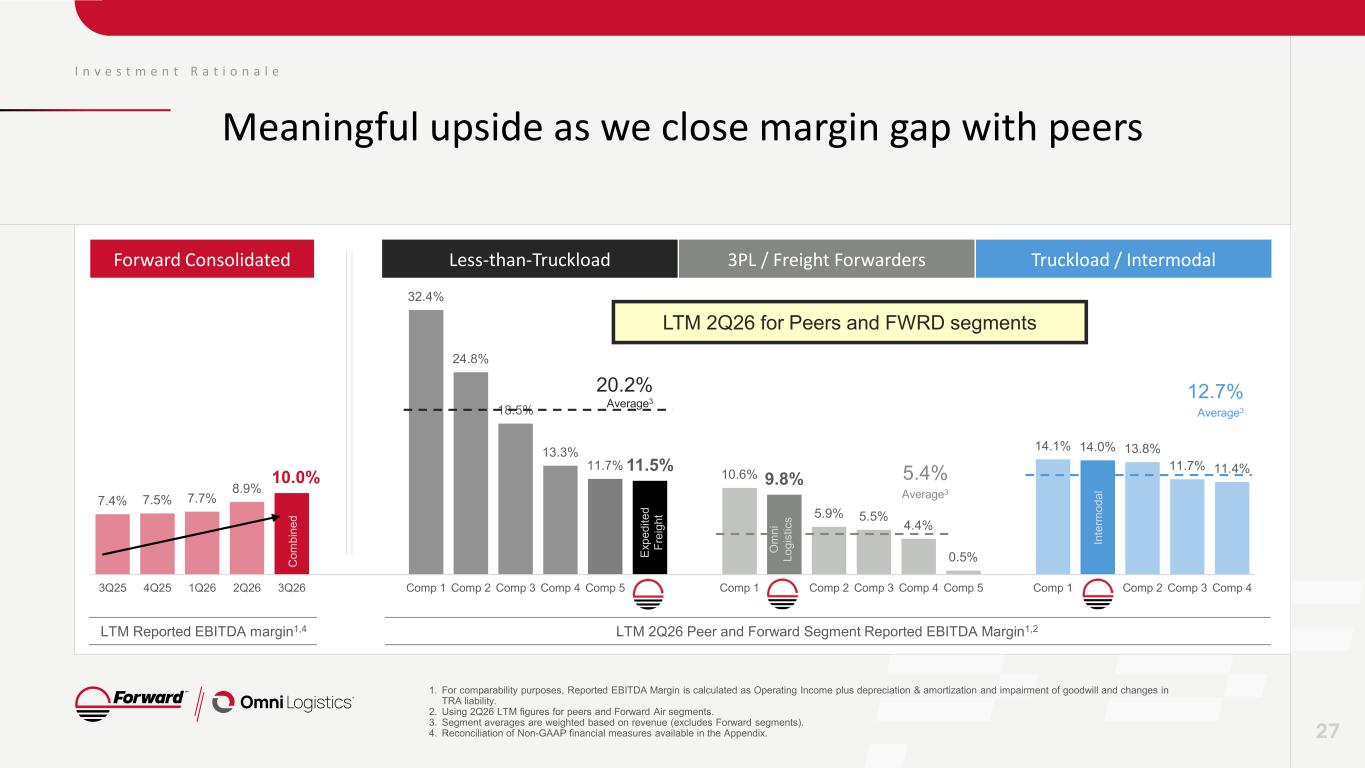
7.4% 7.5% 7.7% 8.9% 10.0% 32.4% 24.8% 18.5% 13.3% 11.7% 11.5% 10.6% 9.8% 5.9% 5.5% 4.4% 0.5% 14.1% 14.0% 13.8% 11.7% 11.4% 3Q25 4Q25 1Q26 2Q26 3Q26 Comp 1 Comp 2 Comp 3 Comp 4 Comp 5 Comp 1 Comp 2 Comp 3 Comp 4 Comp 5 Comp 1 Comp 2 Comp 3 Comp 4 I n v e s t m e n t R a t i o n a l e Meaningful upside as we close margin gap with peers 1. For comparability purposes, Reported EBITDA Margin is calculated as Operating Income plus depreciation & amortization and impairment of goodwill and changes in TRA liability. 2. Using 2Q26 LTM figures for peers and Forward Air segments. 3. Segment averages are weighted based on revenue (excludes Forward segments). 4. Reconciliation of Non-GAAP financial measures available in the Appendix. 20.2% Average3 5.4% Average3 12.7% Average3 27 Forward Consolidated Less-than-Truckload 3PL / Freight Forwarders Truckload / Intermodal LTM Reported EBITDA margin1,4 LTM 2Q26 Peer and Forward Segment Reported EBITDA Margin1,2 Ex pe di te d Fr ei gh t O m ni Lo gi st ic s In te rm od al C om bi ne d LTM 2Q26 for Peers and FWRD segments
E a r n i n g s P r e s e n t a t i o n Closing Summary 01 Reports highest quarterly revenue in company history in consecutive quarters 02 Expedited Freight segment leads strong quarter and reports best results since the beginning of 2024 03 Execution at all three segments contributed to strong quarterly performance 04 Liquidity improves to $446 million 05 Realizing the benefits of diversified product portfolio 28
E a r n i n g s P r e s e n t a t i o n Appendix 29
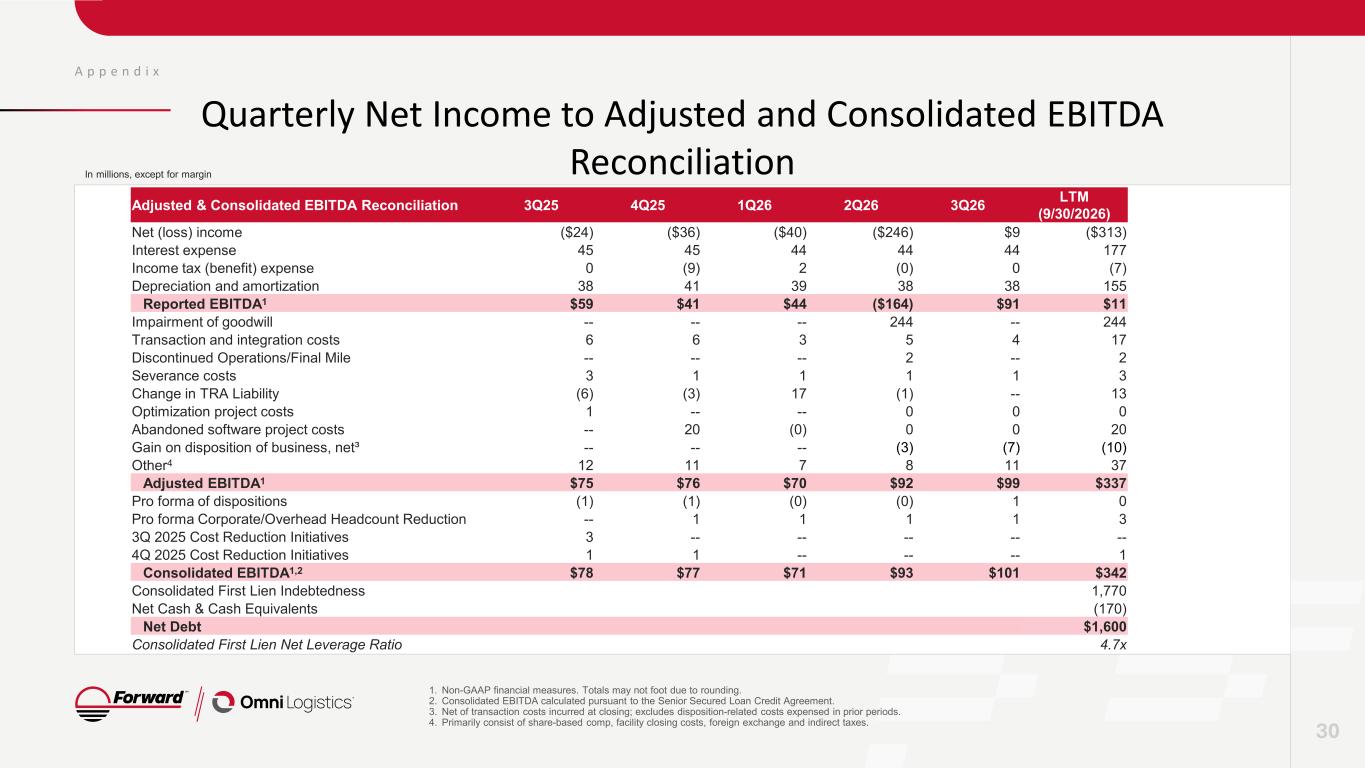
A p p e n d i x 30 1. Non-GAAP financial measures. Totals may not foot due to rounding. 2. Consolidated EBITDA calculated pursuant to the Senior Secured Loan Credit Agreement. 3. Net of transaction costs incurred at closing; excludes disposition-related costs expensed in prior periods. 4. Primarily consist of share-based comp, facility closing costs, foreign exchange and indirect taxes. In millions, except for margin Quarterly Net Income to Adjusted and Consolidated EBITDA Reconciliation Adjusted & Consolidated EBITDA Reconciliation 3Q25 4Q25 1Q26 2Q26 3Q26 LTM (9/30/2026) Net (loss) income ($24) ($36) ($40) ($246) $9 ($313) Interest expense 45 45 44 44 44 177 Income tax (benefit) expense 0 (9) 2 (0) 0 (7) Depreciation and amortization 38 41 39 38 38 155 Reported EBITDA1 $59 $41 $44 ($164) $91 $11 Impairment of goodwill -- -- -- 244 -- 244 Transaction and integration costs 6 6 3 5 4 17 Discontinued Operations/Final Mile -- -- -- 2 -- 2 Severance costs 3 1 1 1 1 3 Change in TRA Liability (6) (3) 17 (1) -- 13 Optimization project costs 1 -- -- 0 0 0 Abandoned software project costs -- 20 (0) 0 0 20 Gain on disposition of business, net³ -- -- -- (3) (7) (10) Other4 12 11 7 8 11 37 Adjusted EBITDA1 $75 $76 $70 $92 $99 $337 Pro forma of dispositions (1) (1) (0) (0) 1 0 Pro forma Corporate/Overhead Headcount Reduction -- 1 1 1 1 3 3Q 2025 Cost Reduction Initiatives 3 -- -- -- -- -- 4Q 2025 Cost Reduction Initiatives 1 1 -- -- -- 1 Consolidated EBITDA1,2 $78 $77 $71 $93 $101 $342 Consolidated First Lien Indebtedness 1,770 Net Cash & Cash Equivalents (170) Net Debt $1,600 Consolidated First Lien Net Leverage Ratio 4.7x
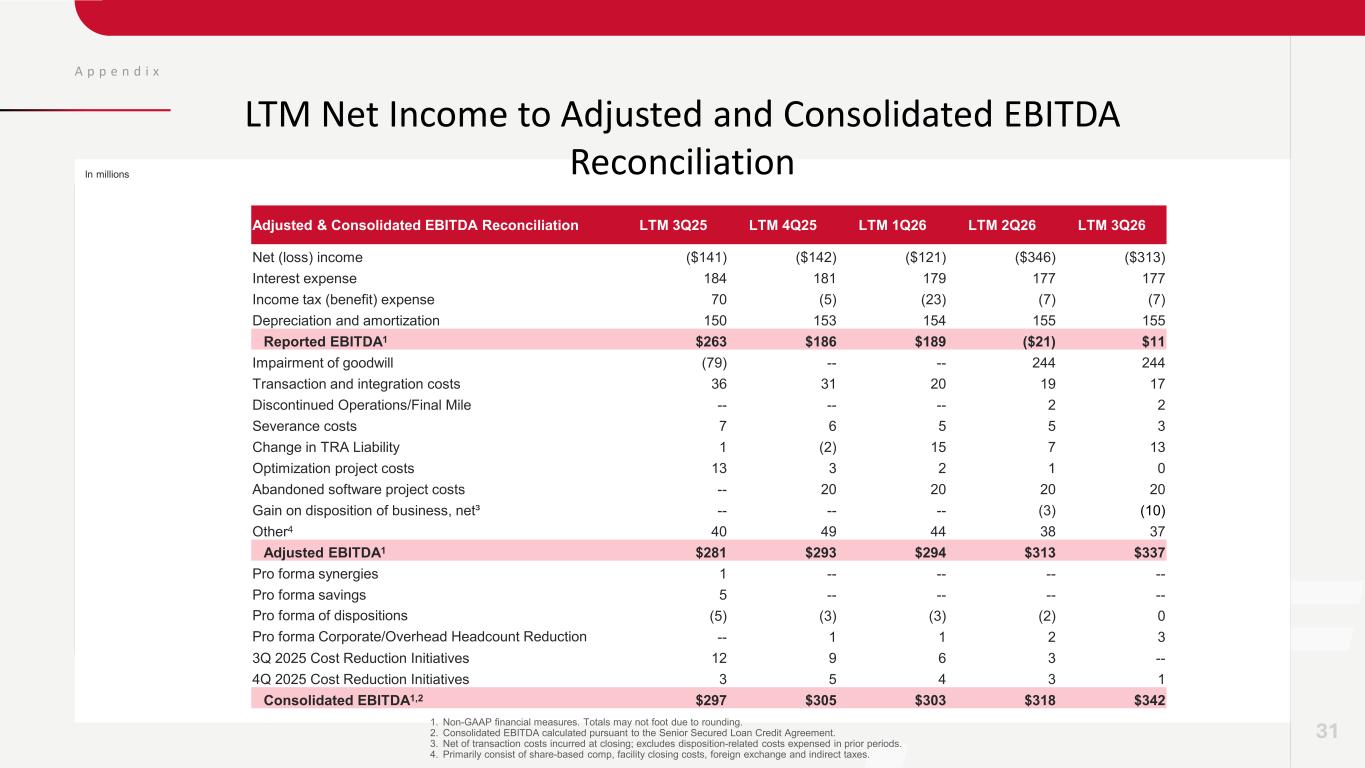
A p p e n d i x 311. Non-GAAP financial measures. Totals may not foot due to rounding. 2. Consolidated EBITDA calculated pursuant to the Senior Secured Loan Credit Agreement. 3. Net of transaction costs incurred at closing; excludes disposition-related costs expensed in prior periods. 4. Primarily consist of share-based comp, facility closing costs, foreign exchange and indirect taxes. In millions LTM Net Income to Adjusted and Consolidated EBITDA Reconciliation Adjusted & Consolidated EBITDA Reconciliation LTM 3Q25 LTM 4Q25 LTM 1Q26 LTM 2Q26 LTM 3Q26 Net (loss) income ($141) ($142) ($121) ($346) ($313) Interest expense 184 181 179 177 177 Income tax (benefit) expense 70 (5) (23) (7) (7) Depreciation and amortization 150 153 154 155 155 Reported EBITDA1 $263 $186 $189 ($21) $11 Impairment of goodwill (79) -- -- 244 244 Transaction and integration costs 36 31 20 19 17 Discontinued Operations/Final Mile -- -- -- 2 2 Severance costs 7 6 5 5 3 Change in TRA Liability 1 (2) 15 7 13 Optimization project costs 13 3 2 1 0 Abandoned software project costs -- 20 20 20 20 Gain on disposition of business, net³ -- -- -- (3) (10) Other4 40 49 44 38 37 Adjusted EBITDA1 $281 $293 $294 $313 $337 Pro forma synergies 1 -- -- -- -- Pro forma savings 5 -- -- -- -- Pro forma of dispositions (5) (3) (3) (2) 0 Pro forma Corporate/Overhead Headcount Reduction -- 1 1 2 3 3Q 2025 Cost Reduction Initiatives 12 9 6 3 -- 4Q 2025 Cost Reduction Initiatives 3 5 4 3 1 Consolidated EBITDA1,2 $297 $305 $303 $318 $342
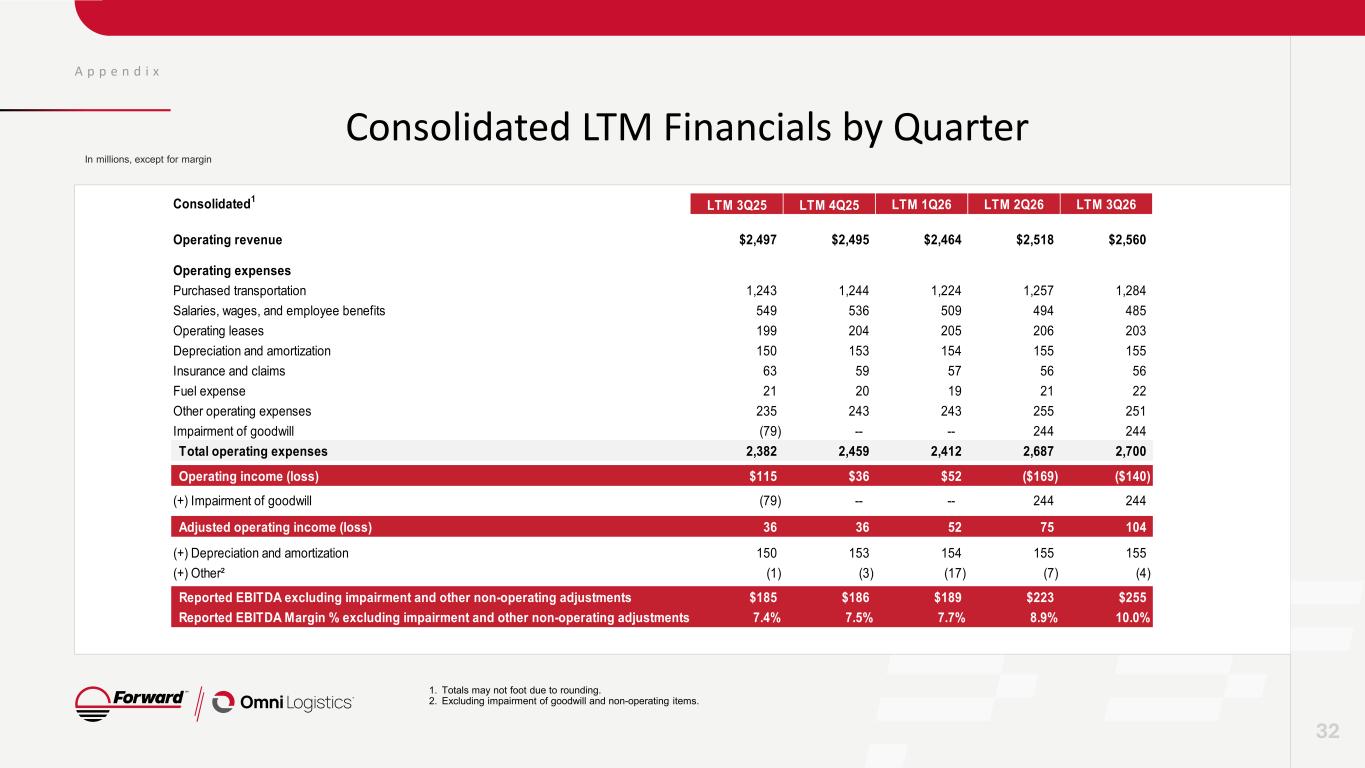
A p p e n d i x Consolidated LTM Financials by Quarter 32 1. Totals may not foot due to rounding. 2. Excluding impairment of goodwill and non-operating items. In millions, except for margin Consolidated1 LTM 3Q25 LTM 4Q25 LTM 1Q26 LTM 2Q26 LTM 3Q26 Operating revenue $2,497 $2,495 $2,464 $2,518 $2,560 Operating expenses Purchased transportation 1,243 1,244 1,224 1,257 1,284 Salaries, wages, and employee benefits 549 536 509 494 485 Operating leases 199 204 205 206 203 Depreciation and amortization 150 153 154 155 155 Insurance and claims 63 59 57 56 56 Fuel expense 21 20 19 21 22 Other operating expenses 235 243 243 255 251 Impairment of goodwill (79) -- -- 244 244 Total operating expenses 2,382 2,459 2,412 2,687 2,700 Operating income (loss) $115 $36 $52 ($169) ($140) (+) Impairment of goodwill (79) -- -- 244 244 Adjusted operating income (loss) 36 36 52 75 104 (+) Depreciation and amortization 150 153 154 155 155 (+) Other² (1) (3) (17) (7) (4) Reported EBITDA excluding impairment and other non-operating adjustments $185 $186 $189 $223 $255 Reported EBITDA Margin % excluding impairment and other non-operating adjustments 7.4% 7.5% 7.7% 8.9% 10.0% 2
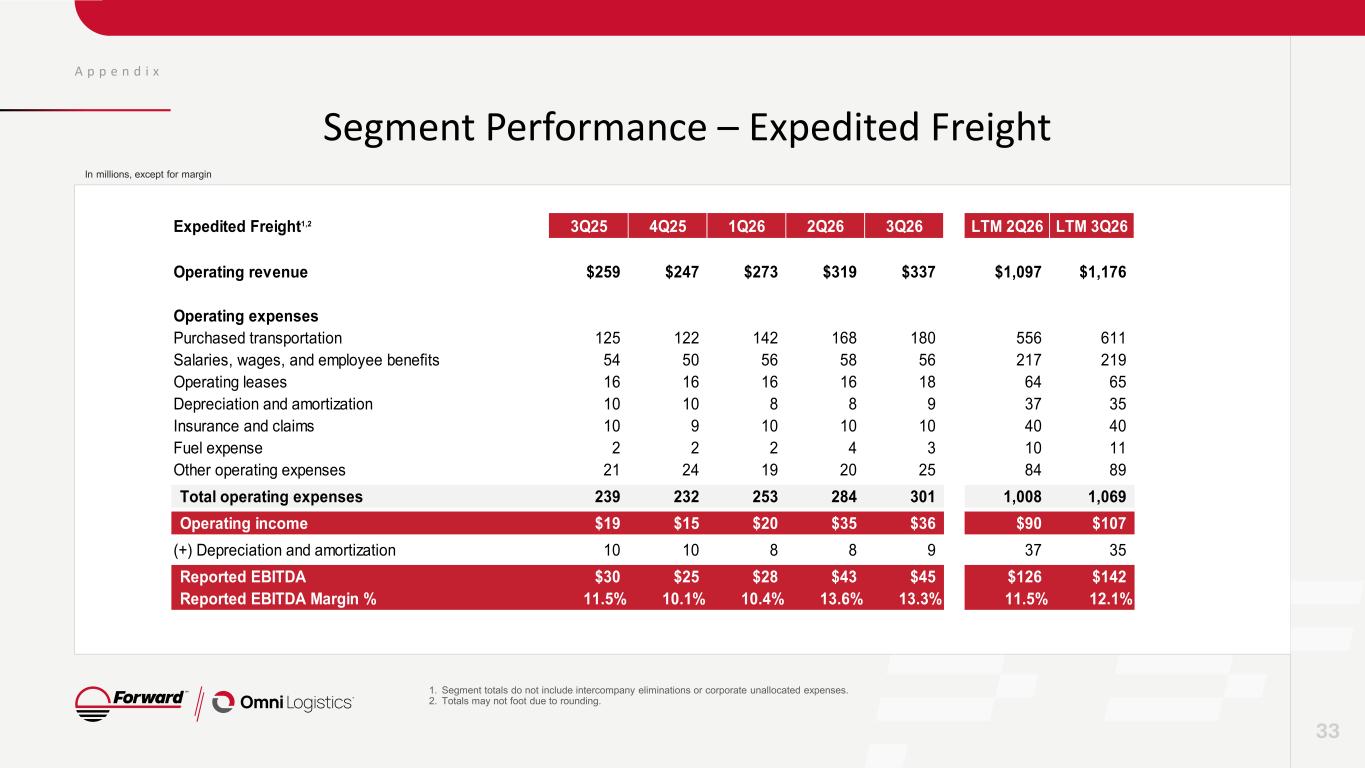
A p p e n d i x Segment Performance – Expedited Freight 33 1. Segment totals do not include intercompany eliminations or corporate unallocated expenses. 2. Totals may not foot due to rounding. In millions, except for margin Expedited Freight1,2 3Q25 4Q25 1Q26 2Q26 3Q26 LTM 2Q26 LTM 3Q26 Operating revenue $259 $247 $273 $319 $337 $1,097 $1,176 Operating expenses Purchased transportation 125 122 142 168 180 556 611 Salaries, wages, and employee benefits 54 50 56 58 56 217 219 Operating leases 16 16 16 16 18 64 65 Depreciation and amortization 10 10 8 8 9 37 35 Insurance and claims 10 9 10 10 10 40 40 Fuel expense 2 2 2 4 3 10 11 Other operating expenses 21 24 19 20 25 84 89 Total operating expenses 239 232 253 284 301 1,008 1,069 Operating income $19 $15 $20 $35 $36 $90 $107 (+) Depreciation and amortization 10 10 8 8 9 37 35 Reported EBITDA $30 $25 $28 $43 $45 $126 $142 Reported EBITDA Margin % 11.5% 10.1% 10.4% 13.6% 13.3% 11.5% 12.1%
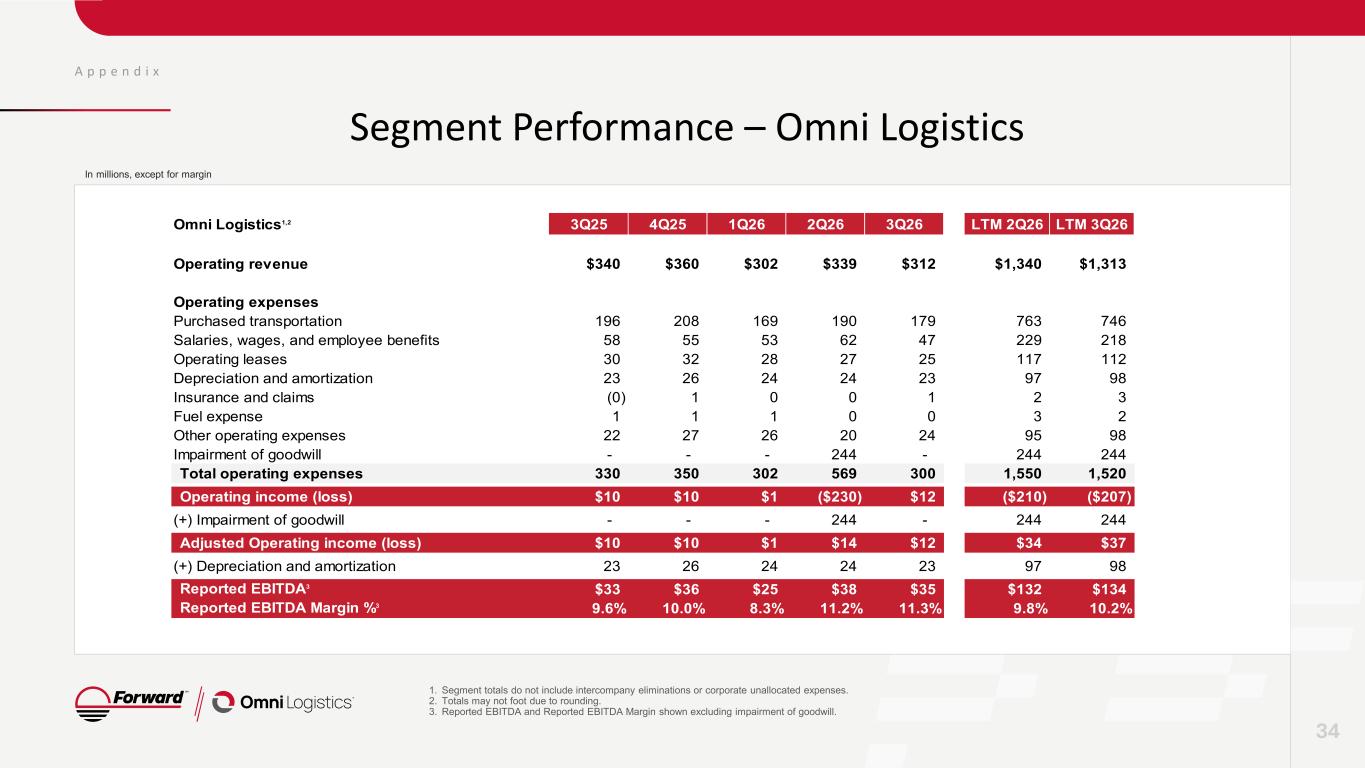
A p p e n d i x Segment Performance – Omni Logistics 34 1. Segment totals do not include intercompany eliminations or corporate unallocated expenses. 2. Totals may not foot due to rounding. 3. Reported EBITDA and Reported EBITDA Margin shown excluding impairment of goodwill. In millions, except for margin Omni Logistics1,2 3Q25 4Q25 1Q26 2Q26 3Q26 LTM 2Q26 LTM 3Q26 Operating revenue $340 $360 $302 $339 $312 $1,340 $1,313 Operating expenses Purchased transportation 196 208 169 190 179 763 746 Salaries, wages, and employee benefits 58 55 53 62 47 229 218 Operating leases 30 32 28 27 25 117 112 Depreciation and amortization 23 26 24 24 23 97 98 Insurance and claims (0) 1 0 0 1 2 3 Fuel expense 1 1 1 0 0 3 2 Other operating expenses 22 27 26 20 24 95 98 Impairment of goodwill - - - 244 - 244 244 Total operating expenses 330 350 302 569 300 1,550 1,520 Operating income (loss) $10 $10 $1 ($230) $12 ($210) ($207) (+) Impairment of goodwill - - - 244 - 244 244 Adjusted Operating income (loss) $10 $10 $1 $14 $12 $34 $37 (+) Depreciation and amortization 23 26 24 24 23 97 98 Reported EBITDA3 $33 $36 $25 $38 $35 $132 $134 Reported EBITDA Margin %3 9.6% 10.0% 8.3% 11.2% 11.3% 9.8% 10.2%
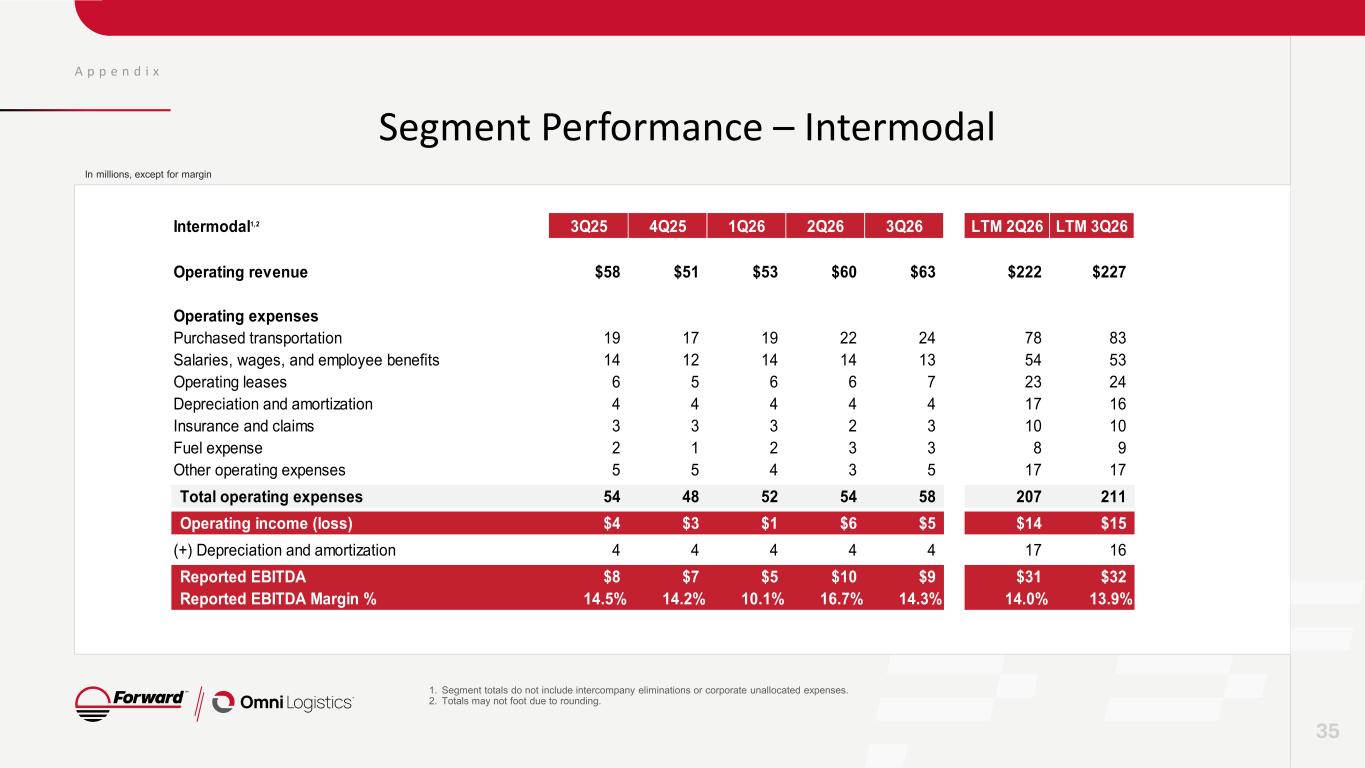
A p p e n d i x Segment Performance – Intermodal 35 1. Segment totals do not include intercompany eliminations or corporate unallocated expenses. 2. Totals may not foot due to rounding. In millions, except for margin Intermodal1,2 3Q25 4Q25 1Q26 2Q26 3Q26 LTM 2Q26 LTM 3Q26 Operating revenue $58 $51 $53 $60 $63 $222 $227 Operating expenses Purchased transportation 19 17 19 22 24 78 83 Salaries, wages, and employee benefits 14 12 14 14 13 54 53 Operating leases 6 5 6 6 7 23 24 Depreciation and amortization 4 4 4 4 4 17 16 Insurance and claims 3 3 3 2 3 10 10 Fuel expense 2 1 2 3 3 8 9 Other operating expenses 5 5 4 3 5 17 17 Total operating expenses 54 48 52 54 58 207 211 Operating income (loss) $4 $3 $1 $6 $5 $14 $15 (+) Depreciation and amortization 4 4 4 4 4 17 16 Reported EBITDA $8 $7 $5 $10 $9 $31 $32 Reported EBITDA Margin % 14.5% 14.2% 10.1% 16.7% 14.3% 14.0% 13.9%
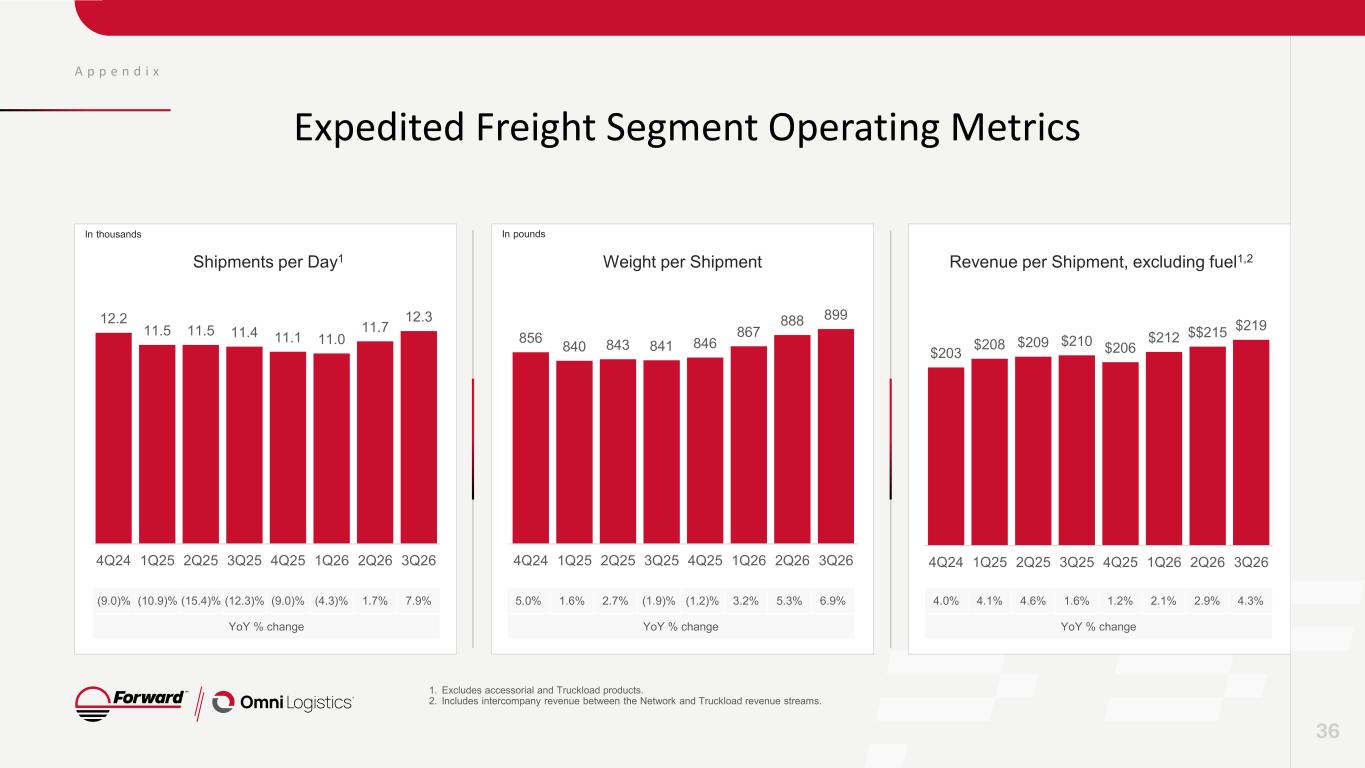
A p p e n d i x Expedited Freight Segment Operating Metrics 36 Shipments per Day1 Weight per Shipment Revenue per Shipment, excluding fuel1,2 In thousands In pounds (9.0)% (10.9)% (15.4)% (12.3)% (9.0)% (4.3)% 1.7% 7.9% YoY % change 5.0% 1.6% 2.7% (1.9)% (1.2)% 3.2% 5.3% 6.9% YoY % change 4.0% 4.1% 4.6% 1.6% 1.2% 2.1% 2.9% 4.3% YoY % change 1. Excludes accessorial and Truckload products. 2. Includes intercompany revenue between the Network and Truckload revenue streams. 12.2 11.5 11.5 11.4 11.1 11.0 11.7 12.3 4Q24 1Q25 2Q25 3Q25 4Q25 1Q26 2Q26 3Q26 856 840 843 841 846 867 888 899 4Q24 1Q25 2Q25 3Q25 4Q25 1Q26 2Q26 3Q26 $203 $208 $209 $210 $206 $212 $$215 $219 4Q24 1Q25 2Q25 3Q25 4Q25 1Q26 2Q26 3Q26
Forward Air Corporation (NASDAQ: FWRD) IR Contact | Tony Carreño investorrelations@forwardair.com https://ir.forwardaircorp.com